
The importance of sample preparation method in testing air jet removal efficiencies of trace explosive particles relevant to non-contact sampling †
Robert Fletchera,
Alexander Bulk b,
Matthew Staymates*a and
Greg Gillena
b,
Matthew Staymates*a and
Greg Gillena
aMaterials Measurement Laboratory, National Institute of Standards and Technology, Gaithersburg, MD 20899, USA. E-mail: robert.fletcher@nist.gov
bNational Renewable Energy Laboratory, Golden, CO 80401, USA
First published on 15th August 2025
Abstract
In particular, we study the influence of sample preparation methods on the removal efficiency of cyclotrimethylenetrinitramine (RDX) particles from clean glass slides via air jet impingement. Five different sample preparation methods are investigated covering a range of potential contamination scenarios. These include (1) dry sieve, (2) artificial fingerprint without sebum, (3) artificial fingerprint with sebum, (4) dry transfer and (5) direct pipetting of an aqueous suspension. Results show clear differences in RDX particle removal efficiency with sample preparation method, with a range from undetectable to almost 90%. A custom aerodynamic sampling testbed was developed for the testing that tightly controls air jet pressure, standoff distance and impingement angle while minimizing particle losses to the lab environment. Differential interference contrast (DIC) light microscopy was used to image RDX particles ranging in diameter from 5 μm to over 100 μm before and after jet impingement, with semi-automated post-processing used to determine total particle removal efficiency. The results of this study suggest that testing and evaluation procedures used for trace contraband screening systems that utilize non-contact aerodynamic sampling should consider the role of test sample preparation when designing and defining testing methodologies.
Introduction
Trace contraband screening involves the collection of trace particle residues of explosives and narcotics from people and their belongings with subsequent identification by chemical analysis.1 Most commonly, samples are collected using contact swipe sampling. Recent trends in trace detection, especially for aviation security checkpoints, have focused on development of non-contact aerodynamic sampling methods, where there is no physical contact – air jets or motion are used to displace particles from the surface. This change has been driven, in part, by a desire to minimize physical contact between screeners and passengers and because non-contact sampling methods may improve detection from surfaces such as luggage and clothing that have complex rough surface morphologies. Rough surfaces can be difficult to sample for trace particles via contact sampling because only a limited area can be touched and particles can be located in cracks and crevices (valleys) avoiding swipe contact. Non-contact sampling is thought to improve sampling, because aerodynamic forces can reach and remove some of these hard to reach, buried particles. Also, non-contact sampling can potentially decrease screening time by eliminating slow contact methods and at the same time, increase screened surface areas that can be interrogated.2,3Aerodynamic sampling is an emerging non-contact sampling methodology that involves the manipulation of airflow over surfaces to effectively liberate and transport trace materials from the surface to a sensor for identification.4–7 This is typically done with high-pressure air jets for particle removal and filter or impactor systems downstream for collection.8 The current study focuses on air jet testing and not on particle collection. Several papers have previously focused on removal efficiency of explosive materials3,9–13 (see ESI section† for more detail). In the current study, we build upon this work by studying the removal of cyclotrimethylenetrinitramine (RDX) particles deposited on a glass substrate using five different preparation methods. RDX is the most important military explosive in modern day use, and is a component in both composite and plastic explosives. It is also one of the most studied energetic materials, and information available in the literature can be used to guide the development of standard test materials for trace. RDX is produced by two main processes (1) Henning/Hale/Woolwich or nitric acid reaction with hexamethylenetetramine (forming Type 1 RDX) and (2) the Bachmann or acetic anhydride reaction (forming Type 2 RDX).14,15 Glass slides were chosen because of their uniform smooth surface and their availability to any analyst (a universal standard surface). Optical microscopy, the method of detection for the RDX particles, is greatly enabled using a uniform flat surface where all particles are in a single plane. Rough or non-uniform surfaces will also have variable particle removal efficiencies owing to the ridge or valley structure. Rough surfaces may give different results from the glass surface. However, the logic is to suggest a test method that will not rely on complex surfaces. Since the authors have no knowledge of the procedure nor the test surface, it is reasonable to choose a uniform flat smooth surface for testing a non-contact sampling method. A single set of air jet invariant parameters common to all experiments was selected so that the sample preparation methods would be the only variable and could be intercompared.
Materials and methods
This experiment is essentially composed of three components, (1) test sample preparation via particle deposition, (2) air jet particle removal and (3) microscopy followed by particle image analysis – the last two components by experimental design are standardized (see ESI†). The air-jet particle removal step is conducted in a NIST aerodynamic sampling test bed (also described in ESI section†) and is standardized so each sample received the same ambient laboratory conditions and air jet impingement velocity (and turbulence) so that meaningful comparisons between the different sample preparations can be made. Polystyrene microspheres (cas # 9003-53-6) were used as test materials in the aerodynamic test bed to compare to past results (ESI section†). The light microscopy image analysis was standardized to assure that the same sample area on the glass slide containing the particles before and after jetting are cataloged for each sample. Sample preparation, while using the same RDX material, entailed significant method variation. It is the resultant difference in removal efficiency as a function of sample preparation that is the main thrust of this paper.Sample preparation methods
Method 1. Dry sieving the dry sieve method of deposition was intended to mimic realistic powder dispersal and gravitational settling of airborne particles. Separately, Mil-Spec Class 5 and Class 1 RDX particles were passed through a custom 100 μm mesh sieve and permitted to gravitationally settle onto a glass microscope slide. A mask constrained the particles to a 10 μm-diameter circle on the slide. The mass of material was not controlled, but the sample had a visible number of particles. Sample masses calculated from microscopic sample images is on the order of 10 mg of RDX.
Method 2. Fingerprint deposition (no sebum). In this method an artificial finger was used to mimic the deposition of explosives by a gloved hand.36 Class 5 RDX particles were dispersed in a water suspension and filtered from the suspension through a nucleopore track-etch polycarbonate membrane filter (Corning Inc, Corning, NY) and allowed to dry on the filter. An artificial human index fingertip was fabricated from a human finger mold using ballistics gelatin, and then mounted to the handle of a repurposed fruit juicer, enabling repeatable fingerprint-like deposition with a force of approximately 10 N distributed over an approximate 10 μm diameter area. Samples were produced by pressing the finger first on the RDX-seeded filter, loading the ballistic-gel finger with RDX particles and then the fingertip was pressed onto a glass microscope slide. The mass of material was not controlled here, but a visible amount of material was observed for each sample.
Method 3. Fingerprint deposition with sebum similar to the Method 2 above. Class 5 RDX particles were filtered and dried on a membrane filter. The artificial fingertip was pressed onto the RDX filter, and then pressed onto a glass microscope slide that in this case contained a thin layer of sebaceous material (sebum) intended to more closely mimic a real fingerprint with normal fingerprint oils.17 Neither the mass of RDX or the sebum materials were controlled, but a visible amount of material was observed for each sample.
Method 4. Dry transfer the dry transfer method is a commonly used approach for creating standard test surfaces contaminated with a known mass of explosive material.16 A modified dry-transfer approach was used to transfer RDX particles from a Teflon strip to the glass substrate. A solution of RDX dissolved in isopropyl alcohol (IPA) was pipetted onto a Teflon strip and allowed to fully dry. Then, the PTFE strip containing approximately 1 mg of RDX was carefully pressed and pulled along the glass substrate to transfer the deposit from the strip to the glass. The deposit was constrained within an approximately 10 mm diameter area in the center of the glass microscope slide. The dry-transfer of material from Teflon strip to a glass slide was performed manually on a mass balance to ensure that a force of 11 N to 13 N was used for all samples.
Method 5. Liquid deposition of suspensions. Class 5 RDX particles suspended in water were directly pipetted onto the glass slide. Approximately 1 μg of material was deposited in an approximate 1 cm – diameter spot. These samples were allowed to dry for at least 24 hours prior to sampling.
NIST aerodynamic sampling testbed
Details of the custom NIST-designed aerodynamic sampling test stand are contained in the ESI.† The test stand has a standardized the air jet, providing a single jet velocity that is precisely reproducible for all samples. In these experiments, the jet pressure and standoff distance were held at a constant 101.4 kPa (14.7 psi relative to atmospheric pressure) and 25 mm, respectively. The air jet angle was 45° from horizontal. The 1 mm circular diameter jet is pulsed for 100 ms with 200 ms delay. For the experimental conditions, the jet velocity is calculated to be 326 m s−1 and the maximum shear stress estimated to be 63.7 Pa.18Particle image analysis
Particle removal efficiency was calculated by measuring the total area (areas summed of all individual particles) occupied by particles in images taken before and after air jet impingement. The efficiency of removal, εr, was then calculated for each sample by:
 | (1) |
Results and discussion
Deposition characteristics
There were variations in the shapes and size distributions of RDX particles for each of the deposition methods. Example images for each method are shown in the collage in Fig. 1. The particle images and the segmented image are shown. The particle areas are determined from the segmented images and the areas are grouped by size in histogram bins. The binned particle size distribution as a percentage of the total particles for each deposition method is provided in Fig. 2. Uncertainty shown in Fig. 2 are the standard deviation across five (n = 5) repeated experimental samples within a given method. Particle diameter was determined by the software that averages the length of 90 lines extending from the particle edge and bisecting the centroid of the particle. The particle diameter of irregular particles is thus an average diameter based on an accepted method for determining particle size. | ||
| Fig. 1 Example microscopy images of the five RDX deposition methods studied here. (A) Method 1: sieved, (B) Method 2: artificial fingerprint, (C) Method 3: artificial fingerprint including sebaceous material, (D) Method 4: dry transfer from Teflon, (E) Method 5: pipetted H2O suspension. | ||
 | ||
| Fig. 2 RDX particle size distribution histograms for each deposition method. Uncertainties are standard deviations based on n = 5 measurements. | ||
The upper row contains original images taken from the larger set of tiled mosaics. The lower row shows the same image after segmentation with a threshold level of 50 (on a scale from 0 to 255) – a value that most pre-impingement images required to fully capture the area of a particle.
Fig. 2 presents a relative measure of number of particles in 3 particle size segments (5 to 10, 10 to 40 and 40 to 100) μm diameter. Small particles are defined as less than or equal to 20 μm in diameter. This plot shows the distribution based on 100% of the particles counted for each sample preparation method.
The dry sieve (Method 1) provided a large fraction of particles in the (5 to 10) μm particle size range, a proposed bias in the small size region with about 20% of the particles in the (10 to 40) μm and less than 2% in the large particle region of (40 to 100) μm. The screen filtering may be the mechanism shifting the frequency to the small particles. The dry fingerprint sample, Method 2, was distributed in a similar manner with more particles in the mid-range and less in the small end. The sebum containing fingerprint, Method 3, was fairly evenly distributed between the (5 to 10) μm size range and the (10 to 40) μm range. The sebum may help to capture and transfer the larger particles from the artificial finger to the glass surface. Dry transfer, Method 4, transfers many small particles to the glass slide and about 35% in the (10 to 40) μm range. From the process, one could expect smaller particles from recrystallization on the Teflon surface and possible aggregates of these small particles in the transfer process. It was observed that dry transfer of recrystallized RDX from Teflon to glass (Method 4) produced long linear streaks parallel to the direction of swiping. Particles greater than about 10 μm were scattered across the entire deposition area, however most particles oriented in streaks were less than 10 μm in diameter. This might be caused by the fracturing of large particles into smaller agglomerates or single crystals during the transfer process.20 For the last sample, delivery of particles from an aqueous suspension, Method 5, there were about equal number of particles in the small and mid-size region. Method 5 produced a “coffee ring” of RDX crystals along the outer edge of the evaporated droplet with very few particles in the center of the sample. A possible promising additional method not reported here is dry transfer from dried suspension deposit. The potential advantage would be larger, more presentative particles with considerably less surface binding force. A sample of Class 5 RDX is shown to have most of the particles in the (10 to 40) μm size range. The RDX particle size distribution was found for RDX particles collected on a glass slide by simply touching the glass to the powder, not a true representative sample of the population. None of the preparation methods provided particle size distributions matching the CL 5 (in green) with sebum fingerprint and suspension delivery the closest.
Removal results
Removal efficiency for all five deposition methods is given in Fig. 3 and show that the particle removal efficiency of RDX can vary dramatically based on the method used to prepare the sample. Removal can vary between undetectable and almost 90% removal. RDX particles were most easily removed with the dry sieve method, with an average of 88 ± 6%. This was no surprise, since these samples were made by gravitational settling of particles and no additional adhesion from other materials. In all cases, the particle size distributions contained some fraction of large particles (>20 μm in diameter) which are generally more easily removed by air jet impingement than small (<20 μm in diameter) particles.10–12,20,21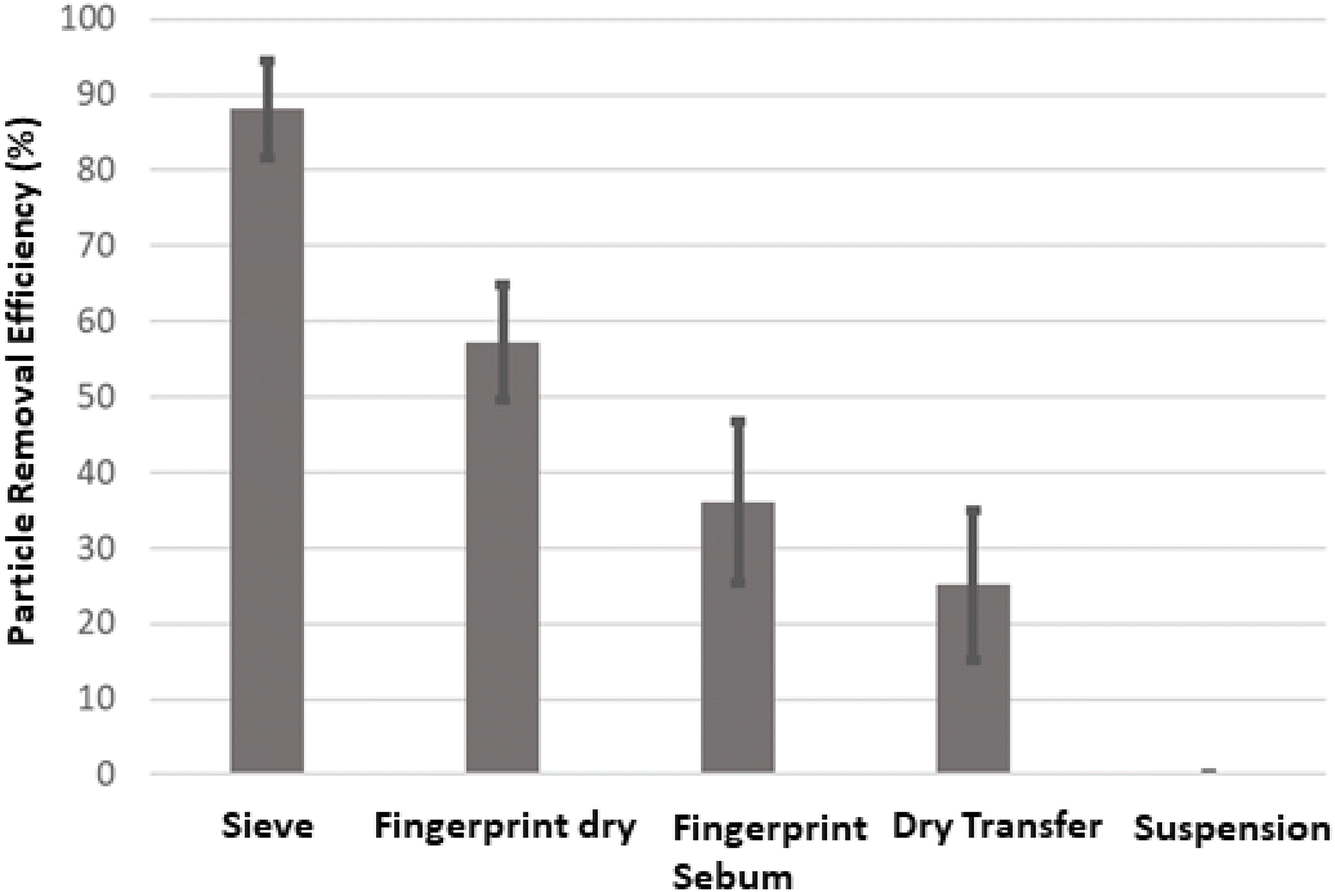 | ||
| Fig. 3 Overall RDX particle removal efficiency via air jet impingement for five different sample deposition methods. Mean values and the standard deviation of 5 samples for each deposition method are shown. The vertical axis is removal efficiency in percent. | ||
The dry fingerprint had a removal efficiency of (57 ± 8) % and the sebum fingerprint was at (36 ± 11) %. The addition of the sebum adds an adhesive that reduces the effectiveness of the air jet at removing particles. The act of physically pressing the RDX particles onto the glass substrate may create additional adhesion of the particles, as evidenced by the difference between dry sieve and dry fingerprint. There also may be differences in particle orientation, more particle to surface contact, and lower height which would affect the removal efficiency at constant jet velocity. Larger crystals may be crushed or flattened, shifting the size fractions.
The dry transfer method had an air jet removal efficiency of (25 ± 10) %. This is approximately the same efficiency found in an extensive study for wipe removal of particles using muslin, Texwipe cotton and metal mesh materials.22 We believe this reduced efficiency is due to, in part, the small particle size associated with these samples. Additionally, the dry transfer method may impart, during the transfer process, a preferred particle orientation. Since RDX particles are compressed into and dragged across the surface during dry transfer, it is possible that they are also reoriented such that the particle height, or frontal area normal to the drag force is reduced. Also, because dry-transferred particles were dragged across a 3 cm-length, particles furthest away from the centroid of the impinging air jet become subject to a reduced drag force.12,23
The particle removal efficiency of the water suspension deposition sample was undetectable under the air jet conditions used in this study. The particles in these samples were tightly bound to the surface and the air jet was unable to remove them most likely because of strong capillary forces formed as the water evaporated (Bhattacharya and Mittel).24 A water suspension is not an appropriate way to create test samples for any kind of air jet related non-contact aerodynamic sampling system. However, for test samples where the particles are to remain attached to the surface, such as for Raman and IR based optical trace detection techniques aqueous suspension may be the method of choice due to their stability. The removal efficiencies are all statistically different as determined by a Student's t-test at the 95% level except for two methods, fingerprint with sebum and dry transfer.
Discussion of removal efficiency
While total area through summing particle data was used for the efficiency determinations, we can also extract individual particle information. Fig. 4 shows the average particle size distributions of the five methods used in the study. The distributions are presented in histogram format with pre-jet (i) in red and post-jet (f) in blue. The sieve method illustrates the fact that large particles are more easily removed by aerodynamic sampling (compare heights of red and blue bars), especially in the larger particle region of the distribution (>20 μm). In the sieve case, RDX is gently deposited on the glass surface and held on the surface predominately by only van der Waals forces. The dry fingerprint method is similar to the sieve method except in this case particles must be transferred from two surfaces – particle to the artificial finger and then particle from finger to the glass. There is also some force (10 to 12) N applied by the artificial finger which may help to crush, flatten, or orient the RDX crystals. For some unknown reason, the particle size distribution is skewed toward small particles. Fingerprint with sebum includes both large and small particles that are not readily removed from the surface because the sebum helps to increase the attachment by possibly increasing the contact area. There appears to be more large particles in the sebum case flatting the particle size distribution. Transfer of large (>20 μm) particles from the artificial finger to glass is more effective with sebum. | ||
| Fig. 4 Histogram representation of RDX particle number versus size before air jet (red) and after jetting (blue) for all 5 methods of particle deposition. Plots show number of particles; removal efficiency is defined in this paper based on total particle area and not total particle number. Uncertainties are expressed as standard uncertainty (n = 5). | ||
The dry transfer method has few large particles (>20 μm), and particles < 20 μm are not as easily removed. Lastly, the liquid water suspension delivery method showed no particle removal. These particles are tightly bound due to most likely capillary forces as discussed above.
Fig. 5 shows the RDX particle removal efficiency as a function of particle size. Particle size is based on two-dimensional particle area. Particle height above the plane (largely unknown) is relevant for fluid dynamic interaction and is assumed to be proportional to the area which may be different depending on the method used to form the particles.13 From the plot, the order of removal efficiency for particles with a diameter of 40 μm is sieve > dry fingerprint > dry transfer > sebum containing fingerprint > water suspension. This relationship again shows the effect of how particles are being held on the surface, and fluid dynamic interactions, on particle removal.
 | ||
| Fig. 5 The particle removal efficiency as a function of particle diameter for the 5 methods of sample preparation. Points are the mean values (n = 5) and the uncertainty is the standard uncertainty in the mean. | ||
Summary and future efforts
This study tests particle removal efficiencies for RDX particles on smooth glass slides deposited by a number of methods. The major result that we report is that sample preparation method significantly affects the test results for aerodynamic sampling. Particle removal measurements using a robust, reproducible aerodynamic test bed shows that particles deposited by simple gravitational settling, which mimics powder dispersion mechanisms, are the most readily and easily removed from the test surface. Particles deposited by fingerprint methods and by dry transfer are not as easily liberated and particles put down from water suspension are effectively glued to the surface.Aerodynamic removal efficiency of RDX powder is dependent upon particle characteristics such as size, surface contact, height, surface adhesion and morphology. If the overall sampling effectiveness of this prototype system is a real-world operational scenario, then a sebum fingerprint would be best choice of challenge test sample, as this is one of the generally accepted routes of contamination. The dry transfer method produces a sample that is difficult to remove via air jet and may be an unsuitable method for practical aerodynamic testing. The dry transfer method is the best at transferring a quantifiable amount of material to a surface, which is likely why it is a preferred method, used extensively in testing and evaluation studies. Dry transfer methods are useful for quantification and system response evaluation but provides limited control over particle size and morphology – critical particle parameters for non-contact sampling systems. Note that dry transfer testing may provide the lower bound testing method. If you can sample and detect RDX particle removal from dry transfer, most likely all the other methods will test positive with exception of liquid suspension.
This measurement system can be applied to investigate other materials of interest, including additional explosive threats and drugs of abuse such as opioids. Information gathered from these experiments could help inform agencies focused on drug and explosives screening of packages entering the country and distributed through the mail. Additionally, a design-of-experiments approach could be used to understand the relationship between other air jet parameters (jet pressure, standoff distance, nozzle diameter, impingement angle, etc.) and particle removal efficiency from surfaces. Developing quantitative material deposition methods that control the mass of trace residue delivered to the surface would enable studies that relate removal efficiencies with limits of detection for different detection technologies.
A limitation of the current experimental design is that a glass or optically transparent substrates are used because light microscopy is employed for determination of particle removal efficiency. A new quantitative measurement approach that collects the liberated material onto a mesh filter is being considered. This filter can then be chemically analyzed via thermal desorption mass spectrometry25,26 directly using a custom large-format thermal desorber. This would enable rapid measurement of particle removal efficiency on a variety of operationally relevant surfaces (luggage material, packing tape, shoes, cardboard boxes, etc.) rather than only glass slides, with the ultimate goal of creating a test object or item containing a reproducible and quantifiable material in a form factor that mimics a real-world threat.
Data availability
Data that is the basis of this manuscript is available from https://doi.org/10.18434/mds2-3721.Conflicts of interest
The authors have no conflicts to declare.Acknowledgements
The authors recognize Dr Karole Blythe for the particle size data for RDX Class 5 material. This work was partially funded through an interagency agreement with Department of Homeland Security Science and Technology Directorate (DHS S&T) Contract Number: 70RSAT21KPM000083 MOD 3.References
- J. Yinon, Forensic and Environmental Detection of Explosives, John Wiley, Chichester, NY, 1999, Google Scholar open URL Search PubMed
.
- M. Staymates, G. Gillen, J. Grandner and S. Lukow, The development of an aerodynamic shoe sampling system, Proceedings of 2011 IEEE International Conference on Technologies for Homeland Security (HST), 2011, p. 276 Search PubMed
- G. S. Settles, J. Fluids Eng. Trans. ASME, 2005, 127, 189, DOI:10.1115/1.1891146
- M. R. Fulghum, M. J. Hargather and G. S. Settles, IEEE Sens. J., 2013, 13, 1252 CAS
- B. A. Craven, M. J. Hargather, J. A. Volpe, S. P. Frymire and G. S. Settles, IEEE Sens. J., 2014, 14, 1852 Search PubMed
- M. J. Hargather, M. E. Staymates, M. J. Madalis, D. J. Smith and G. S. Settles, IEEE Sens. J., 2011, 11, 1184 CAS
- B. G. Rich, G. Vandrish and R. Pomalis, An automated detection system for large vehicle-bombs, IEEE Xplore, 2000, p. 201, DOI:10.1109/CCST.2000.891188, ISBN: 0-7803-5965-8
- M. Staymates, J. Bottiger, D. Schepers and J. Staymates, Aerosol Sci. Technol., 2013, 47, 945 CrossRef CAS
- D. Phares, J. Holt, G. Smedley and R. Flagan, Jour, Forensic Sci., 2000, 45, 774 CrossRef CAS
- R. Fletcher, N. Briggs, E. Ferguson and G. Gillen, Aerosol Sci. Technol., 2008, 42, 1052 CrossRef CAS
- R. Keedy, E. Dengler, P. Ariessohn, I. Novosselov and A. Aliseda, Aerosol Sci. Technol., 2012, 46, 148 CrossRef CAS
- K. Kottapalli and I. V. Novosselov, Aerosol Sci. Technol., 2019, 53, 549 CrossRef CAS
- K. Kottapalli, Thesis, University of Washington, 2017
- J. P. Agrawal and R. D. Hodgson, Organic Chemistry of Explosives, John Wiley and Sons, West Sussex, England, 2007, p. 384 Search PubMed
- R. M. Doherty and D. S. Watt, Relationship between RDX Properties and Sensitivity, Propellants, Propellants, Explos. Pyrotech., 2008, 33(1), 4–13 CrossRef CAS
- R. Chamberlain, Dry transfer method for the preparation of explosives test samples, US6470730B1, US Department of Homeland Security, USA, 2002
- E. Sisco, J. Staymates and K. Schilling, J. Can. Soc. Forensic. Sci., 2015, 48, 200 CrossRef
- R. M. Young, M. J. Hargather and G. S. Settles, J. Aerosol Sci., 2013, 62, 15 CrossRef CAS
- P. Fillingham, K. Kottapalli, X. Zhan and I. V. Novosselov, J. Aerosol Sci., 2019, 128, 89, DOI:10.1016/j.jaerosci.2018.11.006
- B. Y. H. Liu, S. H. Yoo, J. P. Davies, G. Gresham and S. F. Hallowell, Cargo Inspection Techn, Internal. Soc. Optics and Photonic, 1994, 2276, 44, DOI:10.1117/12.189199
- K. W. Nicholson, Atmos. Environ., 1988, 22, 2653 CrossRef CAS
- V. Novosselov, C. A. Coultas-McKenney and L. Miroshnik, et al., Talanta, 2021, 234, 122633 CrossRef PubMed
- G. T. Smedley, D. J. Phares and R. C. Flagan, Exp. Fluid, 2001, 30, 135 CrossRef CAS
- S. Bhattacharya and K. L. Mittal, Surf. Technol., 1978, 7, 413 CrossRef CAS
- T. P. Forbes, E. Sisco, M. Staymates and G. Gillen, Anal. Methods, 2017, 9, 4988 RSC
- E. Sisco, T. P. Forbes, M. E. Staymates and G. Gillen, Anal. Methods, 2016, 8, 6494 RSC
- D. Fisher, R. Zach, Y. Matana, P. Elia, S. Shustack, Y. Sharon and Y. Zeiri, Talanta, 2017, 174, 92 CrossRef CAS PubMed
- D. Zimon, Adhesion of Dust and Powder, Consultants Bureau, NewYork, 1982, pp. 307–325 Search PubMed
- C. Henry and J.-P. Minier, Prog. Energy Combust. Sci., 2014, 45, 1 CrossRef
- M. B. Ranade, Aerosol Sci. Technol., 1987, 7, 161 CrossRef CAS
- B. Nasr, S. Dhaniyala and G. Ahmadi, Developments in Surface Contamination and Cleaning: Types of Contamination and Contamination Resources, ed. R. Kohli and K. L. Mittal (William Andrew Publishing, 2017) Search PubMed
- G. Ziskind, L. P. Yarin, S. Peles and C. Gutfinger, Aerosol Sci. Technol., 2002, 36, 652 CrossRef CAS
- Y. Otani, N. Namiki and H. Emi, Aerosol Sci. Technol., 1995, 23, 665 CrossRef CAS
- J. Kesavan, P. Humphreys, B. Nasr, G. Ahmadi, C. K. Knox, E. Valdes, V. Rastogi and S. Dhaniyala, Aerosol Sci. Technol., 2017, 51, 377 CrossRef CAS
- 398D MIL-DTL RDX(http://everyspec.com/MIL-STD).
- M. Papantonakis, V. Nguyen, R. Furstenberg, A. McGill, Characterization of particles of explosives materials found in fingerprints, Proc. SPIE PC12116, Chemical, Biological, Radiological, Nuclear, and Explosives (CBRNE) Sensing XXIII, 2022, p. PC1211606, DOI:10.1117/12.2618866
Footnotes |
| † Electronic supplementary information (ESI) available.19,27–35 See DOI: https://doi.org/10.1039/d5ay00372e |
| ‡ Commercial equipment, instruments, and materials, or software are identified in this article to specify adequately the experimental procedure. Such identification does not imply recommendation or endorsement of these items by the NIST, nor does it imply that they are the best available for the purpose. |
| This journal is © The Royal Society of Chemistry 2025 |