
Efficient photoelectrocatalytic performances using a WO3/BiVO4 heterojunction photoanode: applied bias-promoted photoinduced charge transfer and separation†
Yunni
Liu
a,
Yuna
Kang
a,
Zhenyi
Zhang
 b and
Jun
Lin
*a
b and
Jun
Lin
*a
aSchool of Chemistry and Life Resources, Renmin University of China, Beijing 100872, P. R. China. E-mail: jlin@ruc.edu.cn
bKey Laboratory of New Energy and Rare Earth Resource Utilization of State Ethnic Affairs Commission, Key Laboratory of Photosensitive Materials & Devices of Liaoning Province, School of Physics and Materials Engineering, Dalian Minzu University, Dalian 116600, P. R. China
First published on 3rd July 2025
Abstract
Combining tungsten trioxide (WO3) with bismuth vanadate (BiVO4) to form a heterojunction photoanode offers a promising solution to achieving highly efficient photoelectrocatalytic (PEC) performances. In this work, we successfully fabricated the WO3/BiVO4 heterojunction on tungsten (W) foil via a hydrothermal route, followed by a successive ionic layer adsorption and reaction (SILAR) process. The PEC performances for synergetic H2 evolution and organic pollutant degradation were significantly enhanced after the BiVO4 nanoparticles were loaded on the WO3 photoanode. The PEC performance with the WO3/BiVO4 heterojunction as the photoanode was demonstrated to be much more dependent on the applied bias potential (Vab) than that with pristine WO3 as the photoanode. Based on the various photoelectrochemical features and fundamental theory of semiconductor heterojunctions, it was well elucidated that, under the applied bias potential, the gradual diminishment and eventual reversal of the energy band bending at the heterojunction interface could achieve the efficient transfer and separation of more photogenerated charges, thereby enhancing overall PEC performances. This work highlights the roles of the evolution of the band bending in the WO3/BiVO4 heterojunction interface by applied bias in promoting the efficient transfer and separation of photogenerated charges.
1. Introduction
Nowadays, fossil energy consumption and the resulting environmental problems are critical issues that require immediate attention. Photoelectrocatalytic (PEC) processes based on semiconductor photoelectrodes provide a green and sustainable strategy for simultaneous wastewater treatment and energy/resource recovery by utilizing renewable solar energy.1–3 A typical PEC system consists of a semiconductor photoanode and a metallic cathode, both immersed in the corresponding electrolytes. The semiconductor photoanode as the core component of a PEC system is responsible for absorbing solar light and promoting the transfer of the photoinduced electron and hole to the cathode and its surface, respectively, with the assistance of an external bias potential, driving energy/resource recovery and pollutant degradation.4,5 To achieve highly efficient PEC performances, it is therefore essential to design and develop advanced photoanode materials with both excellent light-harvesting ability and high interfacial charge transfer and separation efficiency.Tungsten oxide (WO3), a typical n-type semiconductor with a narrow bandgap of approximately 2.4–2.8 eV, has received considerable attention for PEC applications because of its unique characteristics including good chemical stability, low cost and toxicity, as well as favorable photoelectric properties such as moderate hole diffusion length (∼150 nm) and excellent electron transport performance (∼12 cm2 V−1 s−1).6,7 Nevertheless, despite these advantages, WO3 alone as a photoanode still suffers from limited solar energy utilization and poor interfacial charge transfer and separation. To tackle this issue, several strategies have been developed to improve the efficiency of WO3 photoanodes, including nanostructure engineering, surface modification, and heterojunction construction with other semiconductors.8–14 Among the various strategies, the construction of a semiconductor heterojunction photoanode consisting of two or more different semiconductors provides more advantages for realizing an efficient PEC performance. Recently, numerous studies have shown that pairing WO3 with BiVO4 to form a heterojunction photoanode significantly improves PEC performance compared to either of the individual materials. The improved PEC performance with the WO3/BiVO4 heterojunction as a photoanode was generally ascribed to the favorable band alignment of two semiconductor oxides with excellent light-harvesting ability and efficient charge transport properties.15–20 The band alignment and bending of the WO3/BiVO4 heterojunction interface after their Fermi level equilibration, however, appear not to thermodynamically support the high utilization and separation efficiencies of photogenerated charges for an efficient PEC performance.21–23 Studies related to this problem are also rarely reported. To further develop heterojunction photoanodes for an efficient PEC process, we believe, it is desirable and meaningful to understand well as to how the charges at the WO3/BiVO4 heterojunction interface, especially, in the presence of applied bias potential, are effectively transferred and separated to achieve an efficient PEC performance.
Herein, a WO3/BiVO4 heterojunction was successfully produced on W metal foil through a simple hydrothermal route, followed by the successive ionic layer adsorption and reaction (SILAR) method. The loaded amount of nanoparticle BiVO4 was controlled well by the number of SILAR cycles. Compared to either of the individual WO3 and BiVO4 materials, the WO3/BiVO4 heterojunction as a photoanode, especially after 15 SILAR cycles, showed a significant enhancement in terms of the PEC performances for synergetic H2 evolution and organic pollutant degradation. Furthermore, according to the various photoelectrochemical features and PEC performances in the absence and presence of an applied bias potential, we elucidated the roles of the evolution of the band alignment and band bending at the heterojunction interface induced by applied bias in promoting the charge transfer and separation to achieve the efficient PEC performances in combination with the classical theory of semiconductor heterojunctions.
2. Experimental section
2.1. Preparation of the WO3 photoanode
WO3 nanosheet arrays were prepared via a hydrothermal etching process of the W metal surface in the presence of nitric acid and oxalic acid, where W foil was not only the substrate but also the W source material.24 Specifically, polished pieces of W foil with dimensions of 33 × 20 × 0.1 mm were ultrasonically cleaned in acetone, deionized water and ethanol in turn, before being dried in a nitrogen stream for use. Afterwards, the cleaned pieces of W foil were put into a 50 mL Teflon-lined autoclave containing 10 mL precursor aqueous solution with 0.5 M nitric acid and 0.01 M oxalic acid. The hydrothermal reaction was carried out at 120 °C for 6 h. After naturally cooling to room temperature, the resulting pieces of foil were rinsed with ethanol and deionized water, and subsequently annealed at 500 °C in air for 2 h with a ramp rate of 2 °C min−1 to improve the crystallinity of the WO3 produced on them.2.2. Fabrication of the WO3/BiVO4 heterojunction photoanode
BiVO4 nanoparticles were deposited on the surface of the as-prepared WO3 sample using a successive ionic layer adsorption and reaction (SILAR) method.25,26 In a typical process, two homogeneous solutions were prepared, respectively. One was 100 mL ethylene glycol with 1 mmol of Bi(NO3)3·5H2O, and the other was 100 mL aqueous solution with 1 mmol of NH4VO3 at pH = 3, as adjusted by HNO3. The as-prepared WO3 sample was immersed in the above two solutions for 30 s in each cyclically. After each immersion, the sample was washed with deionized water and dried by blowing air. The loaded amount of nanoparticle BiVO4 was controlled by the number of SILAR cycles. Finally, the resulting samples were annealed at 500 °C in air for 1 h to remove the residual chemicals and were named WO3/BiVO4-X, where X refers to the number of SILAR cycles (X = 5, 10, 15, and 20 cycles). For comparison, pristine BiVO4 on W metal foil was also prepared in the same manner. The formation route of the WO3 and WO3/BiVO4 heterojunction photoanodes on W foil is schematically illustrated in Fig. 1. | ||
| Fig. 1 Schematic illustrations of the fabrication routes of WO3 and the WO3/BiVO4-15 photoanode. | ||
2.3. Instruments and characterization
X-ray diffraction (XRD) patterns were collected on a Shimadzu XRD-7000 diffractometer using Cu Kα as X-ray radiation (λ = 1.5418 Å). The morphologies of samples were captured using a field emission scanning electron microscope (FESEM, S-4800). Transmission electron microscopy (TEM) and high-resolution TEM (HRTEM) images were taken on a JEM-F200 instrument equipped with an energy-dispersive X-ray spectrometer (EDS). The chemical states and composition of surface elements were analyzed using an X-ray photoelectron spectrometer (XPS, Thermo ESCALAB 250) with an Al radiation source. The peak positions of various elements were referenced to the C 1s peak of the surface adventitious carbon at 284.8 eV. UV-vis diffuse reflectance spectra (DRS) were recorded using a UV-vis spectrophotometer (Hitachi U-4100) with BaSO4 as the reference. The hydroxyl radicals (˙OH) generated during the PEC process were detected via electron spin resonance (ESR) spectroscopy (Bruker EMX-8/2.7, Germany) at room temperature with 5,5-dimethyl-1-pyrroline N-oxide (DMPO) as a trapper.2.4. Photoelectrocatalytic (PEC) performance tests
A typical PEC reaction was conducted in a H-cell with two reactors serving as the anode and cathode chamber (Fig. S1, ESI†), respectively, separated by a proton exchange membrane (Nafion 117). Both chambers contained 60 mL aqueous solutions of Na2SO4 (0.5 M), with rhodamine B (RhB, 10 ppm) in the anode chamber only. Prior to the PEC reaction, the photoanode was pre-soaked in the anode chamber for 20 min to reach adsorption–desorption equilibrium, and high-purity nitrogen (99.999%) was continuously introduced into the cathode chamber to remove the dissolved oxygen. After purging, the cathode chamber was hermetically sealed to maintain anaerobic conditions. The PEC reaction was initiated under simultaneous bias application and irradiation using a 300 W xenon lamp (LabSolar II, Perfect Light Co., Ltd) equipped with a UV-cutoff filter (λ ≥ 420 nm). The light intensity was measured to be approximately 300 mW cm−2. During the reaction, the solutions in both chambers were stirred at a constant magnetic stirring speed (500 rpm) to ensure efficient mass transfer. At a given interval, 3 mL of the solution and 0.5 mL volume of gas were sampled from the anode and cathode chamber, respectively, for the analysis of RhB concentration and H2 production. RhB concentration was determined using UV-vis spectrophotometry (Hitachi U-3900) at 554 nm. The amount of generated H2 was intermittently extracted from the cathode chamber using a gas sampling needle and quantified via gas chromatography (GC-2014C, TCD detector), with N2 as the carrier gas and a 5A molecular sieve column. All PEC reactions lasted for an hour, except for specific indication. Moreover, a fluorescence probe method with terephthalic acid (TA) as a trapping molecule was employed to detect the hydroxyl radicals (˙OH) formed during the PEC process.272.5. Photoelectrochemical measurements
All the photoelectrochemical measurements were performed using an electrochemical analyzer (CHI660E, Shanghai Chenhua) in a standard three-electrode system, consisting of the as-prepared samples (effective area: 4 cm2) as the working electrode, a Pt foil (99.99%, 4 cm2) as the counter electrode and a Ag/AgCl (saturated KCl) electrode as the reference electrode. All electrodes were immersed in an aqueous solution containing 0.5 M Na2SO4. A 300 W xenon lamp equipped with a cutoff filter (λ > 420 nm) was employed as the visible-light source to simulate solar radiation at room temperature. Mott–Schottky curves were recorded at the fixed frequencies of 1400, 1600 and 1800 Hz to determine the flat-band potential (Efb). The transient photocurrent densities were acquired under visible light irradiation (light on/off cycles: 20 s). Electrochemical impedance spectroscopy (EIS) analyses were conducted in the same solution under different applied bias potentials over the frequency range from 106 to 10−2 Hz with an alternating current (AC) voltage of 5 mV. The linear sweep voltammetry (LSV) curves were obtained at a scan rate of 10 mV s−1, ranging from 0 V to 1.0 V vs. Ag/AgCl, and the applied bias photon to current efficiencies (ABPE) were calculated based on the LSV curves. The applied bias of the Ag/AgCl electrode here was converted to the normal hydrogen electrode (NHE) scale according to the Nernst formula (in saturated KCl aqueous solution at 25 °C): ENHE = EAg/AgCl + 0.199, where ENHE represents the converted potential vs. NHE. EAg/AgCl is the obtained potential vs. Ag/AgCl. All the experiments were conducted at ambient temperature.3. Results and discussion
3.1. Physicochemical and morphological characterization
Polycrystalline X-ray diffraction was employed to identify the phase structure and constitution of the as-prepared samples. As shown in Fig. 2a and Fig. S2a, b (ESI†), the hydrothermal etching of W metal foil resulted in the formation of a single phase of well-crystallized monoclinic WO3 (JCPDS no. 43-1035) on the foil.28 Four weak characteristic peaks at 18.6°, 18.9°, 28.9°, and 30.5° appear, corresponding to the (110), (011), (121), and (040) crystallographic planes of monoclinic BiVO4 (JCPDS no. 14-0688), respectively, after the deposition of BiVO4 on the WO3 formed via 15 SILAR cycles.29 The presence of the crystalline BiVO4 in the WO3/BiVO4-15 sample would be further confirmed using the following HRTEM observations. | ||
| Fig. 2 (a) Wide-angle XRD patterns and magnified XRD patterns in the range of 16–32°. FESEM images of the top surface view of (b) WO3 (the inset image is the cross-sectional view) and (c) WO3/BiVO4-15. (d) TEM image of WO3. (e) TEM image of WO3/BiVO4-15 and the corresponding size distribution of BiVO4 nanoparticles. HRTEM images of (f) WO3 and (g) WO3/BiVO4-15. | ||
FESEM images (Fig. 2b and c) show that numerous stacked 2D nanosheets exist in both WO3 and WO3/BiVO4-15 samples, forming a layer with an average thickness of ∼2.5 μm on W foil. Besides the surface of the nanosheets in the WO3/BiVO4-15 sample being a little rough, no obvious differences between the WO3 and WO3/BiVO4-15 samples in the morphology are found. As displayed in the TEM images (Fig. 2d and e), a large number of nanoparticles with sizes ranging from 4.0 to 9.0 nm are uniformly dispersed on the surface of the nanosheets after BiVO4 deposition via 15 SILAR cycles. The HRTEM observations in Fig. 2f and g further show the highly crystalline nature of the nanosheets in both samples and nanoparticles in the WO3/BiVO4-15 sample, consistent with the above XRD results. The measured lattice fringes of ca. 0.365 nm in the nanosheets of both samples and ca. 0.237 nm in the nanoparticles of the WO3/BiVO4-15 sample match well with the crystallographic planes of monoclinic WO3 (200) and monoclinic BiVO4 (220), respectively. As is clearly observed in Fig. 2g, meanwhile, a crystalline grain with the lattice fringe of 0.237 nm is intimately deposited on the well-crystallized nanosheets with the lattice fringe of 0.365 nm, evidencing the formation of the WO3/BiVO4 heterojunction. Moreover, the presence and homogeneous distribution of various elements in the selected area of both samples are also demonstrated well by the EDS mapping images (Fig. S3, ESI†).
XPS analysis was used to investigate the compositions and chemical states of the surface elements in the prepared samples. The XPS survey spectra (Fig. S4, ESI†) clearly show the presence of W, O, Bi, V, and C elements in the corresponding samples, respectively. Fig. 3a displays the high-resolution XPS spectra of W 4f core levels for the pristine WO3 and WO3/BiVO4 heterojunction. In the case of the pristine WO3, two strong peaks at the binding energies of 35.23 eV and 37.35 eV correspond well to the W 4f7/2 and W 4f5/2 of W6+ in the monoclinic WO3, respectively.8,20 After the deposition of BiVO4 on WO3 in the case of the WO3/BiVO4 heterojunction, two peaks of the W 4f obviously shift to lower binding energies. As shown in the high-resolution XPS spectra of Bi 4f and V 2p core levels (Fig. 3b and c) for the pristine BiVO4 and WO3/BiVO4 heterojunction, conversely, two pairs of symmetrical peaks, assigned to the Bi 4f7/2 and Bi 4f5/2 of Bi3+ (Fig. 3b), and V 2p3/2 and V 2p1/2 of V5+ (Fig. 3c) in BiVO4, respectively, display a visual positive shift in binding energy after the loading of BiVO4 on WO3.30,31 These observed shifts in the binding energies of various cation core-level spectra in the pristine WO3 and BiVO4 after their combination indicate the electron migration from BiVO4 to WO3 for their Fermi level equilibrium across interface between them, reflecting the formation of the WO3/BiVO4 heterojunction. The XPS spectra were also applied to measure the total density of states distribution of the valence band (VB), as depicted in Fig. S5a (ESI†). It can be found that the valence band maximum (VBM) values for WO3 and BiVO4 are 2.73 eV and 2.40 eV, respectively, which are consistent with previous reports.17,32–35
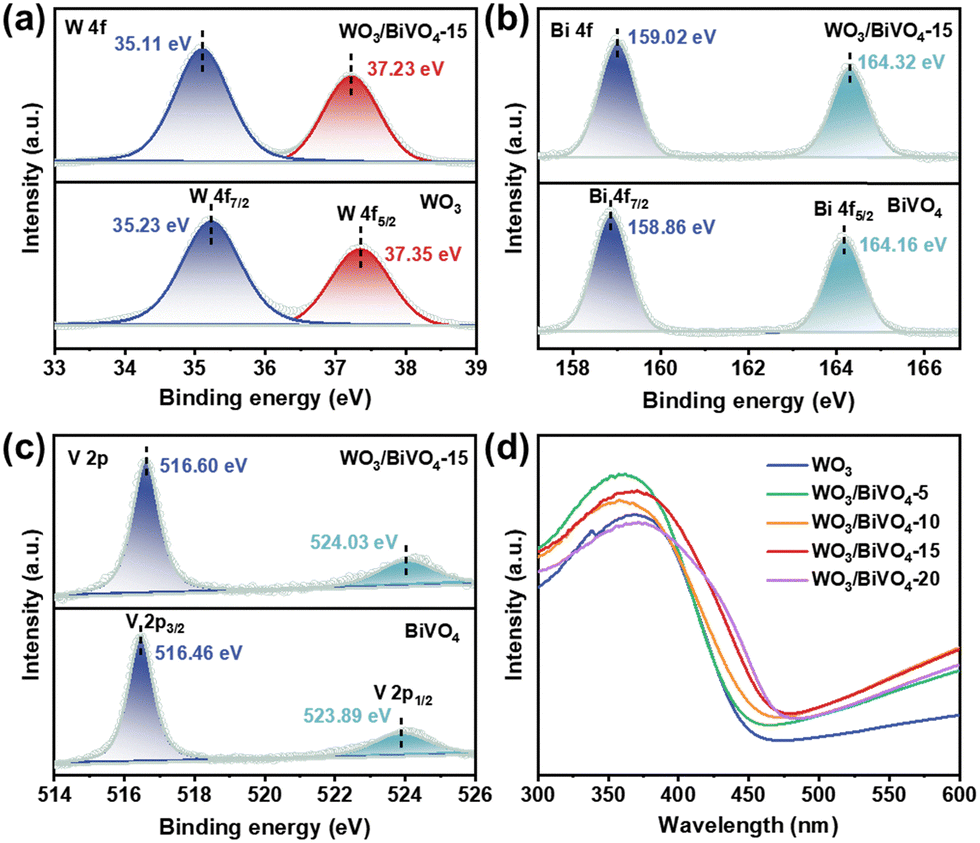 | ||
| Fig. 3 High-resolution XPS spectra of WO3, BiVO4 and WO3/BiVO4-15 films: (a) W 4f, (b) Bi 4f and (c) V 2p. (d) UV-vis diffuse reflectance spectra of WO3 and WO3/BiVO4-X films with different numbers of deposition cycles of BiVO4 (X = 5, 10, 15, and 20). | ||
The optical properties of the as-prepared samples were analyzed using UV-vis diffuse reflectance absorption spectroscopy, as displayed in Fig. 3d. The pristine WO3 exhibits an absorption edge at approximately 460 nm, which corresponds to its intrinsic bandgap absorption.32,36 With the deposited amount of BiVO4 by SILAR cycles, the absorption edge gradually expands from 460 nm to a longer wavelength, especially after 15 SILAR cycles. The x-axis intercepts of the tangents in the Tauc plots (Fig. S5b and c, ESI†) converted from the absorption spectra show that the band gap values (Eg) of the pristine WO3 and BiVO4 are 2.70 and 2.48 eV, respectively.37,38 Moreover, both the pristine WO3 and BiVO4 exhibit the Mott–Schottky plots with the positive slopes in Fig. S5d and e (ESI†), indicating their intrinsic n-type characteristic. The flat-band potentials (Efb) of the pristine WO3 and BiVO4 are estimated to be approximately 0.44 V and 0.21 V vs. NHE, respectively, based on their Mott–Schottky plots. As reported earlier, the flat-band potential (Efb) is the difference between the Fermi level and water-reduction potential.9,39 In other words, the measurement results of the flat-band potentials (Efb) indicate that the Fermi level of the pristine BiVO4 is higher than that of the pristine WO3, which is also supported by the electron transfer from BiVO4 to WO3 after their combination to form the heterojunction (see XPS results above). The information on the band structures and flat-band potentials (Efb) of the pristine WO3 and BiVO4 is summarized in Table 1.
| Sample | VBM (eV) | E g (eV) | CBM (eV) | E fb (V) vs. NHE |
|---|---|---|---|---|
| WO3 | 2.73 | 2.70 | 0.03 | 0.44 |
| BiVO4 | 2.40 | 2.48 | −0.08 | 0.21 |
3.2. PEC performances for pollutant degradation and H2 evolution
The performances of the PEC processes with the pristine WO3 and WO3/BiVO4-X heterojunctions as photoanodes at an applied bias potential (Vab) = 0.5 V were evaluated in terms of RhB degradation and H2 evolution, as depicted in Fig. 4a and b. The PEC performance for RhB degradation and H2 evolution is gradually enhanced with the deposition of BiVO4 on the WO3 photoanode via SILAR cycles and reaches an optimal level after 15 cycles. At the optimal level, the RhB degradation and H2 evolution are as high as 99.34% and 258.98 μmol h−1 cm−2, respectively, which are 2.20 and 4.09 times higher than those with pristine WO3 as the photoanode. The results further indicate that the deposition of BiVO4 on WO3 to form the heterojunction photoanode is an effective method for improving PEC performance. The stability of the PEC performance with the WO3/BiVO4 heterojunction as the photoanode at Vab = 0.5 V for RhB degradation and H2 evolution was also monitored by repeating the PEC reaction under the same conditions. After 10 cycles, as depicted in Fig. 4c, no obvious decreases in RhB degradation and H2 evolution as compared to the first cycle are observed, demonstrating the excellent stability of the heterojunction during the PEC reaction process. This result is in good agreement with the stable photocurrent density of the heterojunction photoanode observed during continuous operation for 48 h (Fig. 4d). In addition, the PEC performance of our fabricated photoanode is comparable to that of some recently reported WO3-based heterojunction photoanodes, as summarized in Table S1 (ESI†). | ||
| Fig. 4 PEC performances for (a) RhB degradation coupled with simultaneous (b) cathodic H2 evolution using the WO3 and WO3/BiVO4-X photoanodes (X = 5, 10, 15, and 20) at Vab = 0.5 V. (c) Cycling PEC performances for RhB degradation coupled with simultaneous cathodic H2 evolution using the WO3/BiVO4-15 photoanode at Vab = 0.5 V. (d) Current density stability tests in an aqueous solution of Na2SO4 (0.5 M). | ||
Moreover, it is worth noting that the PEC performances with the WO3/BiVO4 heterojunction as the photoanode are much more dependent on applied bias potential (Vab) than those with the pristine WO3 as the photoanode. As observed in Fig. 5a and b, there is a negligible difference between the PEC performances with the pristine WO3 and WO3/BiVO4-15 heterojunction as photoanodes when Vab = 0.0 V. However, the difference rapidly widens with the application of bias potential, achieving the optimal level observed above when Vab = 0.5 V. As is well known, the PEC performance is dominated by the charge transfer and separation over the photoanode. Therefore, the stronger dependence of the PEC performance with the WO3/BiVO4 heterojunction than the pristine WO3 as photoanode on the applied bias potential implies that the application of bias potential is more favorable for the transfer and separation of the photogenerated charges over the heterojunction than the pristine WO3, which will be further discussed below.
 | ||
| Fig. 5 PEC performances for (a) RhB degradation coupled with simultaneous (b) cathodic H2 evolution using the WO3 and WO3/BiVO4-15 photoanode under different applied bias potentials. | ||
To investigate the active oxidizing species involved in the RhB degradation during the PEC reaction with the heterojunction as the photoanode, the RhB degradation over the photoanode at Vab = 0.5 V was conducted in the presence of either hydroxyl radicals (˙OH) or photogenerated hole (h+) scavengers. As shown in Fig. S6a (ESI†), the degradation efficiency of RhB is significantly reduced with the addition of ˙OH scavenger tert-butanol (TBA), and almost no RhB degradation occurs when ethylenediaminetetraacetic acid disodium salt (EDTA-2Na) as an effective h+ scavenger is added into the solution of the photoanode chamber.40,41 The results reveal that both ˙OH and photogenerated holes (h+) are the active oxidizing species involved in RhB degradation. The photoexcited hole not only directly degrades RhB as an active species but also acts as the sole production source of ˙OH radicals, as a result, intrinsically determining the final PEC activity. Meanwhile, it is observed that the introduction of scavengers into the anodic chamber leads to stable or slightly enhanced cathodic H2 evolution. This improvement is ascribed to the accelerated consumption of photogenerated holes, which suppresses charge recombination and allows the transfer of more electrons to the cathode chamber for hydrogen production.
A fluorescence probe method with terephthalic acid (TA) as a trapping molecule was employed to monitor the generation of hydroxyl radicals (˙OH) during the PEC process. As shown in Fig. S6b–e (ESI†), a gradual increase in PL intensity at 425 nm is observed with prolonged reaction time. The PL intensity increases linearly as a function of reaction time, indicating that the amount of ˙OH generated on the surface of samples is proportional to the PEC reaction time. Moreover, the participation of ˙OH radicals in PEC processes for RhB degradation was also confirmed by in situ ESR measurements with DMPO as a ˙OH radical trapper (Fig. S6f, ESI†). Both ESR measurements and fluorescence probe analysis show the formation of more hydroxyl radicals (˙OH) over the heterojunction than over the pristine WO3 during the PEC reaction.
3.3. Charge transfer and separation in the WO3/BiVO4 heterojunction
It has been clearly demonstrated above (Fig. 4a and b) that the PEC performances for H2 evolution and RhB degradation are substantially enhanced after the combination of WO3 with BiVO4 to form a heterojunction photoanode. Generally, a heterojunction designed to be a photoanode or photocatalyst should be mainly conductive to promoting the transfer and separation of photogenerated charge through the intimate contact at the interface in addition to expanding the spectrum absorption range of a single component. According to the data listed in Table 1, the energy level diagrams of individual WO3 and BiVO4 before contact are given in Scheme 1a. After two semiconductors are brought into close contact to form a heterojunction, the matching of their Fermi levels causes a band shift and band bending at the heterojunction interface (Scheme 1b), building an internal electric field with the potential Vbi (=EF2 − EF1) from BiVO4 pointing to WO3. Upon light irradiation, the photogenerated charge transfer and separation in the heterojunction follow a direct Z-scheme mode. In the direct Z-scheme charge transfer process (Scheme 1c), the downward bending of the WO3 conduction band and the upward bending of the BiVO4 valence band at the interface encourage the photogenerated electrons on the WO3 conduction band to recombine with the photogenerated holes on BiVO4 valence band across the heterojunction interface, attaining the spatial separation of the photogenerated electrons on the BiVO4 conduction band and holes on the WO3 valence band. In other words, the photogenerated electrons on the conduction band of BiVO4 and the photogenerated holes on the valence band of WO3 are spatially separated at the cost of the recombination of the photogenerated electrons on the conduction band of WO3 and the photogenerated holes on the BiVO4, which, to a large extent, diminishes the advantage of the heterojunction in expanding the spectrum absorption range, or reduces the utilization efficiency of the photogenerated charges. This is further corroborated by LSV measurements under selective excitation of BiVO4 with visible-light irradiation (λ ≥ 500 nm) (Fig. S7a, ESI†), where the heterojunction displays a trend of the gradually increasing photocurrent density with the increase of the bias potential. The results further indicate the application of the bias potential gradually reduces, flattens, finally reverses the upward bending of the BiVO4 conduction band. Such a recombination channel between the electrons photogenerated in WO3 and holes in BiVO4 upon simultaneous excitation of both oxides has been well evidenced by the studies of the photoinduced charge-transfer dynamics in WO3/BiVO4.21–23 Moreover, the built-in potential barriers, caused by the upward bending of the BiVO4 conduction band and downward bending of the WO3 valence band, hold back the transfer of the separated electrons to the photocathode and the separated holes to the electrolyte, respectively, giving rise to the risk of their recombination. As a result, although the formation of the WO3/BiVO4 heterojunction expands the range of light absorption spectrum, the utilization and separation efficiencies of photogenerated charges over the heterojunction are not as efficient as expected. This is clearly reflected by the measurement results of the transient photocurrents (Fig. 6a), which show no apparent difference in the transient photocurrent between the WO3/BiVO4 heterojunction and the pristine WO3 photoanode.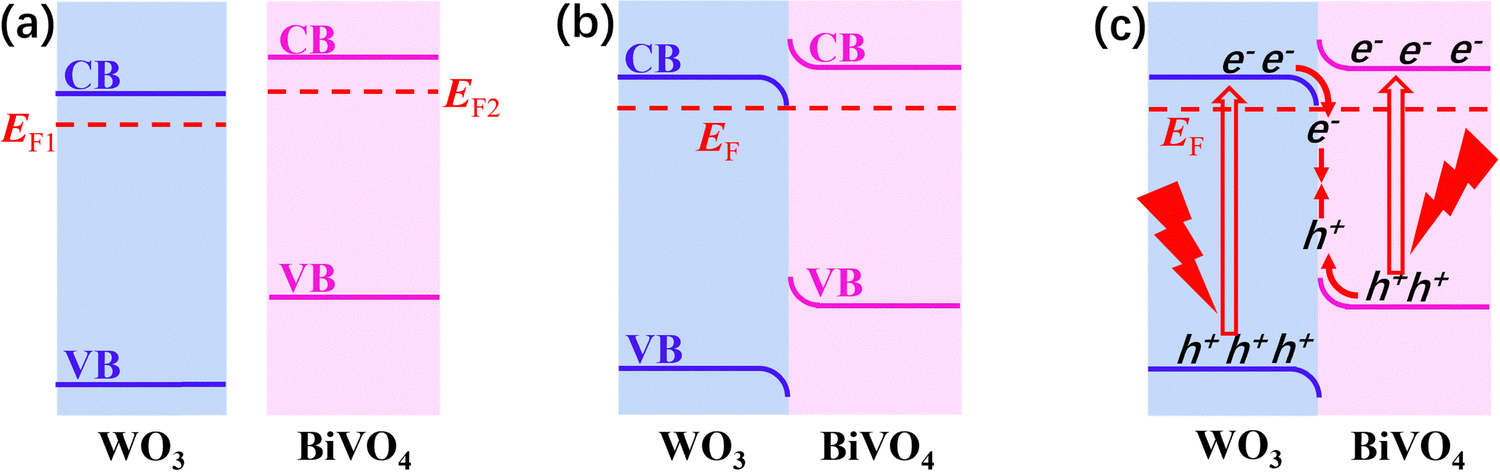 | ||
| Scheme 1 Energy band diagram of the WO3/BiVO4 heterojunction (a) before contact, (b) after contact, and (c) direct Z-scheme charge transfer process under light irradiation. EF1 and EF2 represent the Fermi levels of WO3 and BiVO4, respectively. | ||
 | ||
| Fig. 6 (a)–(c) Transient photocurrent responses of WO3 and WO3/BiVO4-15 photoanodes under different applied bias potentials. | ||
Interestingly, the transient photocurrent over WO3/BiVO4 heterojunction suddenly becomes higher and higher compared to that over pristine WO3 after the application and increase of an external bias potential with a direction opposite to the built-in electric field (forward bias potential). As shown in Fig. 6b and c, the intensity of the transient photocurrent over the heterojunction is 1.5 times higher than that of pristine WO3 at Vab = 0.2 V, and 2.9 times higher than that of pristine WO3 at Vab = 0.5 V, which parallels the PEC performances with the heterojunction and pristine WO3 as a photoanode, respectively (Fig. 5a and b). The results clearly indicate that the forward bias potential favors more efficient transfer and separation of the photogenerated charges over the heterojunction than pristine WO3. According to the classical theory of semiconductor heterojunctions, the application of an external bias breaks up the Fermi level equilibration in a semiconductor heterojunction at zero bias, reconstructing the energetic band alignment and bending of the components comprising the heterojunction at the interface.42 In the current case, as illustrated in Scheme 2a, the application of a forward bias gradually lowers the Fermi level of WO3 and lifts the Fermi level of BiVO4 with respect to those at zero bias, accompanied by the shifts in the band levels of both semiconductors, and reduction of their band bending at the interface. With the further increase of the applied bias potential, the band bending is flattened at Vab = Vbi (Scheme 2b), and finally reversed at Vab ≫ Vbi, forming a typical type II heterojunction (Scheme 2c). The evolutions in the reduction, flattening, and final reversal of the band bending of both semiconductors at the heterojunction interface by the applied bias potential, in the view of thermodynamics, not only eliminate the channel for the consumption of the photogenerated charges by recombination (Scheme 1c), but also promote the migration of more photogenerated electrons and holes over two semiconductors in opposite directions to achieve successful separation (Scheme 2d).
 | ||
| Scheme 2 (a)–(c) energy band evolution of the WO3/BiVO4 heterojunction at different applied bias potentials. (d) Photogenerated charge transfer and separation over the WO3/BiVO4 heterojunction at Vab ≫ −Vbi. | ||
The measurement results of the electrochemical impedance spectroscopy (EIS) in the presence of different applied bias potentials (Fig. S8a–c, ESI†) also coincide well with those of the transient photocurrent, where the curvature radius of the Nyquist curve becomes smaller with increasing applied bias potential. Therefore, as illustrated in Scheme 3, it is the applied bias potential to reverse the band bending of two semiconductors at the heterojunction interface to achieve efficient transfer and separation of more photogenerated charges for efficient PEC performances. Meanwhile, the maximum applied bias photon-current efficiency (ABPE) of the WO3/BiVO4-15 heterojunction photoanode, derived from LSV curves (Fig. 7a),20,43 is evaluated to be 1.07% at 0.52 V vs. Ag/AgCl, as compared to 0.41% at 0.33 V vs. Ag/AgCl for that of the pristine WO3 photoanode (Fig. 7b). In the presence of a hole scavenger (0.1 M Na2SO3), the calculated injection efficiency increases from 47.37% to 65.02% at around 0.5 V vs. Ag/AgCl, after the combination of WO3 with BiVO4 to form a heterojunction photoanode (Fig. 7c and Fig. S7b, ESI†). When the bias potential exceeds the optimal value around 0.5 V, the obvious decline in ABPE or charge injection efficiency of the heterojunction could be ascribed to the formation of a wider space charge layer at the semiconductor/electrolyte interface under a strong electric field.44,45 The formed wider space charge layer extends the migration distance of photogenerated holes required for water oxidation, thereby increasing the recombination of photogenerated electron–hole pairs.
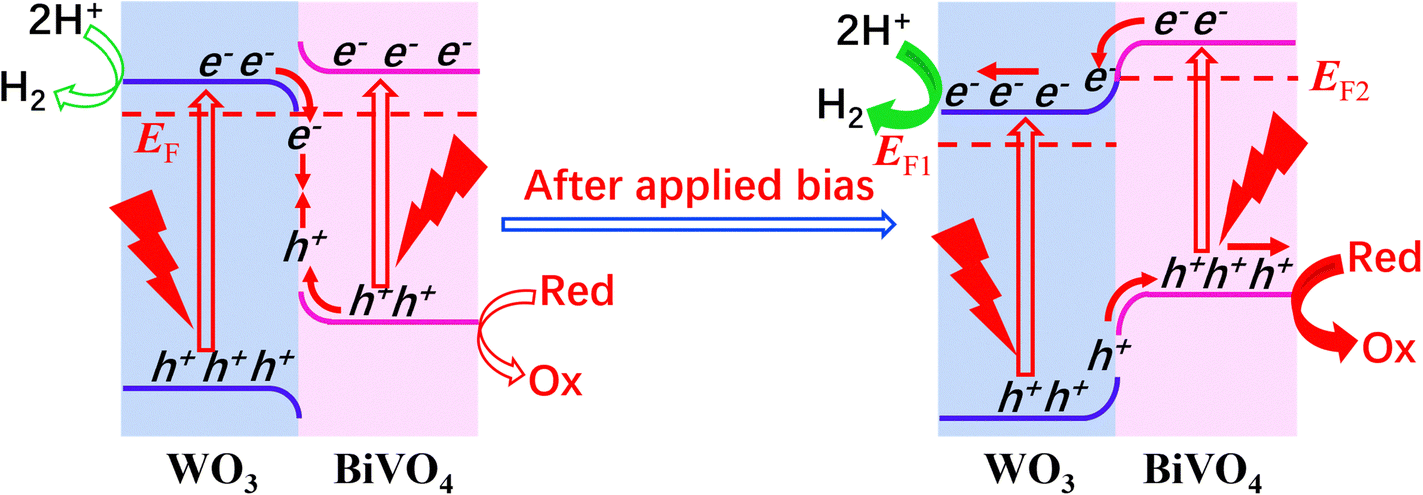 | ||
| Scheme 3 Reversal of the band bending of the WO3/BiVO4 heterojunction at the interface by applied bias to promote efficient transfer and separation of more photogenerated charges for enhanced PEC performances. | ||
 | ||
| Fig. 7 (a) LSV curves of WO3 and WO3/BiVO4-15 photoanodes measured in 0.5 M Na2SO4 electrolyte under visible-light irradiation. (b) ABPE spectra. (c) Calculated charge injection efficiencies as a function of potential for WO3 and WO3/BiVO4-15. | ||
4. Conclusions
Recent investigations have documented well that one of the most effective strategies for improving PEC performances is to design the heterojunction photoanode. The improvement in PEC performances strongly depends on not only the broader spectral absorption region of the heterojunction, but also the efficient charge separation at the heterojunction interface. In this work, a WO3/BiVO4 heterojunction on W metal foil has been successfully fabricated through a hydrothermal route, followed by a SILAR process. As a photoanode, in the presence of an appropriate applied bias potential, the WO3/BiVO4 heterojunction, especially after 15 SILAR cycles, exhibited much higher PEC performances for synergistic H2 evolution and organic pollutant degradation than pristine WO3. The enhanced PEC performance with the heterojunction as a photoanode strongly depends on the applied bias potential. By combining the photoelectrochemical features with the classical theory of semiconductor heterojunctions, it was rationally clarified that the evolution of the band bending at the WO3/BiVO4 heterojunction interface from diminishment to reversal by the applied bias potential effectively facilitates the transfer and separation of more photogenerated charges for the enhanced PEC performances. This study should provide an unconventional understanding of photogenerated charge transfer and separation over the WO3/BiVO4 heterojunction under an applied bias for the development of a potential heterojunction photoanode for an efficient PEC performance process.Author contributions
Yunni Liu: formal analysis, investigation, data curation, software and writing – original draft. Yuna Kang: formal analysis and supervision. Zhenyi Zhang: conceptualization, resources, methodology, review and editing. Jun Lin: conceptualization, funding acquisition, and writing – review & editing.Conflicts of interest
The authors declare that they have no competing financial interests that could have appeared to influence the work reported in this paper.Data availability
The supporting data for this study are shown in the ESI.† The data that support the findings of this study are available from the corresponding author upon reasonable request.Acknowledgements
This work was supported by the Outstanding Innovative Talents Cultivation Funded Programs 2024 of Renmin University of China and the National Natural Science Foundation of China (Grant No. U23A20102 and 22361142704).References
- S. Zhou, C. Jiang, J. Han, Y. Mu, J. R. Gong and J. Zhang, Adv. Funct. Mater., 2024, 2416922 Search PubMed
.
- Y.-P. Peng, H. Chen and C. P. Huang, Appl. Catal., B, 2017, 209, 437–446 CrossRef CAS
- Y. Gao, M. Zhang, Q. Zhao, W. Liu, L. Zheng, J. Ouyang and N. Na, Energy Environ. Sci., 2024, 17, 6268–6278 RSC
- D. Liu and Y. Kuang, Adv. Mater., 2024, 36, 2311692 CrossRef CAS PubMed
- T. H. Jeon, M. S. Koo, H. Kim and W. Choi, ACS Catal., 2018, 8, 11542–11563 CrossRef CAS
- Y. Yao, Q. Zhao, W. Wei, Z. Chen, Y. Zhu, P. Zhang, Z. Zhang and Y. Gao, Nano Energy, 2020, 68, 104350 CrossRef CAS
- J. Ma, K. Mao, J. Low, Z. Wang, D. Xi, W. Zhang, H. Ju, Z. Qi, R. Long, X. Wu, L. Song and Y. Xiong, Angew. Chem., Int. Ed., 2021, 60, 9357–9361 CrossRef CAS PubMed
- Y. Liu, Y. Zhou and J. Lin, J. Phys. Chem. C, 2024, 128, 15216–15224 CrossRef CAS
- X. Liu, H. Zhou, S. Pei, S. Xie and S. You, Chem. Eng. J., 2020, 381, 122740 CrossRef CAS
- H. Kong, H. Yang, J.-S. Park, W.-S. Chae, H. Y. Kim, J. Park, J. H. Lee, S. Y. Choi, M. Park, H. Kim, Y. Song, H. Park and J. Yeo, Adv. Funct. Mater., 2022, 32, 2204106 CrossRef CAS
- X. Shi, Q. Wu and C. Cui, ACS Catal., 2023, 13, 1470–1476 CrossRef CAS
- S. Adhikari, M. Murmu and D.-H. Kim, Small, 2022, 18, 2202654 CrossRef CAS PubMed
- J.-H. Kim, J. W. Yoon, T.-H. Kim, Y.-M. Jo, J.-S. Kim, S.-Y. Jeong and J.-H. Lee, Chem. Eng. J., 2021, 425, 131496 CrossRef CAS
- J.-T. Lee, Z.-C. Yan, K.-H. Lin, P.-H. Hsiao, P.-C. Liao, Y.-C. Pu and C.-Y. Chen, J. Mater. Chem. A, 2024, 12, 19277–19287 RSC
- J. Feng, H. Huang, W. Guo, X. Xu, Y. Yao, Z. Yu, Z. Li and Z. Zou, Chem. Eng. J., 2021, 417, 128095 CrossRef CAS
- B. S. Kalanoor, H. Seo and S. S. Kalanur, Mater. Sci. Energy Technol., 2018, 1, 49–62 Search PubMed
- Y. Liu, B. R. Wygant, K. Kawashima, O. Mabayoje, T. E. Hong, S.-G. Lee, J. Lin, J.-H. Kim, K. Yubuta, W. Li, J. Li and C. B. Mullins, Appl. Catal., B, 2019, 245, 227–239 CrossRef CAS
- C. Nomellini, A. Polo, C. A. Mesa, E. Pastor, G. Marra, I. Grigioni, M. V. Dozzi, S. Giménez and E. Selli, ACS Appl. Mater. Interfaces, 2023, 15, 52436–52447 CAS
- J.-R. Ding and K.-S. Kim, Chem. Eng. J., 2018, 334, 1650–1656 CrossRef CAS
- M. Kolaei, B.-K. Lee and Z. Masoumi, J. Alloys Compd., 2023, 968, 172133 CrossRef CAS
- I. Grigioni, M. Abdellah, A. Corti, M. V. Dozzi, L. Hammarström and E. Selli, J. Am. Chem. Soc., 2018, 140, 14042–14045 CrossRef CAS PubMed
- I. Grigioni, K. G. Stamplecoskie, D. H. Jara, M. V. Dozzi, A. Oriana, G. Cerullo, P. V. Kamat and E. Selli, ACS Energy Lett., 2017, 2, 1362–1367 CrossRef CAS
- I. Grigioni, L. Ganzer, F. V. A. Camargo, B. Bozzini, G. Cerullo and E. Selli, ACS Energy Lett., 2019, 4, 2213–2219 CrossRef CAS
- L. Kong, X. Guo, J. Xu, Z. Mo and L. Li, J. Photochem. Photobiol. A Chem., 2020, 401, 112760 CrossRef CAS
- M. M. Abouelela, G. Kawamura, W. K. Tan and A. Matsuda, J. Colloid Interface Sci., 2023, 629, 958–970 CrossRef CAS PubMed
- C. Seong, P. Mane, H. Bae, S. Lee, S. H. Kang, S.-W. Ryu and J.-S. Ha, J. Electrochem. Soc., 2022, 169, 016501 CrossRef CAS
- Q. Ma, R. Song, F. Ren, H. Wang, W. Gao, Z. Li and C. Li, Appl. Catal., B, 2022, 309, 121292 CrossRef CAS
- Y. Liu, W. Yao and J. Lin, Phys. Chem. Chem. Phys., 2023, 25, 15248–15256 RSC
- M. Xie, Z. Zhang, W. Han, X. Cheng, X. Li and E. Xie, J. Mater. Chem. A, 2017, 5, 10338–10346 RSC
- B. Liu, X. Jiang, X. Jiang, Y. Ma, Z. Zhang and W. Han, Inorg. Chem., 2021, 60, 3057–3064 CrossRef CAS PubMed
- J. Zuo, H. Guo, S. Chen, Y. Pei and C. Liu, Catal. Sci. Technol., 2023, 13, 3963–3973 RSC
- A. Polo, C. Nomellini, G. Marra, E. Selli and M. V. Dozzi, Catal. Today, 2025, 446, 115137 CrossRef CAS
- Y. Li, Q. Mei, Z. Liu, X. Hu, Z. Zhou, J. Huang, B. Bai, H. Liu, F. Ding and Q. Wang, Appl. Catal., B, 2022, 304, 120995 CrossRef CAS
- I. Rodríguez-Gutiérrez, E. Djatoubai, J. Su, A. Vega-Poot, G. Rodríguez-Gattorno, F. L. Souza and G. Oskam, Sol. Energy Mater. Sol. Cells, 2020, 208, 110378 CrossRef
- H. Guo, Y. Zhang, S. Wang, L. Li, W. Wang and Q. Sun, J. Electroanal. Chem., 2022, 907, 116033 CrossRef CAS
- W. Zhang, M. Tian, H. Jiao, H.-Y. Jiang and J. Tang, Chin. J. Catal., 2022, 43, 2321–2331 CrossRef CAS
- S. J. Hong, S. Lee, J. S. Jang and J. S. Lee, Energy Environ. Sci., 2011, 4, 1781–1787 RSC
- D. Coelho, J. P. R. S. Gaudêncio, S. A. Carminati, F. W. P. Ribeiro, A. F. Nogueira and L. H. Mascaro, Chem. Eng. J., 2020, 399, 125836 CrossRef CAS
- R. Shi, H.-F. Ye, F. Liang, Z. Wang, K. Li, Y. Weng, Z. Lin, W.-F. Fu, C.-M. Che and Y. Chen, Adv. Mater., 2018, 30, 1705941 CrossRef PubMed
- Y. Jin, P. Zhang, X. Wang, H. Ma and Y.-N. Zhang, Chem. Eng. J., 2024, 491, 152168 CrossRef CAS
- Y. Liu, Q. Li, Z. Lian, J. Fan, Y. Tao, G. Li and H. Li, Chem. Eng. J., 2022, 437, 135132 CrossRef CAS
-
D. A. Neamen, Semiconductor Physics and Devices Basic Principles, McGraw-Hill, 2003, vol. 277 Search PubMed
- Y. Xiao, M. Wang, D. Liu, J. Gao, J. Ding, H. Wang, H. B. Yang, F. Li, M. Chen, Y. Xu, D. Xu, Y.-X. Zhang, S. Fang, X. Ao, J. Wang, C. Su and B. Liu, Angew. Chem., Int. Ed., 2024, 63, e202319685 CrossRef CAS PubMed
- Y. Ma, S. R. Pendlebury, A. Reynal, F. Le Formal and J. R. Durrant, Chem. Sci., 2014, 5, 2964–2973 RSC
- S. Selim, L. Francàs, M. García-Tecedor, S. Corby, C. Blackman, S. Gimenez, J. R. Durrant and A. Kafizas, Chem. Sci., 2019, 10, 2643–2652 RSC
Footnote |
| † Electronic supplementary information (ESI) available: Fig. S1: schematic illustration of a PEC system using the WO3/BiVO4-15 photoanode. Fig. S2: wide-angle XRD patterns and magnified XRD patterns in the range of 16–32°. Fig. S3: TEM image of WO3/BiVO4-15 for TEM-EDS mapping and the corresponding EDS elemental mapping images. Fig. S4: XPS survey spectra. Fig. S5: XPS-VB spectra, Tauc plots and Mott–Schottky plots. Fig. S6: PEC performances for RhB degradation coupled with simultaneous cathodic H2 evolution using the WO3/BiVO4-15 photoanode in the presence of different scavengers. PL spectra of the reaction solution recorded at different PEC reaction times. ESR spectra. Fig. S7: LSV curves of WO3 and WO3/BiVO4-15 photoanodes measured in 0.5 M Na2SO4 electrolyte under visible-light irradiation (λ ≥ 500 nm). LSV curves measured in 0.5 M Na2SO4 electrolyte with and without a hole scavenger. Fig. S8: EIS spectra. Fig. S9: visible-light irradiation spectrum of a 300 W xenon lamp equipped with a UV-cutoff filter (λ ≥ 420 nm) showing power density as a function of wavelength. UV-vis absorption spectra and light harvesting efficiencies. Table S1: Comparison of our work with the recent WO3 heterojunction photoanodes in a PEC system. See DOI: https://doi.org/10.1039/d5cp01826a |
| This journal is © the Owner Societies 2025 |